
The most interesting dynamic underlying recent market behavior is the interplay between duration risk and recession risk. Duration measures the expected percentage change in the price of a bond or bond fund in response to a 1% (100 basis points) change in interest rates.
Current economic conditions feature widespread contraction, in real terms, which is being masked by well-above-average inflation rates. The recessionary environment, or inflationary contraction if you prefer, was covered in the following reports:
- “See the forest for the trees in IP”
- “Shipping and recession: To be or not to be?”
- “2023 economic outlook”
- “FedEx and the recession”
- “The recession is here, filter the noise”
The Yield Curve
Against the recessionary backdrop, the inverted yield curve begins to make sense. It is interesting that broad market commentary continues to look to the future for a recession following today’s inverted yield curve signal, rather than the present and the past. The inversion of the yield curve is shown below using the US 10-year Treasury bond yield minus the 2-year Treasury bond yield to define the yield curve.
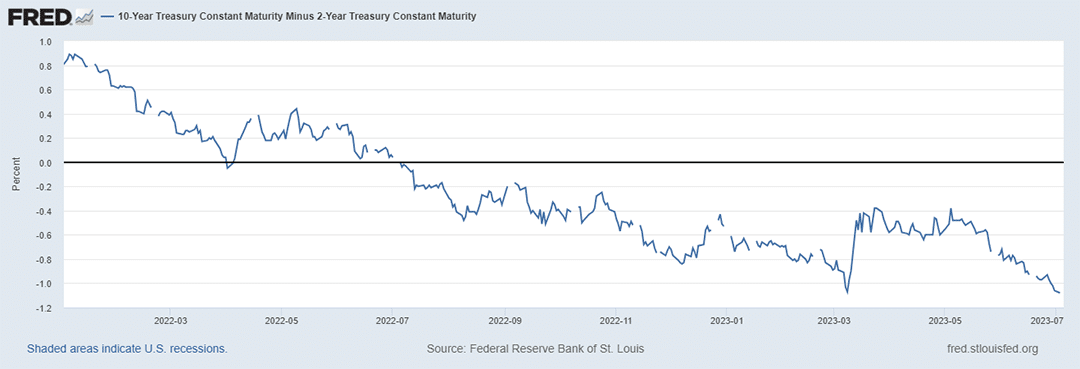
Source: St. Louis Federal Reserve
The US yield curve has been inverted for one year with a start date of July 6, 2022. Notably, the yield curve first inverted on April 1, 2022. Today, the 2-year bond yields 5.03% while the 10-year bond yields 4.05%. Furthest out on the US Treasury curve, the 30-year bond yields 4%. The following chart displays the 10-year minus 2-year Treasury yield curve over the past 47 years.
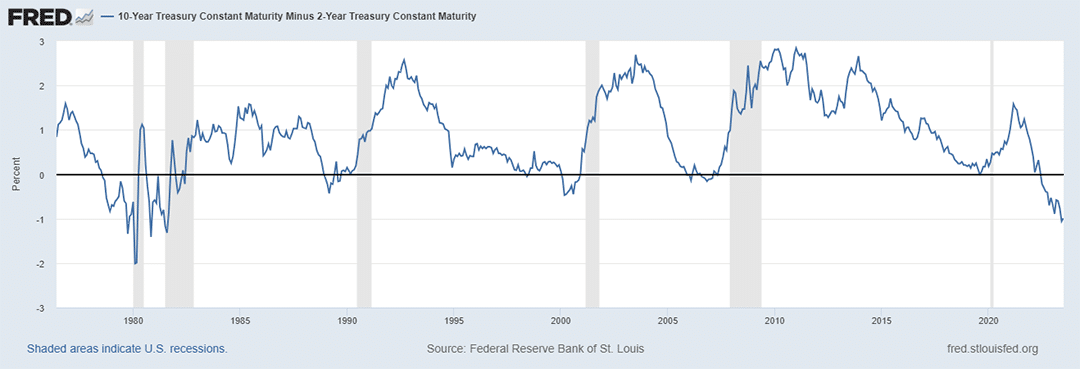
Source: St. Louis Federal Reserve
Notice that the current inversion is on par with the inversion of the late 1970s into early 1980s in terms of depth. In respect to length, the current inversion is at roughly 25% of the 1970s into 1980s inversion which lasted for 42 months.
The Message of the Bond Market
The comparison to the late 1970s into early 1980s inversion period reveals what I believe to be the most pertinent message of the current yield curve inversion. The following passage regarding the late 1970s and early 1980s inversion period is from the Yield Curve Epochs section of the June 9, 2022 report “S&P 500: The path forward” (emphasis added):
This epoch marked the last secular interest rate transition, from rising rates to falling rates. That period featured both an unusual inversion duration and unusual yield curve volatility, which would be likely signals of major regime changes in the bond market.
In the June 9, 2022 report, I made the following observations regarding the initial yield curve inversion on April 1, 2022 and the brief yield curve inversion in 2019, which are summarized in the table following the quote (emphasis added):
The duration of the two most recent epochs is clearly out of character compared to the preceding five cycles. If you blinked, you might have missed the 2022 epoch in its entirety as the yield curve inverted for only two days and regained upward slope within a mere two weeks. Time will tell if the 2022 epoch is an initial tremor or merely a blip on the screen.
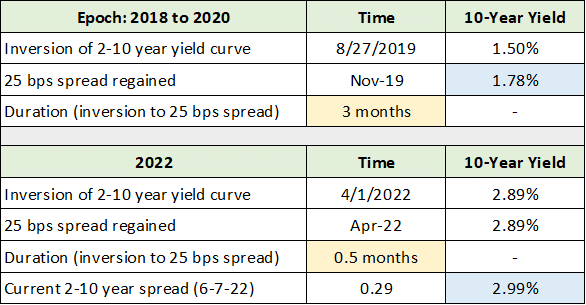
Created by Brian Kapp, stoxdox
In the current yield curve epoch, yield curve volatility is clearly on par with the prior rate reversal epoch of the late 1970s to early 1980s. As a result, I believe it is safe to say that the current bond market inversion is in fact a tremor as opposed to a blip on the screen.
The duration of the current inversion is yet to be determined as we officially completed year one on July 6, 2023. At this stage, all signs point toward a prolonged yield curve inversion as was the case in the prior secular rate reversal epoch. That said, the current episode is likely to remain well short of the 42-month inversion during the 1970s to 1980s.
My interpretation of the bond market signal is that we are undergoing a secular rate reversal from lower rates to higher rates. This is generally in alignment with Howard Mark’s views, the co-founder and co-chairman of Oaktree Capital Management, as expressed in a recent conversation with Margaret Franklin, CFA, president and CEO of CFA Institute (emphasis added):
I’m not saying interest rates are going to go back up. I just think they’re done coming down… One of the basic tenets of my thesis is that in the next five to 10 years, interest rates will not be constantly coming down or constantly ultra-low. And if that’s true, I think we’re in a different environment, and that’s a sea change.
Duration
Regarding interest rates no longer coming down, with the 10-year through 30-year US Treasury bond market yielding near 4%, the long end of the curve is likely nearing a new equilibrium yield level on the lower end. If true, that the low end of long-term yields is anchored nearby, this dynamic creates the foundation for widespread risk/reward asymmetries.
In fact, one could easily envision 5% to 6% yields at the long end of the curve, keeping in mind that yields are technically unbounded to the upside. This is especially true if the economy has been in a recession for the better part of nine months.
Duration Risk: TLT Example
If the economy has been contracting for nine months, being near the average length of a recession historically, it follows that we are likely closer to the end than the beginning of a recession. A resumption of real economic growth would lead to heightened risks of reigniting inflationary pressures which would place upward pressure on interest rates.
An example best illuminates the potential materialization of the duration risk which remains embedded in today’s market. The iShares 20+ Year Treasury Bond ETF (NASDAQ:TLT) is composed entirely of US Treasury bonds with maturities greater than 20 years. Treasury bonds have zero credit risk and are thus pure measures of interest rate risk, or duration risk.
The duration of the TLT bond fund as of July 5, 2023 is 17.42 years. Recall that duration measures the expected percentage change in the price of a bond or bond fund in response to a 1% (100 basis points) change in interest rates. If long-end rates move to the 5% or 6% range, the expected percentage change in the TLT is -17.42% and -34.84%, respectively. The 30-day SEC yield on the fund is currently 3.90%.
These potential downside estimates, under the scenarios of 5% or 6% rates at the long end of the bond market, would follow what has already been a duration massacre at the long end of the bond market. The following 20-year monthly chart depicts this reality for the TLT since it peaked between March and August 2020.
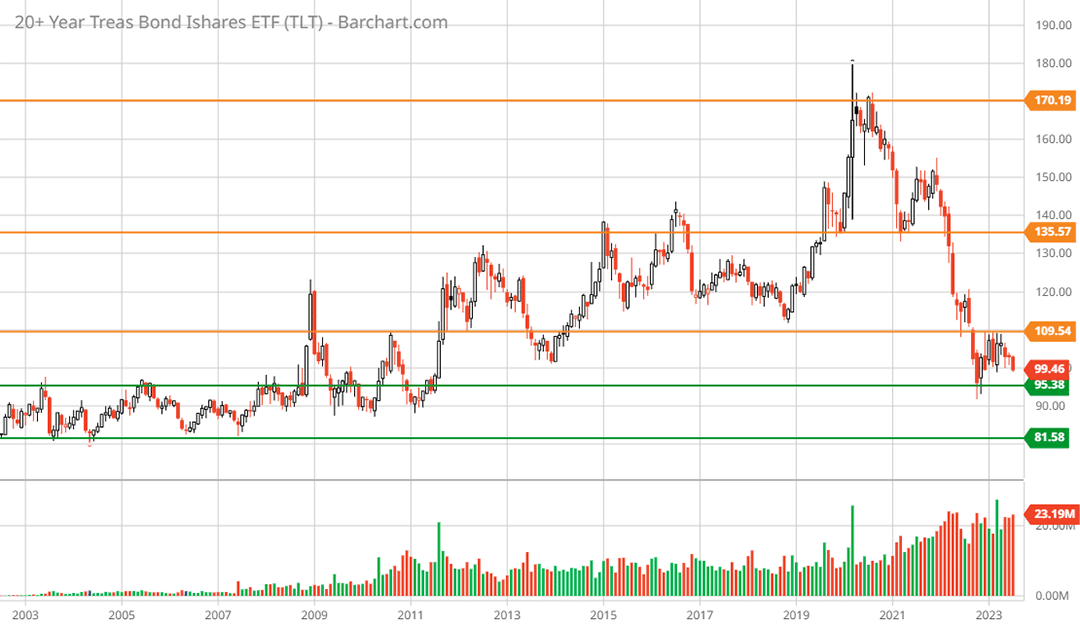
iShares 20+ Year Treasury Bond ETF TLT 20-year monthly chart. Created by Brian Kapp using a chart from Barchart.com
The TLT is down 42% since the monthly closing peak at $170 per share in 2020, which formed a double top on the monthly chart. Trading near $99.50 today, the downside price targets if yields reach 5% or 6% on the long end of the curve are $82 and $66, respectively. The $82 target aligns with the lowest visible technical support level, which is identified by the lower green horizontal line.
Prior to the 2008 financial crisis, 5% to 6% yields on the long end of the US Treasury curve were quite normal. This can be seen in the historical charts displayed below. The first is the history of the 30-year US Treasury bond yield and the second is the same for the 10-year Treasury bond yield.
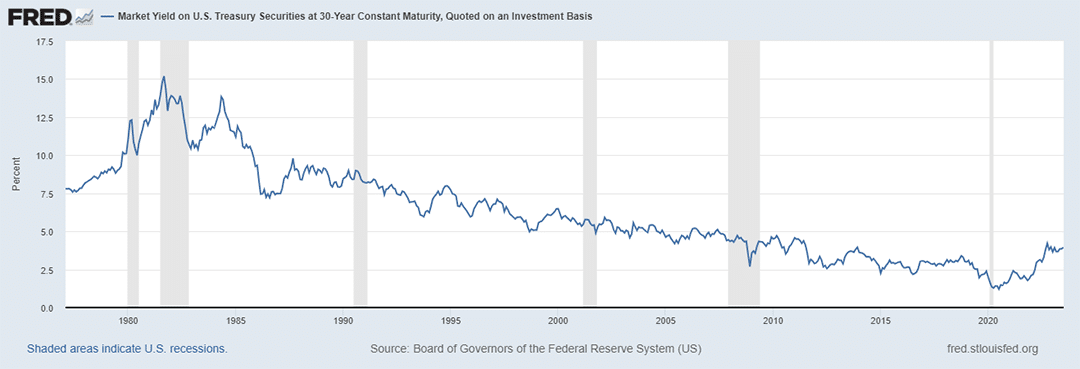
Source: St. Louis Federal Reserve
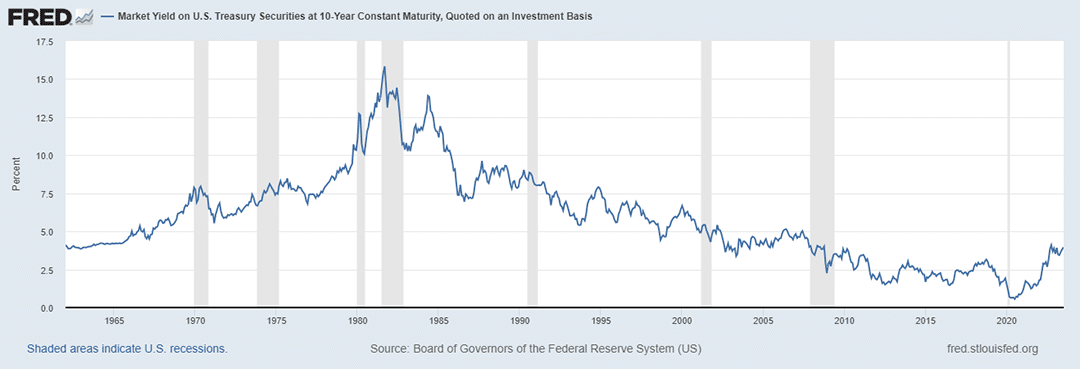
Source: St. Louis Federal Reserve
Using history as a guide, 5% on the 10-year US Treasury bond and 6% on the 30-year Treasury bond look to be reasonable baseline expectations. This is especially true if we are edging closer to the next cyclical upturn. As a result, a yield of 3.9% and a duration of 17.46 years on the long end of the curve, as defined by the TLT, exposes one to substantial duration risk.
Short-Term Bonds
For bond investors, given the heightened duration risk at the long end of the bond market, shorter-term bonds offer an asymmetric risk/reward opportunity. For example, the iShares 1-3 Year Treasury Bond ETF (NASDAQ:SHY) offers a 30-day SEC yield of 4.74% and a duration of only 1.87 years compared to 3.90% and 17.46 years for the TLT.
One can materially increase cash flow on the short end of the curve while eliminating duration risk for all intents and purposes. The 2-year Treasury bond is especially attractive as one can lock in over 5% today while offering the potential for capital appreciation if short term rates begin to recede as the yield curve normalizes and regains an upward slope.
Summary
In summary, the inverted yield curve is in sync with a recession being in progress today. In this respect, the bond market is in full agreement with the recessionary reports referenced at the beginning of this report. If correct, yields at the long end of the bond market are at risk of moving materially higher as the economy cycles back to a growth phase in 2024.
In the next report I will explore the implications for the stock market resulting from the interplay between duration risk and recession risk. While stocks do not technically have a measure of duration, the concept of duration risk is directly applicable to stocks. Similar to bonds, if the low end of long-term yields is anchored nearby, the dynamic creates the foundation for widespread risk/reward asymmetries across the stock market.