
One would be hard pressed to find a more boring company than International paper (NYSE:IP), a global leader in the industrial packaging industry. For all intents and purposes, the company is a box maker.
The Forest for the Trees
The boring, and thus predictable nature of International Paper is precisely the opportunity on offer given the recessionary backdrop discussed in the following articles:
- “Shipping and recession: To be or not to be?”
- “2023 economic outlook”
- “FedEx and the recession”
- “The recession is here, filter the noise”
The shipping industry reports above reflect the recessionary conditions in effect for International Paper. FedEx, in essence, is a box delivery company and is seeing shipping volumes contract in the low double digit percentage range. International paper, as a supplier to FedEx’s shipping customers, is further up the supply chain and seeing similar volume contractions.
The following table was compiled from International Paper’s Q1 2023 10-Q filed with the SEC and displays the year-over-year percentage decline in volumes in the far right-hand column.
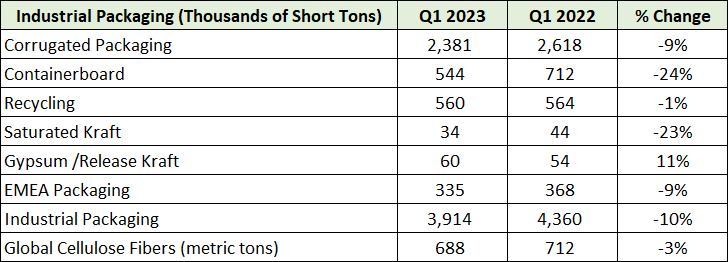
Created by Brian Kapp, stoxdox
Just as FedEx priced in the recession and offered an asymmetric risk/reward opportunity, as discussed in the October 2022 report “FedEx and the recession”, International Paper has reached a similar stage in its cycle.
Seeing the forest for the trees, as it pertains to International Paper, is seeing that the company is a cyclical opportunity. Such opportunities were discussed in “Magellan and navigating uncharted markets,” and are one of Peter Lynch’s primary mental groups for filtering stocks.
The Trees
By their very nature, cyclical stocks offer the greatest risk/reward asymmetry during recessionary conditions. In the case of International Paper, the company offers the added benefit of being a quality leader within a highly leveraged industry. As a result, times of industry stress may offer additional consolidation opportunities to augment the next cyclical upturn.
Financial Overview
As of December 31, 2022, International Paper’s long-term credit ratings were BBB (S&P, stable outlook) and Baa2 (Moody’s, stable outlook). While at the low end, IP has an investment grade credit rating which affords it a cost of capital advantage within the group. The following image from International Paper’s April 26, 2023 Q1 2023 Earnings Presentation displays its debt maturities.
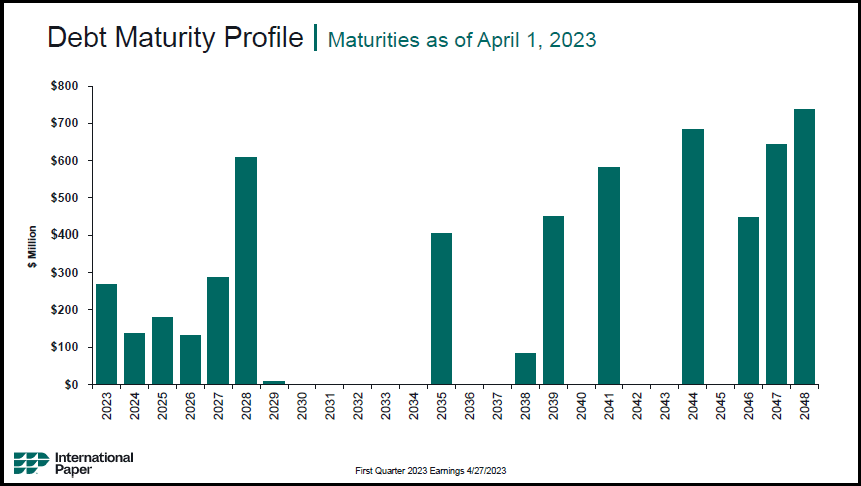
Source: International Paper First Quarter 2023 Earnings presentation
IP’s debt maturities are laddered to provide maximum financial optionality with the majority of maturities occurring beyond 2035. The only material maturity nearer term in relation to IP’s free cash flow generation in recent years is 2028 at $600 million. IP’s average free cash flow for the past three years was $1.67 billion per year with a range of $1.2 billion to $2.3 billion, as can be seen in the following slide from the Q1 earnings presentation.
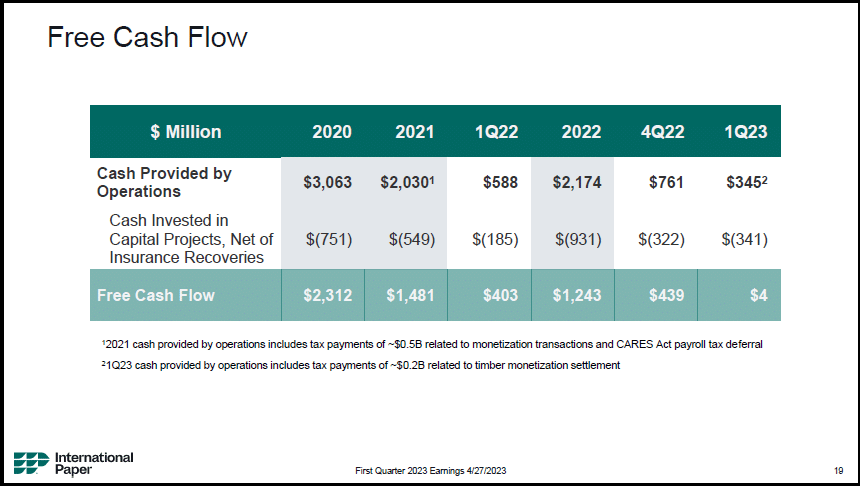
Source: International Paper First Quarter 2023 Earnings presentation
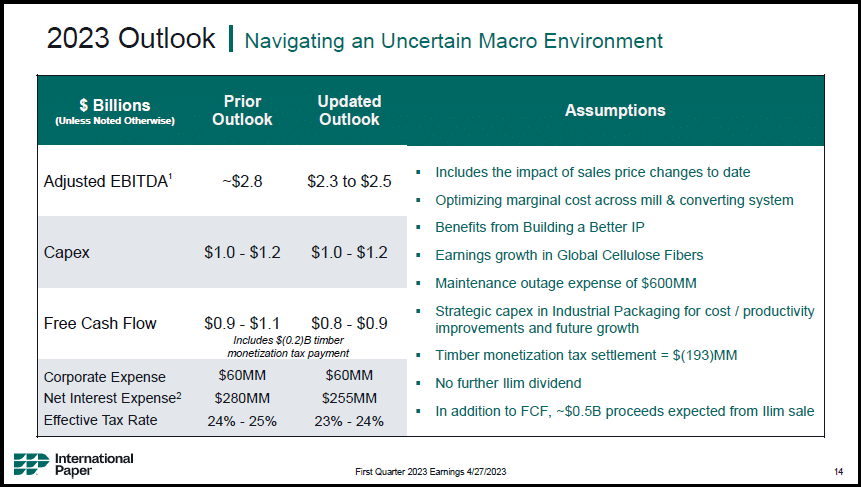
You will notice that Q1 2023 free cash flow was marginal in relation to Q1 2022 and reflects the recessionary conditions. IP is forecasting free cash flow to be $850 million at the midpoint of its guidance for 2023. The following slide displays IP’s expectations for 2023 as of April 26, 2023.
IP’s free cash flow is being returned to shareholders in the form of dividends and share buybacks. The dividend yield, at $31 per share, is substantial at 5.9%, thus offering the added benefit of bond-like cash flow. As can be seen in the following slide, share repurchases were on par with dividend payments in Q1 2023.
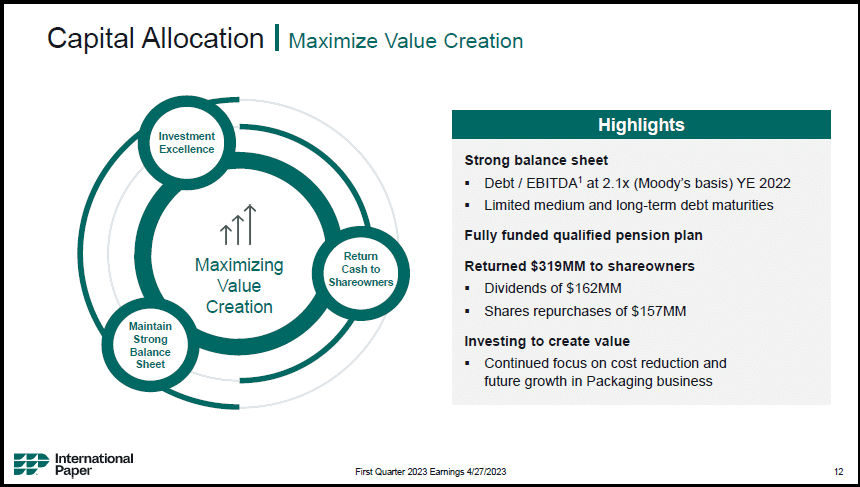
Source: International Paper First Quarter 2023 Earnings presentation
While IP is clearly in a recession, the stage of the profit cycle looks to be nearing a bottom as inflationary cost pressures reverse alongside volumes stabilizing. The following slide from the Q1 2023 earnings presentation displays the improving margin picture.
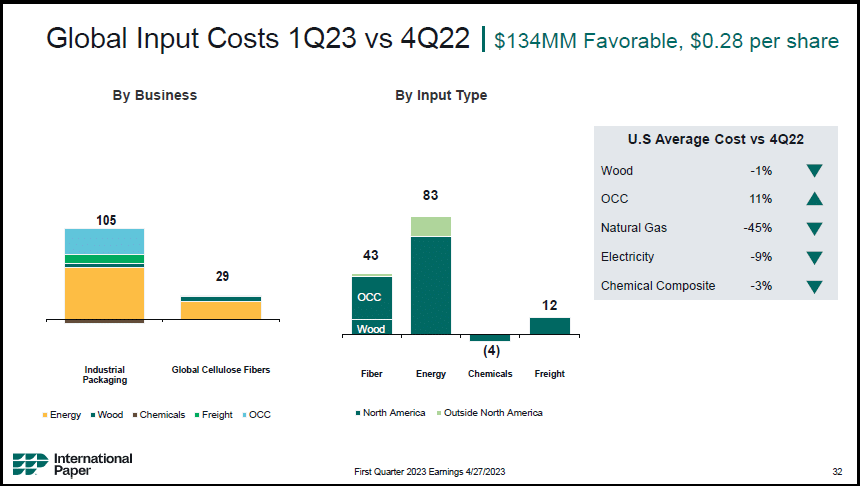
Source: International Paper First Quarter 2023 Earnings presentation
Technicals
The technical picture is a mirror image of the fundamental backdrop. In the long-term monthly chart below, I have outlined the primary resistance level with the green horizontal line. This serves as a technical upside price target, which is 103% higher. The orange horizontal line represents the primary support level, or technical downside price target, which dates back to the early 1990s.
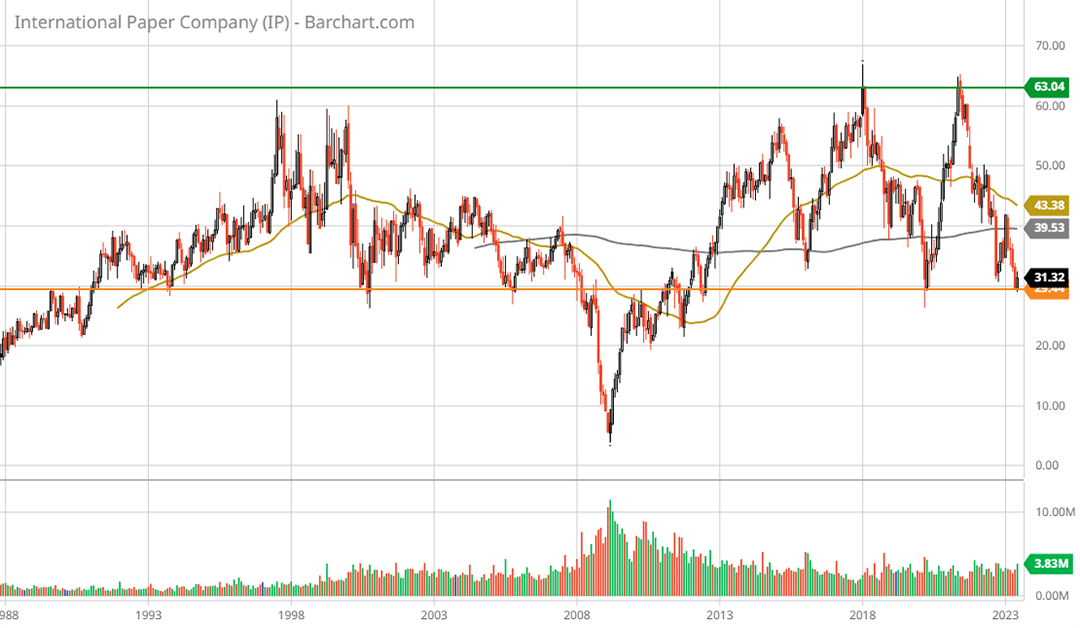
International Paper long-term monthly chart. Created by Brian Kapp using a chart from Barchart.com
With IP trading on the primary support level today and given the recessionary stage of the economic cycle, the shares should find incredibly strong support nearby. The following 5-year weekly chart provides a closer look at IP’s recent trading range.
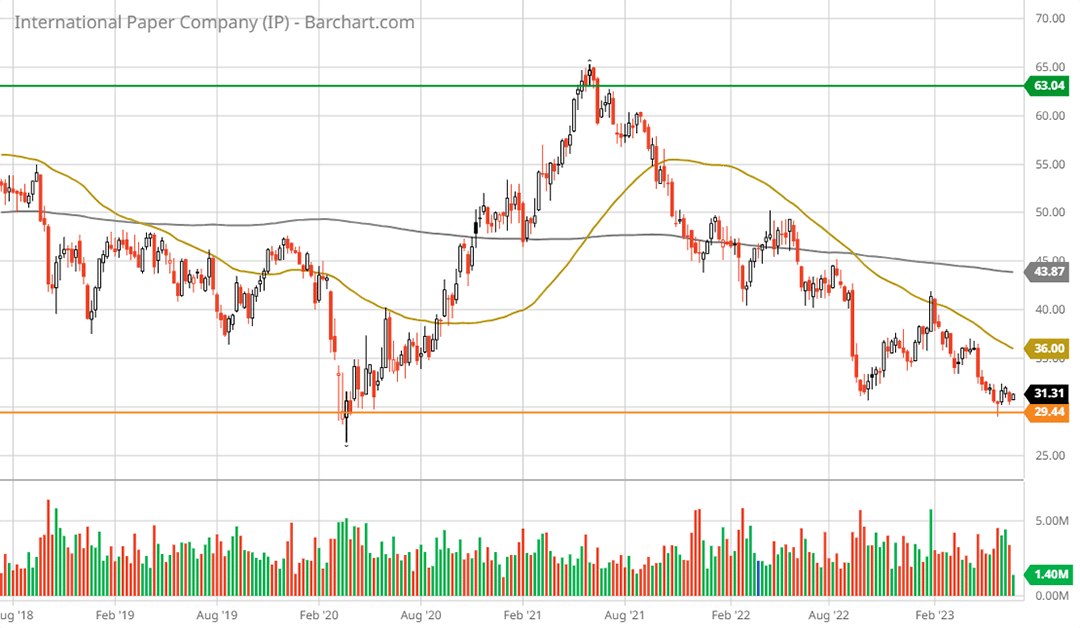
International Paper 5-year weekly chart. Created by Brian Kapp using a chart from Barchart.com
Summary
Sitting on primary support with 103% upside to primary resistance, International Paper stands out as a highly asymmetric risk/reward opportunity. The technical asymmetry finds fundamental support.
IP generates a substantial amount of free cash flow. The free cash flow enables IP to pay a bond-like dividend which yields 5.9%. Additionally, IP is actively repurchasing shares in amounts that often rival its dividend payments, as was the case in Q1 2023.
Stepping back to see the forest for the trees in the IP investment case, given the recessionary stage of the cycle, cyclical stocks are within the ideal window for accumulation. As such, International Paper stands out as a top choice.
Price as of this report: $31.31
International Paper Investor Relations website