
As stoxdox’s daily operations remain severely disrupted by the opposition to stoxdox’s brand at the United States Patent and Trademark Office, this report will offer a brief market update. We apologize for the service disruptions caused by the USPTO opposer and its related demands on our resources and time. Unfortunately, we are unable to estimate if and when the disruptions to stoxdox’s daily operations will end.
Market Outlook
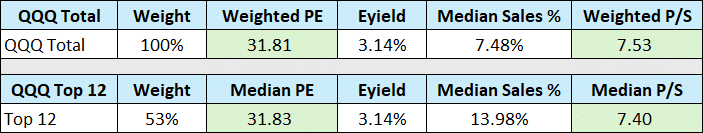
Turning to the US equity market, what immediately becomes clear is that the primary determinants of the US “stock market” looking forward are the mega-cap US technology companies. As such, I will review the Invesco QQQ Trust (NASDAQ:QQQ) which serves as an excellent proxy for the largest US technology firms. The following table displays summary data for the entire QQQ portfolio (top section) as well as for the top 12 companies in the QQQ (bottom section).
Source: Invesco. Created by Brian Kapp, stoxdox
I have highlighted in green the summary valuation data for the entire QQQ Trust and for the top 12 stocks in the portfolio. The top 12 stocks, which represent 53% of the portfolio, perfectly capture the summary valuation data for the entire QQQ portfolio. Please note that all data uses the current year consensus estimates and the data was compiled on February 21, 2024, just prior to the 3% QQQ rally on February 22, 2024. As such, valuations are higher by roughly the same, 3%.
Importantly, the median sales estimate during the current year across the entire portfolio is a mere 7.48%. This level of sales growth is largely indistinguishable from recent nominal GDP growth. Furthermore, this relatively average sales growth rate is not the type of growth one would expect from a portfolio with an earnings yield of roughly 3% and which is priced at 7.53x sales. For reference, US Treasury Bills yield 5.38% and the 10-year US Treasury Bond yields 4.25%.
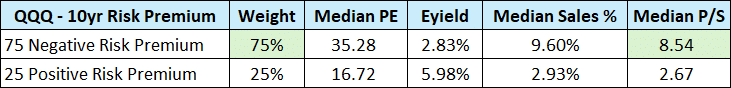
No matter which Treasury rates are used for comparison, the QQQ Trust offers a materially negative risk premium (defined as the earnings yield minus Treasury yields). Breaking down the QQQ portfolio by negative and positive risk premiums compared to 10-year US Treasuries provides additional color. The following table displays summary valuation and growth data for each of the two baskets within the QQQ portfolio.
Created by Brian Kapp, stoxdox
I have highlighted in green data for the negative risk premium stocks, which account for 75% of the QQQ Trust. Notice that the median sales growth expected for the group is 9.6%, while the group trades at a median price-to-sales ratio of 8.54x expected sales and an expected earnings yield of 2.83%. It is self-evident that the margin for error of the negative risk premium stocks is quite slim and may even be nonexistent.
Looking to the positive risk premium stocks, which comprise 25% of the portfolio, valuations are well within historical norms. With a median earnings yield of 5.98% and trading at 2.67x sales, the positive risk premium basket is relatively attractive compared to the negative risk premium stocks and US Treasury bonds. Though the group has too small of a weighting to compensate for the negative risk premium stocks, the positive risk premium stocks trade at levels which offer a reasonable margin of safety.
Growth vs Valuation
The primary difference between the negative and positive risk premium stocks lies in the expected growth rates of each basket, 9.6% growth compared to 2.93% sales growth for the current year, respectively. As such, the question turns to whether or not the valuation discrepancy between the two groups within the QQQs is appropriate given the expected growth rate differences? The answer to this question has larger implications across markets and asset classes.
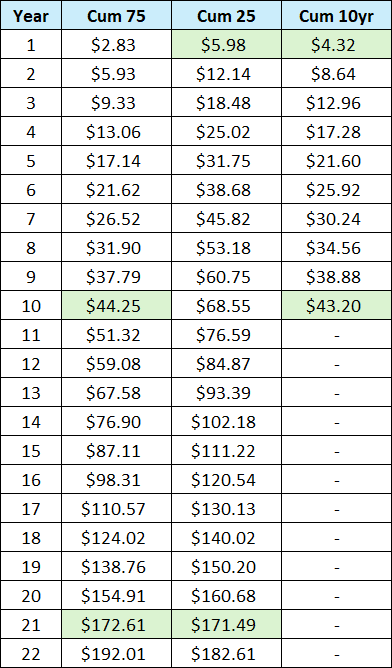
To shed light on this key question, I ran a simple forward projection to illuminate the time dimension, which reflects the ‘duration’ risk of each basket of stocks. They are also compared to the 10-year US Treasury bond, which serves as the risk free asset. In the following table, the median forecasted sales growth rate for the current year is used as the expected earnings growth rate into the indefinite future (9.6% for the negative risk premium stocks and 2.93% for the positive risk premium group). The table displays a rough approximation of the expected breakeven date between the two groups within the QQQ Trust and the 10-year Treasury bond.
Created by Brian Kapp, stoxdox
Please note that I have taken the earnings yield expected in the current year as the earnings for year one, as if each basket were priced at $100 per share. Each subsequent year represents the cumulative earnings of each group. The right-hand column includes the US 10-year Treasury bond which was yielding 4.32% on February 21, 2024.
The forward projections illuminate the primary question: when will the higher growth rate overcome the higher valuation of the negative risk premium group? Said differently, when will the slower growth rate and higher earnings yield of the positive risk premium group be overcome by the higher growth rate of the negative risk premium stocks?
I have highlighted in green the years in which the cumulative earnings for each of the three columns become equal, meaning, when one’s cumulative expected earnings are the same for each group. In essence, the green highlighted cells represent the year by which an investor would be indifferent between holding each basket.
In year one, the positive risk premium stocks surpass the expected earnings of the 10-year Treasury bond. The Negative risk premium stocks do not surpass the expected earnings from the 10-year Treasury bond until year ten. Comparing the two stock baskets, cumulative earnings from the negative risk premium stocks would be expected to surpass those of the positive risk premium stocks in year 21.
Summary
In summary, the bar is set quite high for investors in the negative risk premium stock basket, which comprises 75% of the QQQ portfolio. While the assumptions above are overly simplistic, the projection illuminates the key problem facing QQQ investors today: the level of ‘duration risk’ embedded in 75% of the portfolio, the negative risk premium stocks. The earnings breakeven time in relation to US Treasuries is ten years and becomes quite extreme at 21 years compared to the positive risk premium stocks.
Ten to 21 years is a long time to wait in order to breakeven (equivalent earnings) for most investor classes, which illuminates the absence of a margin for error across roughly 75% of the QQQ portfolio. As such, investors would be well served to search for opportunities beneath the market cap-weighted equity surface, as discussed in “Lost in translation,” “The upside down,” “A bird in the hand,” and Pavlov’s Stocks.”