
This is the third and final report in the duration series, following “Mind your duration” and “Pavlov’s stocks.” As this report will focus on the relative opportunities in the stock market, an old proverb comes to mind which captures the essence of the duration question: “A bird in the hand is worth two in the bush.”
The proverb conveys that what is guaranteed or highly likely to occur, such as having a bird in your hand, is preferable to the possibility of more under conditions of uncertainty, such as the possibility of two birds in the bush. This commonsense proverb is directly applicable to the construct of “duration risk” for viewing risk/reward asymmetries across today’s markets.
“Duration Risk”
Recall that duration in the bond market is the expected percentage change in the price of a bond or bond fund if interest rates change by 1% or 100 basis points. In “Mind your duration,” the duration of the long-term US Treasury bond market, as defined by the iShares 20+ Year Treasury Bond ETF (NASDAQ:TLT), was 17.42 years with a 30-day SEC yield of 3.90%.
In “Pavlov’s stocks,” the concept of duration risk was applied to the top ten companies in the US stock market, using the SPDR® S&P 500® ETF Trust (NYSE:SPY) as a proxy for the US stock market. The following quote from that report captures the exposure to “duration risk” as applied to the stock market (emphasis added). The 17.42 year duration and 3.9% yield at the long end of the Treasury bond market serve as an excellent foundation and reference point.
Given that 23% of the S&P 500 is trading at a median earnings yield of 1.83% based on current year consensus earnings estimates, it is difficult to envision a fundamental catalyst that will sustain a new bull market in the US market-cap-weighted indices.
A rough estimate of what I termed “pure duration risk” for the top five “Duration Risk” companies, which comprise 23% of the S&P 500 Index, is contained in the following quote from the report:
If valuations were to revert… the median earnings “yield” increase would be 2.93%. When combined with a potential return of -61.55%, the duration of the “Duration Risk” group can be thought of as 21 years.
Within the construct of “duration risk” applied to the stock market, the quote below is the concluding summary from “Pavlov’s stocks” and sets the stage for viewing risk/reward asymmetries.
The market has priced in a continuation of the conditions which have existed since the 2008 crisis: lower rates (the inverted yield curve) combined with lower equity “yields” (higher equity valuations). As discussed in “Mind your duration,” I view this to be at odds with the historical evidence and the most likely pathway forward.
In summary, if the low end of long-term yields is anchored nearby, the dynamic creates the foundation for widespread risk/reward asymmetries across the stock market. With limited upside potential in the market-cap-weighted indices, the risk/reward asymmetries can be found under the market-cap surface. I will cover these asymmetric opportunities within the construct of “duration” in the next report.
Risk/Reward Asymmetries
There are many asymmetric risk/reward opportunities in today’s markets, this is especially true when viewing the opportunity set within a “duration risk” framework. The following table from “Pavlov’s stocks” displays summary statistics through 2027 for the top ten companies of the S&P 500 using consensus earnings estimates. The top ten companies in the S&P 500 account for 32% of the index.
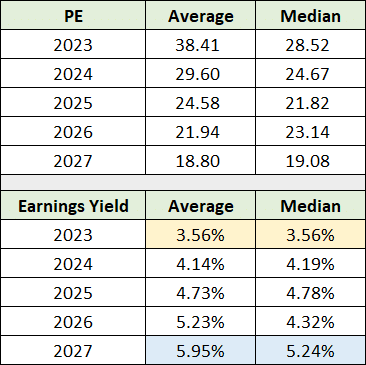
Source: Seeking Alpha. Created by Brian Kapp, stoxdox
With an average earnings yield of 3.56% based on 2023 earnings estimates, there is material duration risk if long-term interest rates are well-anchored nearby. If long-term rates move into a historically normal range of 5% to 6%, as discussed in “Mind your duration,” earnings yields of the leading S&P 500 companies will not become competitive with long-term bonds until 2027. There is substantial “duration risk” embedded in a 3.56% yield under a long-term interest rate normalization scenario.
The next table displays the same data for a group of ten stocks which I have covered in the recent past, referred to here as my basket of ten stocks. They include Eastman Chemical (NYSE:EMN), Rio Tinto (NYSE:RIO), Pfizer (NYSE:PFE), Comcast (NASDAQ:CMCSA), IBM (NYSE:IBM), NOV (NYSE:NOV), General Motors (NYSE:GM), International Paper (NYSE:IP), American Eagle Outfitters (NYSE:AEO), and Victoria’s Secret (NYSE:VSCO).
They were selected as examples of the traits that offer asymmetric risk/reward opportunities in the context of “duration risk” in today’s market. What you will notice in the summary statistics for the group is that there is zero duration risk for all intents and purposes. I have highlighted the average and median earnings yields based on consensus estimates for 2023 and 2027 for ease of comparison with the above table covering the top ten companies of the S&P 500.
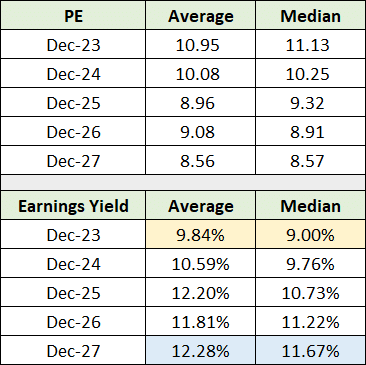
Source: Seeking Alpha. Created by Brian Kapp, stoxdox
Comparing the earnings yields in the above table to the prior table, notice that the 5.5% to 6.5% earnings yield spread over the top ten companies in the S&P 500 persists through mid-decade. Furthermore, an earnings yield in the 9% to 10% range for the basket of ten stocks, compared to 3.9% on long-term treasury bonds, provides a sizeable Equity Risk Premium in the 5% to 6% range compared to 0% to 1% for the top ten companies in the S&P 500 Index.
The yield gap between my basket of ten stocks and the two groups within the top ten companies of the S&P 500, the “Duration Risk” and “Market Risk” groups, further illuminates the “yield” dispersions in the market. In the following table I compare my basket of ten stocks to each group with 2024 and 2027 color coded for ease of comparison.
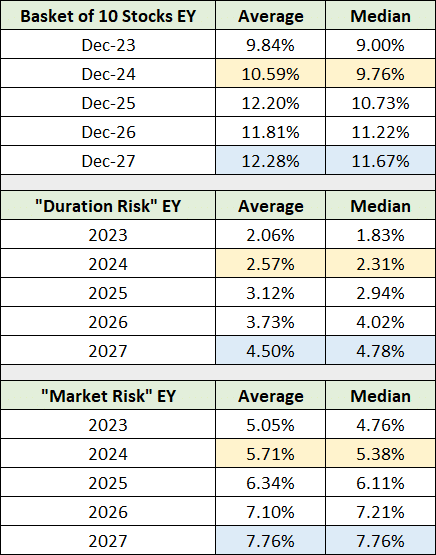
Source: Seeking Alpha. Created by Brian Kapp, stoxdox
Notice the wide earnings yield spread between the basket of ten stocks and the top five “Duration Risk” and top five “Market Risk” stocks within the top ten companies of the S&P 500 Index. Furthermore, the yield spread persists through 2027. The earnings yield spread and its persistence in comparison to the two S&P 500 groups is displayed below.
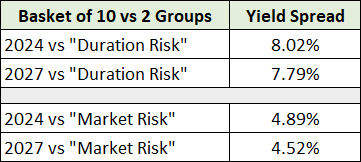
Source: Seeking Alpha. Created by Brian Kapp, stoxdox
In relation to the S&P 500 Index in its entirety, with an earnings yield of 4.95% based on current year earnings estimates, the “yield” spread for my basket of ten companies is nearly 5% or double the S&P 500 earnings yield. Additionally, my basket of ten stocks has an average dividend yield of 3.32% compared to 1.43% for the S&P 500 Index. The top five dividend yielding companies in my basket have an average dividend yield of 5.35%.
In summary, there are extreme risk/reward asymmetries under the market-cap-weighted surface. This is especially true when viewing the opportunity set with a “duration risk” lens.
Technicals
The technical backdrop for the basket of ten stocks is a mirror image of the fundamental asymmetry on display when comparing the ten stock basket to the bond market and the market-cap-weighted stock indices.
In the following weekly charts of each of the ten stocks in the basket, the green line represents the key support level for each company. The gold line is the 50-week moving average and the grey line is the 200-week moving average.
What you will notice on each chart is the proximity to key support and a well-defined trading range with material upside potential from current levels. The technical risk/reward asymmetry is clearly to the upside as was the case when looking at the fundamentals.
Eastman Chemical
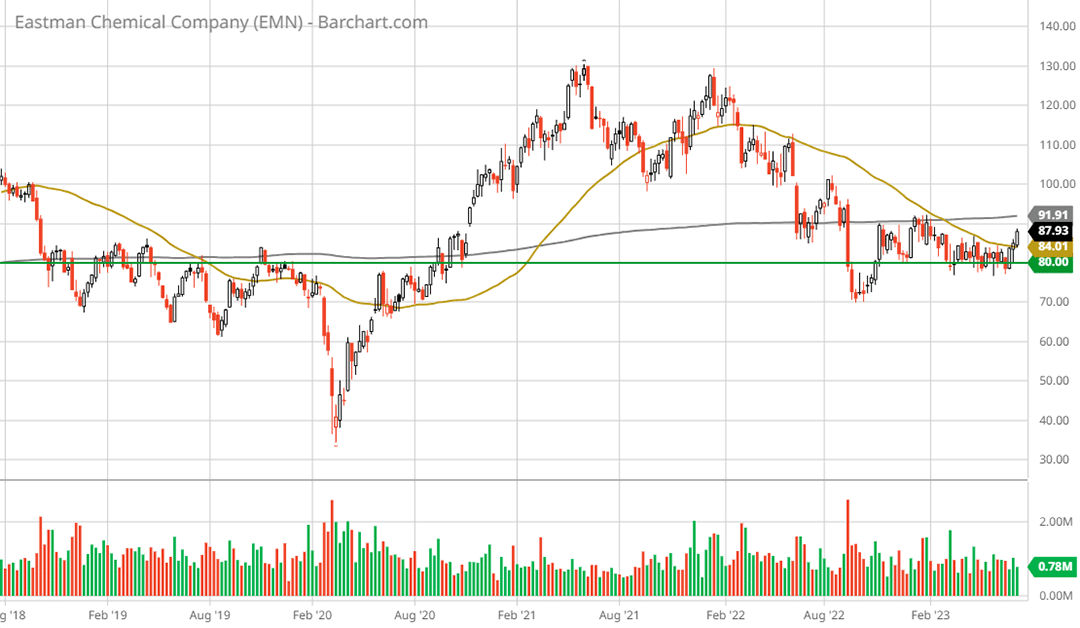
Eastman Chemical 5-year weekly chart. Created by Brian Kapp using a chart from Barchart.com
Rio Tinto
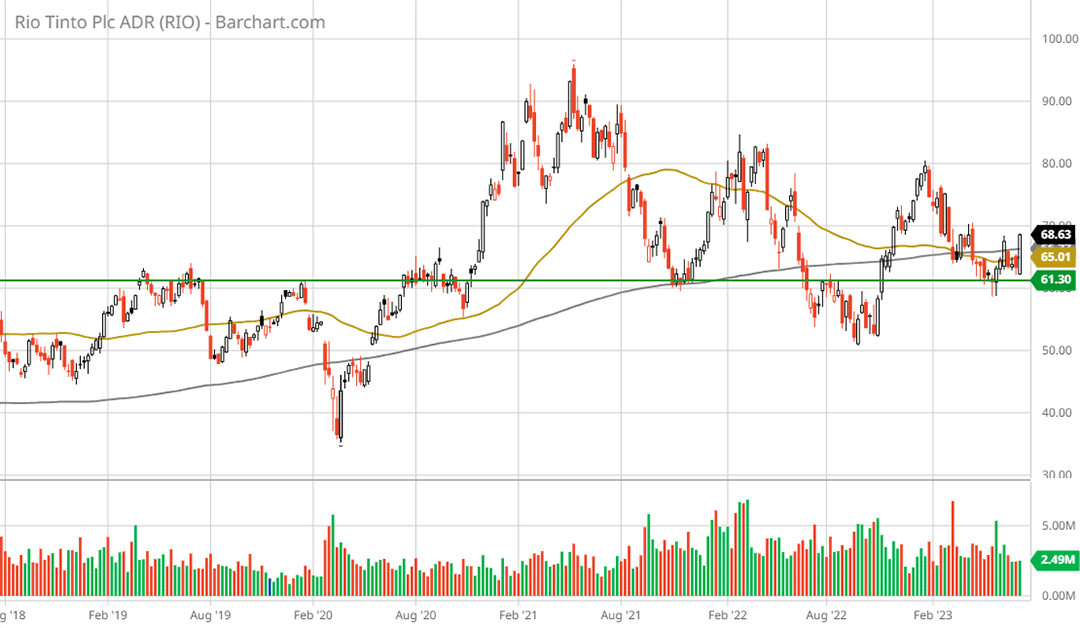
Rio Tinto 5-year weekly chart. Created by Brian Kapp using a chart from Barchart.com
Pfizer
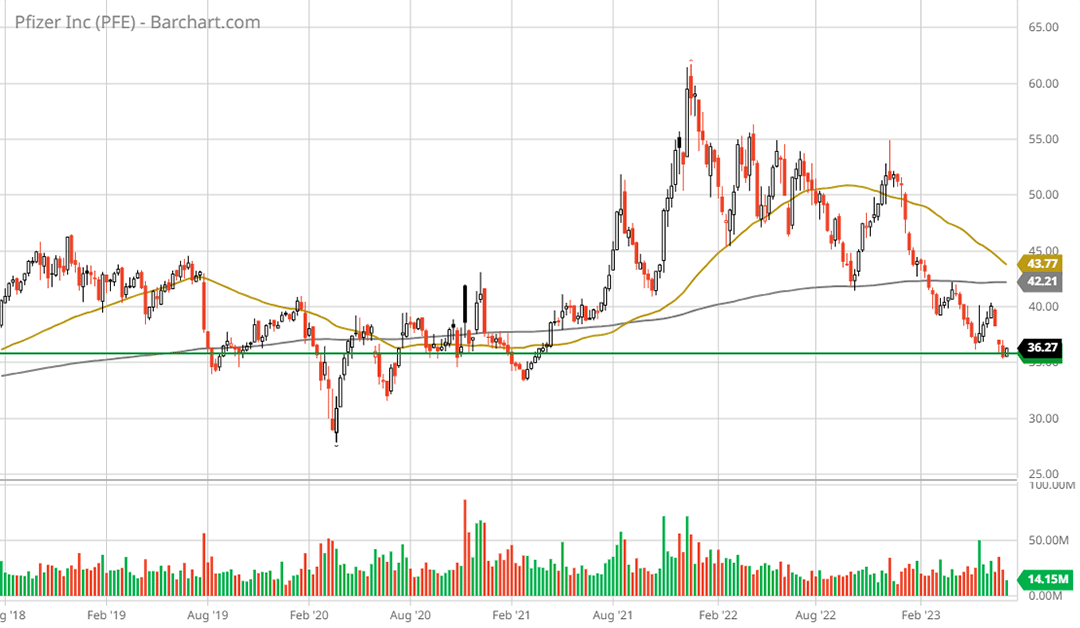
Pfizer 5-year weekly chart. Created by Brian Kapp using a chart from Barchart.com
IBM
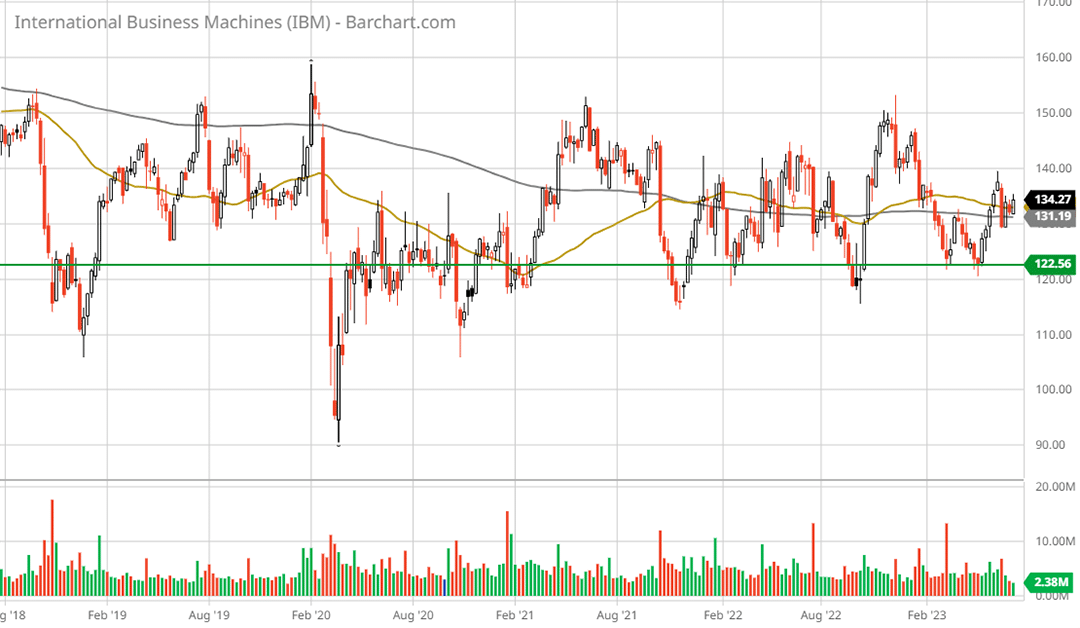
IBM 5-year weekly chart. Created by Brian Kapp using a chart from Barchart.com
International Paper
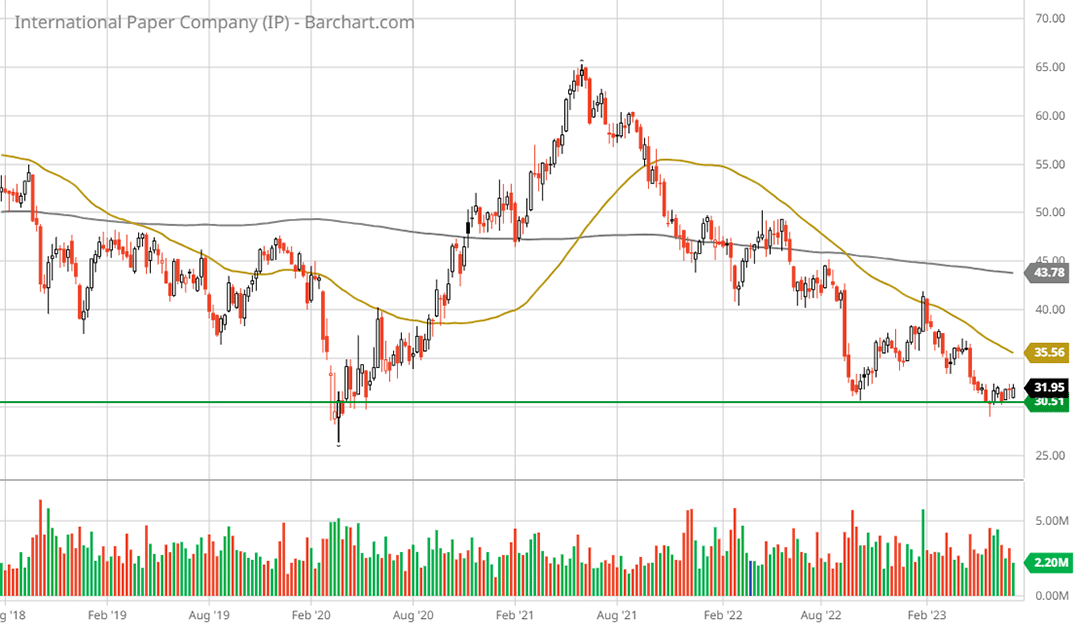
International Paper 5-year weekly chart. Created by Brian Kapp using a chart from Barchart.com
Comcast
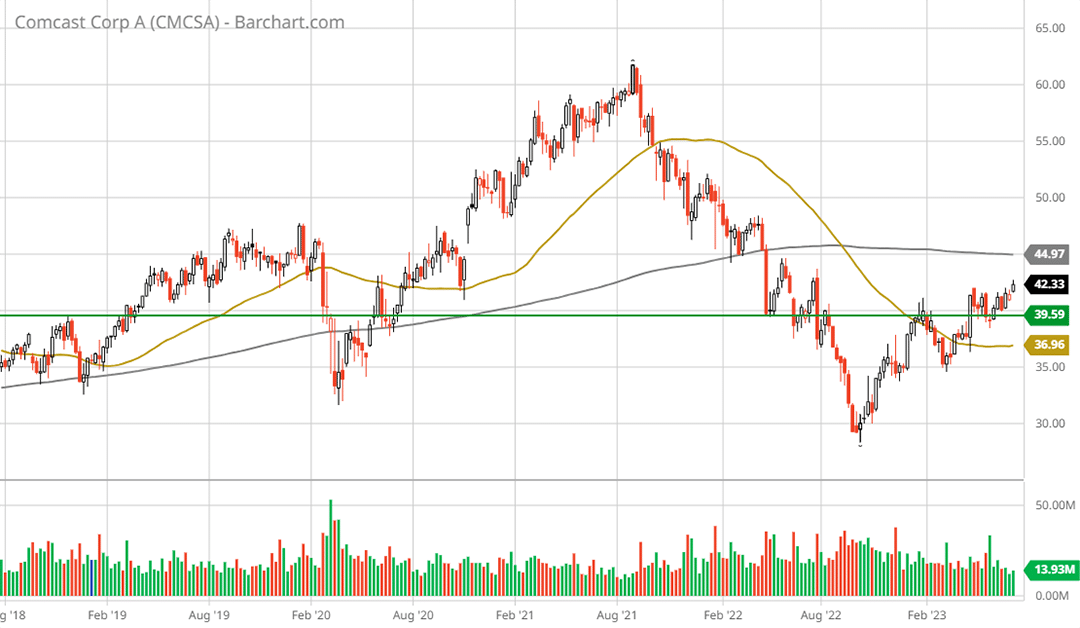
Comcast 5-year weekly chart. Created by Brian Kapp using a chart from Barchart.com
General Motors
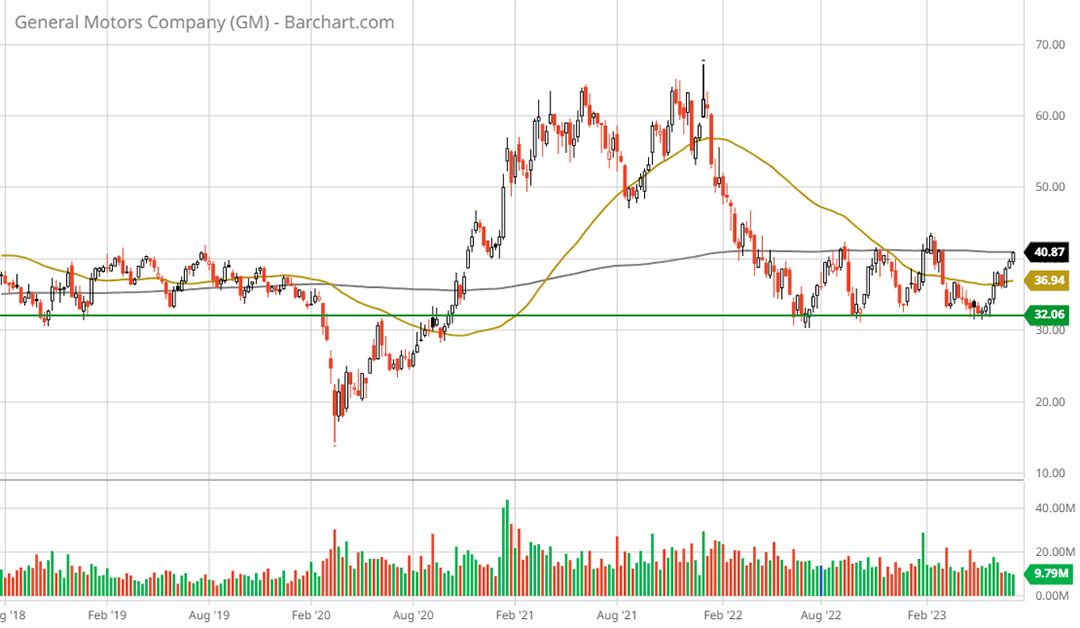
General Motors 5-year weekly chart. Created by Brian Kapp using a chart from Barchart.com
NOV
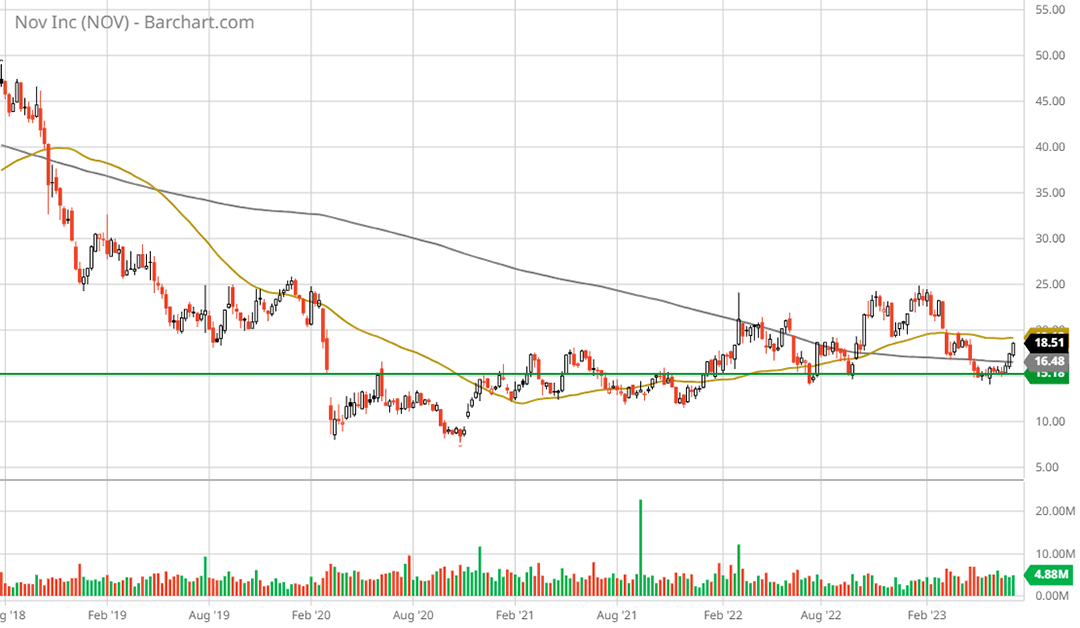
NOV 5-year weekly chart. Created by Brian Kapp using a chart from Barchart.com
American Eagle Outfitters
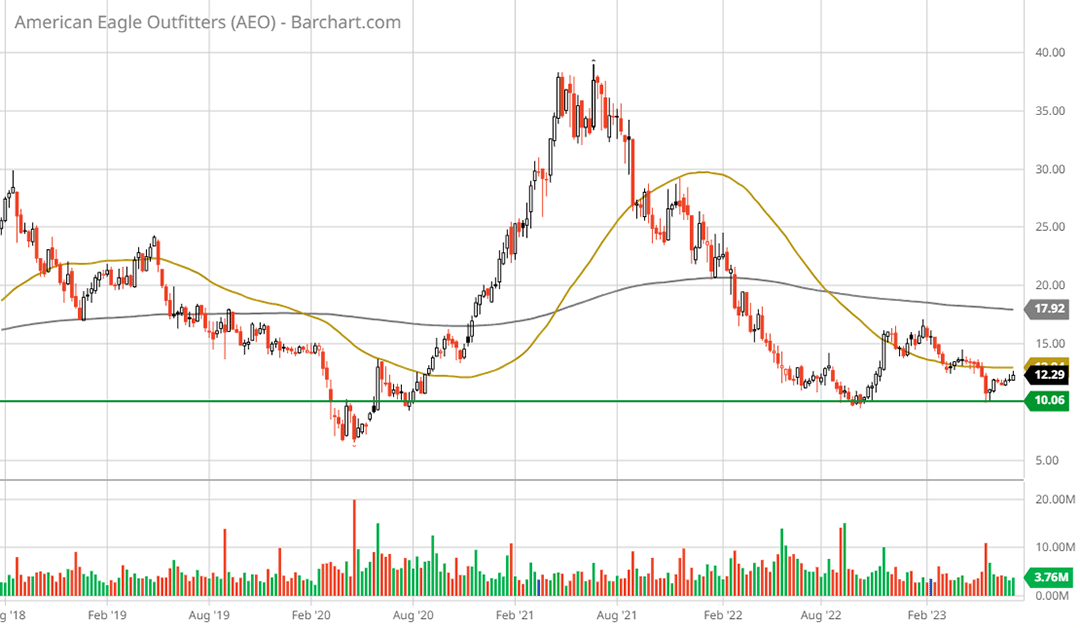
American Eagle Outfitters 5-year weekly chart. Created by Brian Kapp using a chart from Barchart.com
Victoria’s Secret
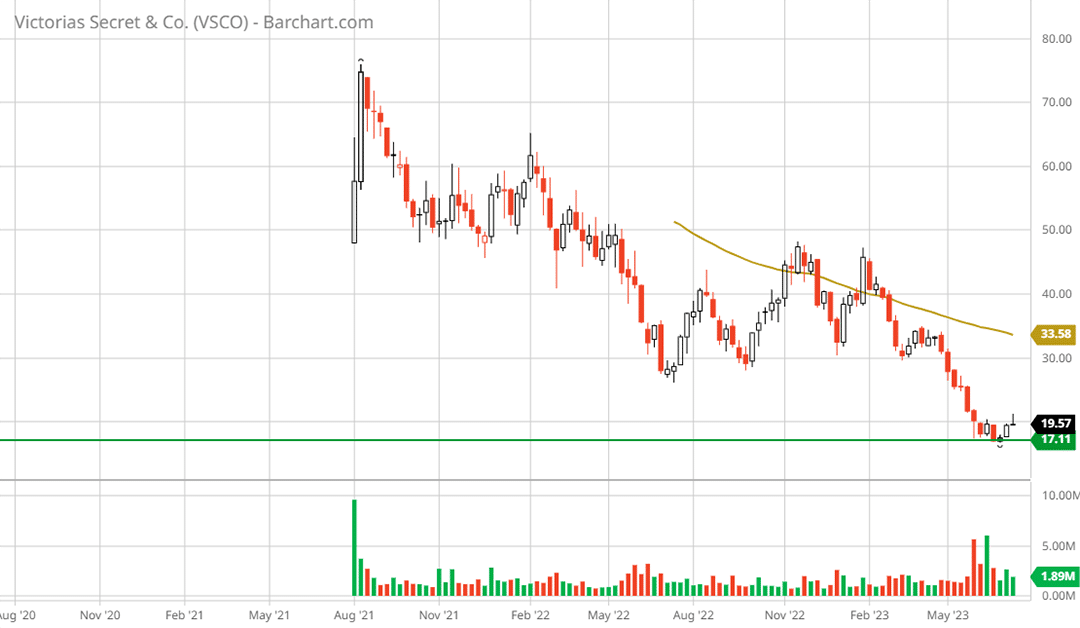
Victoria’s Secret weekly chart. Created by Brian Kapp using a chart from Barchart.com
Summary
Extreme risk/reward asymmetries are in place across the broad US stock market. The market-cap-weighted indices are skewed toward the low to negative end of the risk/reward spectrum. Under the market-cap-weighted surface, the risk/reward asymmetries are quite pronounced and cover a wide potential return spectrum.
The risk/reward asymmetries are especially pronounced when viewing the opportunity set within the construct of “duration risk.” When an economic cycle framework is added to the “duration risk” lens, whether an inflationary contraction or recession, the positive risk/reward asymmetries on display in the basket of ten stocks receives strong support, a bird in the hand indeed.