The stoxdox – Portfolio Tool is designed to empower you by providing a continuous stream of actionable information across our entire research universe. In essence, we condense the primary research and snapdox reports into a near real-time database thereby serving as a portfolio and decision-support tool for our members. This will be an invaluable tool for maximizing your membership value.
Members can instantly search and filter our research universe based on their preferences across a number of key dimensions. You will want to become comfortable with how to sort the data on various dimensions to best fit your objectives at any given moment.
Go to Tools under Reports on the top menu. Click on the stoxdox – Portfolio Tool icon to open the database. The structure of the data is in a basic spreadsheet format without editing capabilities.
You may download the data if you would like to make edits to a copy, for personal use only. Simply highlight the spreadsheet with your mouse, right click and select copy, then paste the data into your personal spreadsheet. Alternatively, under File in the upper left corner, click “Save as” and then select “Download a copy.”
Within the stoxdox – Portfolio Tool, the “sort” function will be your primary data management tool as it enables maximum use cases across all dimensions. The following image is a snapshot of what you will see when the stoxdox – Portfolio Tool opens.
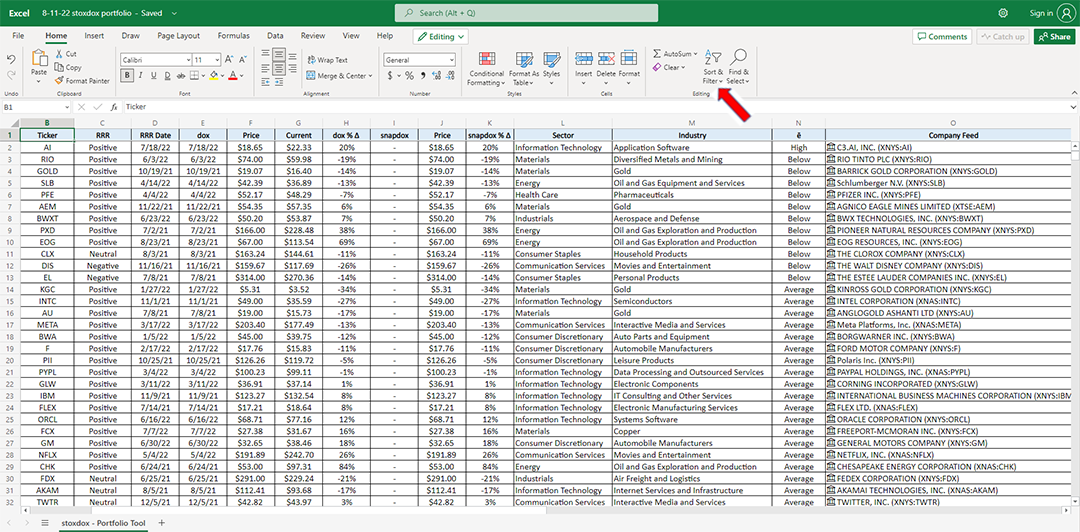
Notice the red arrow pointing to the sort & filter tool. Clicking the tool opens the following dialogue box.
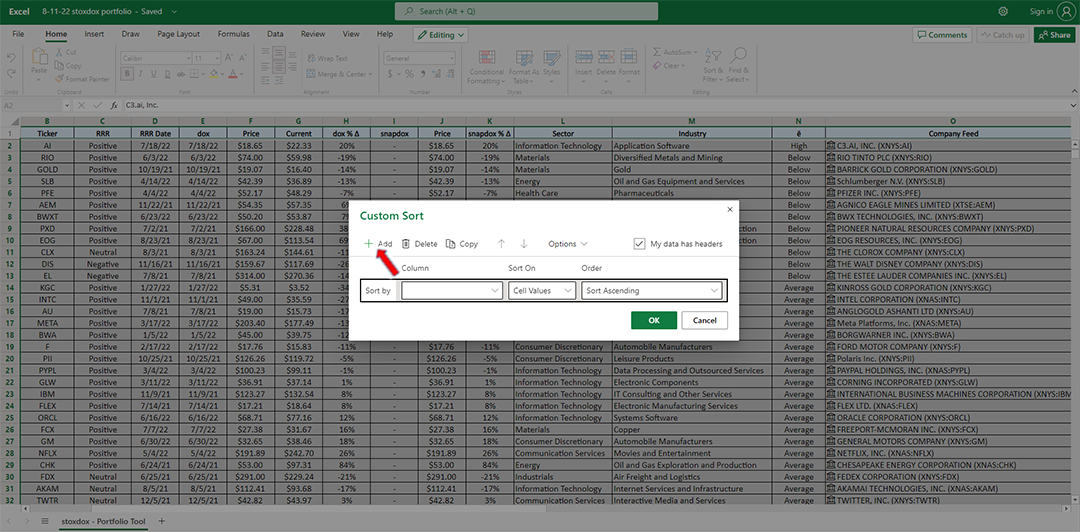
The sort tool defaults to sorting on one dimension or column. Use the drop-down arrows in the search fields to choose the dimension and whether to sort by ascending or descending order. You may sort the database in this way for any number of use cases. For example, sorting the data by dox % ∆ or snapdox % ∆ (∆ = change) will rank the companies by best or worst performers since the last primary research or snapdox report, respectively. Sorting by performance since the last report is a great way to search for opportunities.
Notice the red arrow pointing to the +Add tool. Clicking +Add opens the following dialogue box.
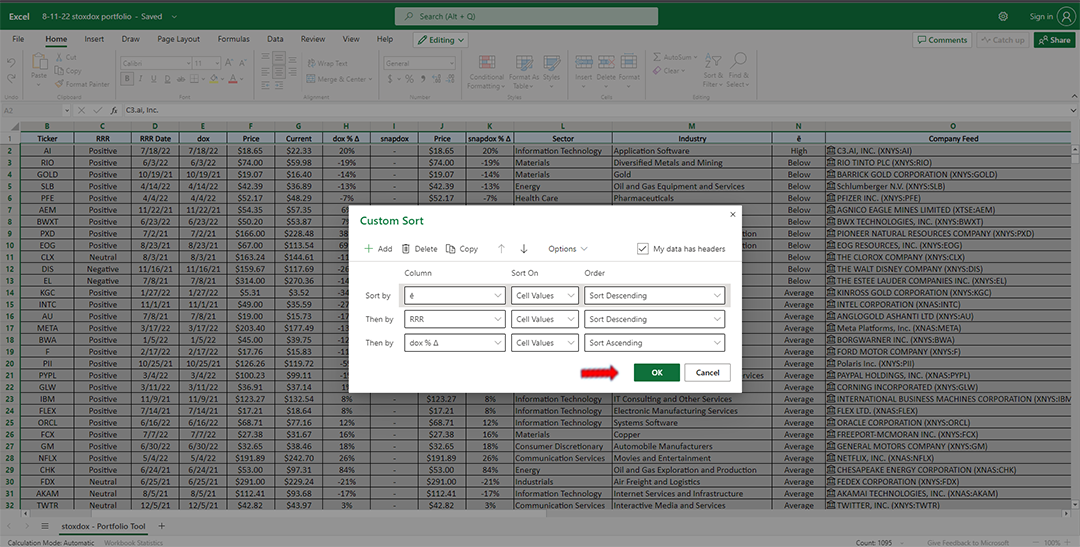
The +Add tool allows you to conduct more refined searches. I have clicked the +Add twice to create a three-dimensional search. In the above example, I first sort by ē, which is our equivalent to a risk rating. I then order the companies by RRR which is our risk/reward rating. Finally, I sort the companies by the percentage change since the last primary research report, dox % ∆.
For example, a more conservative, value-oriented stock investor may look for positively rated stocks with a below-average risk grade down to an average risk grade perhaps. Ranking these companies from worst performer to best is an efficient way for a value-oriented investor to scan for new buy candidates. Conversely, a best to worst performer sort is an efficient way for a value-oriented investor to scan for new sell candidates. I use sell and short interchangeably here.
In the three-dimensional search example above, a momentum-oriented investor may view performance since the last report from a different perspective than a value-oriented investor. The momentum investor may view the best performers as potential buy candidates and the poor performers as potential sell candidates.
Note that “Delete” in the sort tool allows you to remove search dimensions. Please be sure to read the column descriptions below to make full use of the sort capabilities.
The data can be searched and organized across any number of the dimensions, enabling maximum use cases across the investor universe. The use cases are too vast to list here. When considering the sort parameters, think about your objectives and weigh the priority of each search variable given your objectives at any given moment. Under Idea Factory below, we provide a sampling of common sort variables and the objective of each to get the ball rolling.
Use Cases
We provide three primary report examples and describe various use cases on Our Services page. These examples are related back to the stoxdox – Portfolio Tool and describe ways to search the data for each use case. The title of each article begins with “Use Cases” for ease of identification
Please let us know if you have any questions about the stoxdox – Portfolio Tool.
You have the power.
Column Descriptions
Company: Company name.
Ticker: Company ticker symbol.
RRR: stoxdox Risk/Reward Rating.
RRR Date: The date of most recent Risk/Reward Rating update. The rating could be the result of a full research report or a summary report (dox or snapdox). It is the most recent of the two.
dox: The date of the most recent dox or primary research report.
d-Price: The price at the time of the most recent dox or primary research report.
Price: The current or recent stock price (pricing data is delayed).
dox % ∆: The % change since the most recent dox or full research report.
snapdox: The date of the most recent snapdox or summary research report.
s-Price: The price at the time of the most recent snapdox or summary research report.
snapdox % ∆: The % change since the most recent snapdox or summary research report.
Sector: The sector in which the company operates, as categorized.
Industry: The industry in which the company operates. This is a subsector categorization.
ē: This is our equivalent of a risk rating. It is subjectively determined by the author of the Risk/Reward Rating. The rating is a relative risk concept as each company has different characteristics and each sector and industry has its own peculiarities.
Ʃ+: This is our income rating. It is objectively determined by the current dividend or income of the investment opportunity. It includes a subjective assessment of future income potential which is determined by the author of the Risk/Reward Rating.
Company Feed: This is a Microsoft Excel data format for each company. It is a connection to near real-time pricing for each stock. Clicking on the icon to the left of each company in the cells provides summary pricing information and the data source.
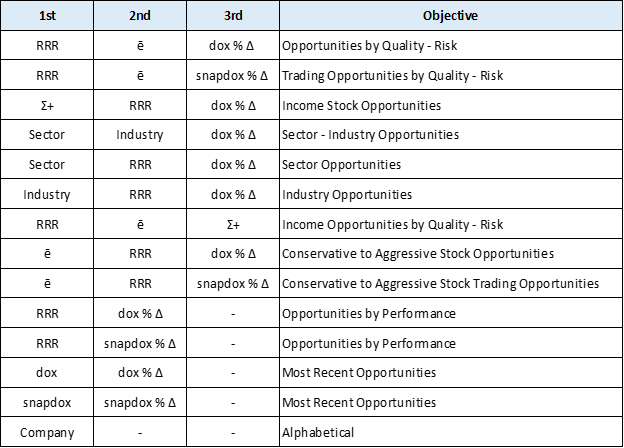
Idea Factory
The list below contains common sort levels and the general objective in conducting the search. Please keep in mind that each dimension or column can be sorted in an ascending or descending order. This is an important dimensional vector choice depending on your objectives at any given moment.