
With gold on the cusp of breaking out to all-time highs, it is a good time to look for opportunities to maximize value under what I believe is the most likely scenario: the gold bull market resumes above $2,000 per ounce.
Gold Technicals
The following 20-year monthly chart displays the bullish long-term technical backdrop, or price behavior. Gold features a massive 12-year consolidation of the 2000s bull market, characterized by a near perfect cup and handle pattern, in technical parlance.
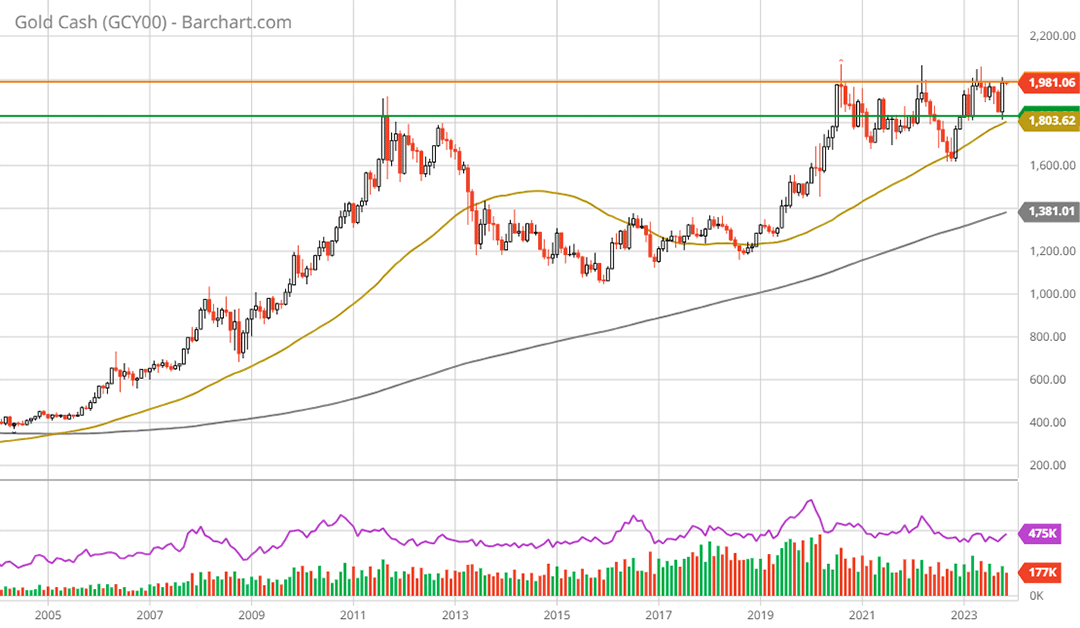
Gold 20-year monthly chart. Created by Brian Kapp using a chart from Barchart.com
The following 5-year weekly chart captures the current gold bull market, which features a 3-year consolidation of the first leg higher.
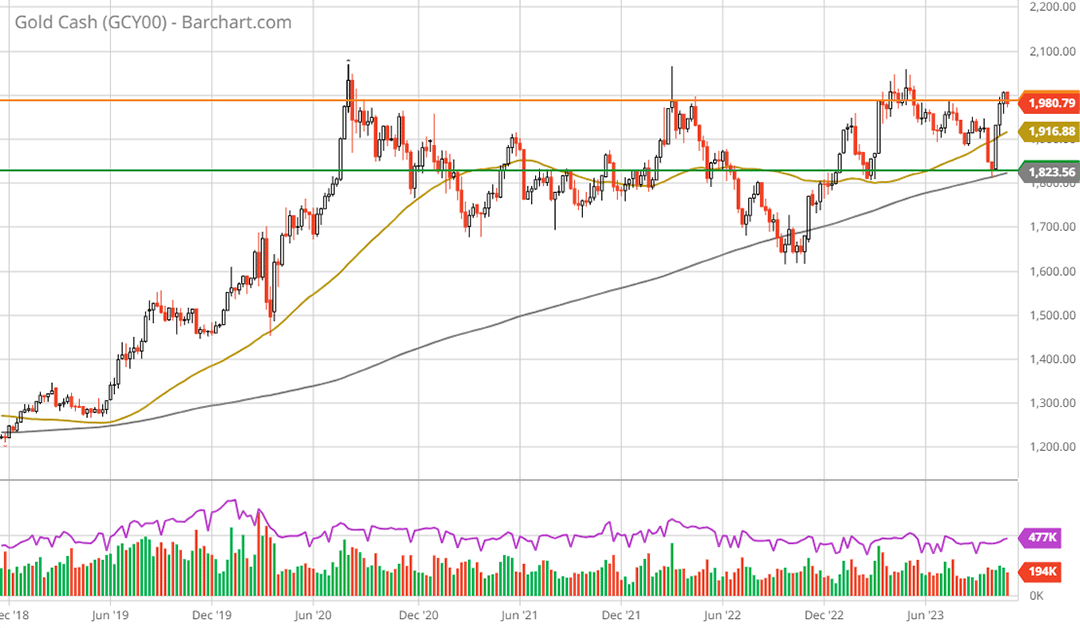
Gold 5-year weekly chart. Created by Brian Kapp using a chart from Barchart.com
In the following 2-year daily chart, notice that gold is attempting a breakout from a well-structured 2-year consolidation. The breakout attempt is at all-time highs.
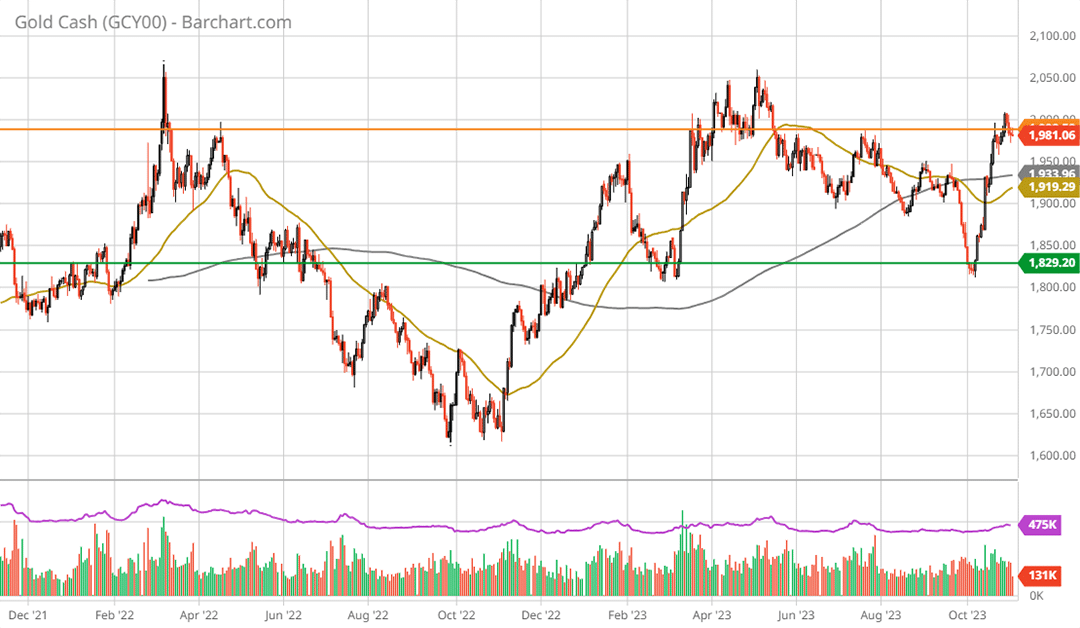
Gold 2-year daily chart. Created by Brian Kapp using a chart from Barchart.com
Eyeing A Gold Breakout
The general thesis outlined in “Kinross Gold is an asymmetric opportunity” is that large resource discoveries create upside asymmetry during commodity bull markets. As discoveries unfold, recurring resource growth news flow serves as a powerful share price catalyst.
In the report, I compared the performance of Southwestern Energy to that of Exxon Mobil during the oil and gas bull market of the 2000s, which coincided with the last gold bull market. The performance differentials in the energy bull market were extraordinary. Exxon Mobil’s stock price appreciated 132% over the period, while Southwestern Energy’s share price exploded by 1,833%.
The key difference was that Southwestern Energy made large resource discoveries during the commodity bull market and featured industry-leading resource growth. It is straightforward and intuitive as all commodity producers benefit equally from an upward price trend. There is little relative valuation effect resulting from a bull market in commodity prices.
As the Southwestern Energy case demonstrates, if a commodity producer discovers an exceptionally large, long-life resource with excellent economics, the commodity price bull market will be greatly amplified by resource growth and a premium valuation.
Given the lack of production growth across the gold mining industry, resource growth is likely to be a key factor for maximizing the upside opportunity if an upside gold breakout is at hand.
Kinross Gold
In regard to resource growth, Kinross Gold’s Great Bear asset represents one of the largest and highest quality growth opportunities in the gold mining industry. The Great Bear property is ideally located near the Red Lake district in Ontario, Canada. It offers excellent economic prospects with highway access, power lines, natural gas pipelines, and access to labor.
The following section provides an overview of the Great Bear resource opportunity and is from “Kinross Gold is an asymmetric opportunity.” Please note that Kinross lost a material mine in Russia following the invasion of Ukraine. Today, Kinross offers a stable production outlook in the low 2 million ounces per year range.
Kinross also provides an excellent three minute summary video of the Great Bear property and a great 3D overview of the resource (which is more technically oriented).
Kinross Gold is an asymmetric opportunity – January 27, 2022
Kinross announced the acquisition of Great Bear Resources for $1.4 billion on December 8, 2021. Great Bear Resources has discovered what could become the largest Canadian gold mine opportunity since the Hemlo and Red Lake mining districts. The Hemlo and Red Lake mining districts have produced over 22 million ounces and 25 million ounces of gold, respectively, and are two of the largest historical gold producers globally. This large-scale resource potential creates extraordinary upside leverage for Kinross shares in a gold bull market.
Great Bear Resources
The Great Bear discovery is best illustrated by using slides from the Great Bear December 2021 Investor Presentation and the Kinross Gold January 2022 Investor Presentation. Comparisons to similar mineral deposits at large existing Canadian gold mines places the opportunity in context in the slides that follow. In the case of Great Bear, the opportunity is threefold.
First, the LP Fault Zone discovery creates the potential for a large, high-grade open pit mine followed by high-grade underground mines. The best comparable mines for the LP Fault Zone opportunity include Canadian Malartic owned by Yamana Gold and Agnico Eagle Mines, Detour Lake owned by Kirkland Lake (which has merged with Agnico Eagle Mines), and the Hemlo mine owned by Barrick Gold.
Second, there are now four high-grade satellite deposit discoveries: Dixie Limb, Hinge Zone, Midwest, and Arrow. The best comparable geology to these high-grade satellite deposits is the Red Lake mine just north of the Great Bear property which is now owned by Evolution Mining.
The third opportunity lies within the large land package that remains largely unexplored. It hints at the potential for the above two types of mineral deposits to be discovered along the same geologic trends within the property boundary.
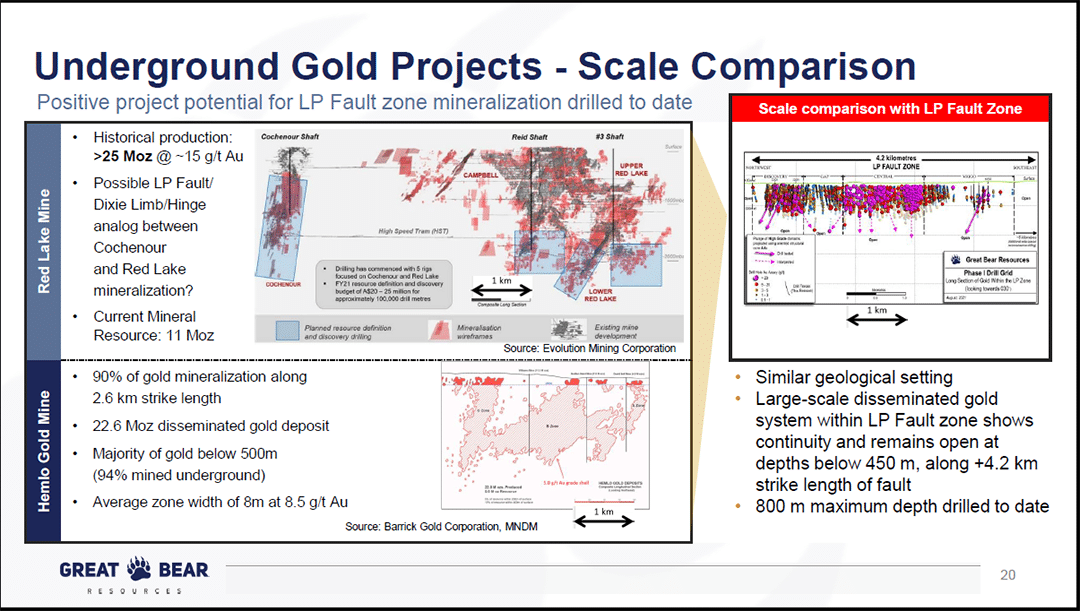
Turning to the first opportunity, the following two slides compare the size of the LP Fault Zone discovery and drill results to comparably sized existing mines. Please note that the Great Bear discovery is generally referred to as the Dixie project and the LP Fault Zone drill results data is on the right-hand side of the slides.
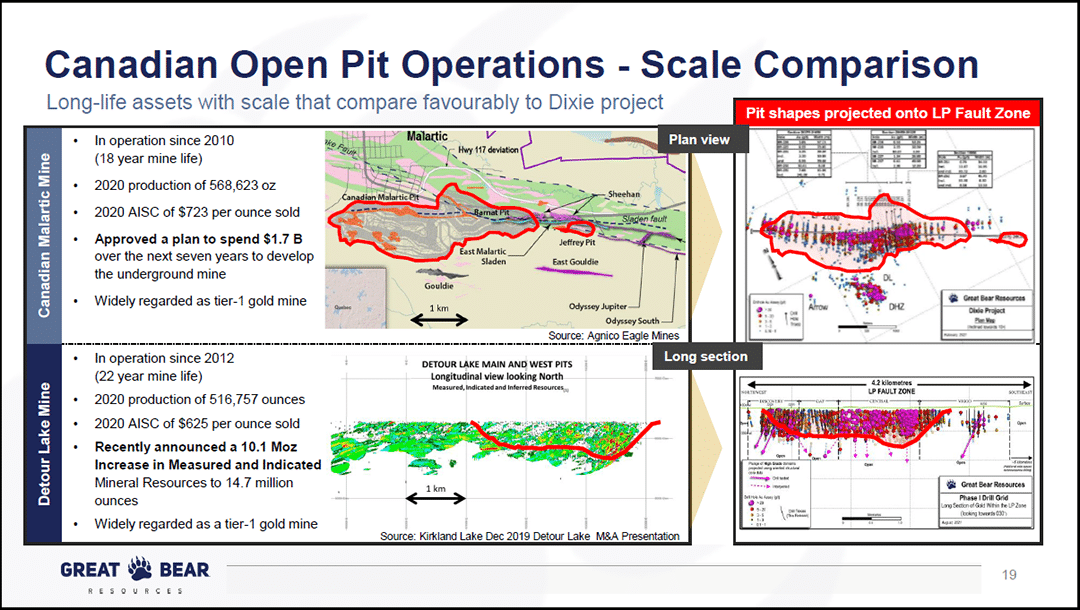
Source: Great Bear December 2021 Investor Presentation
Source: Great Bear December 2021 Investor Presentation
The next slide highlights the second opportunity which is the various high-grade satellite deposits. These deposits are higher-grade in condensed formations and are thus more similar to the geology of the Red Lake Mine in the above comparable mines slide. They are to the southwest of the LP Fault Zone and in the lower left of this aerial view slide.
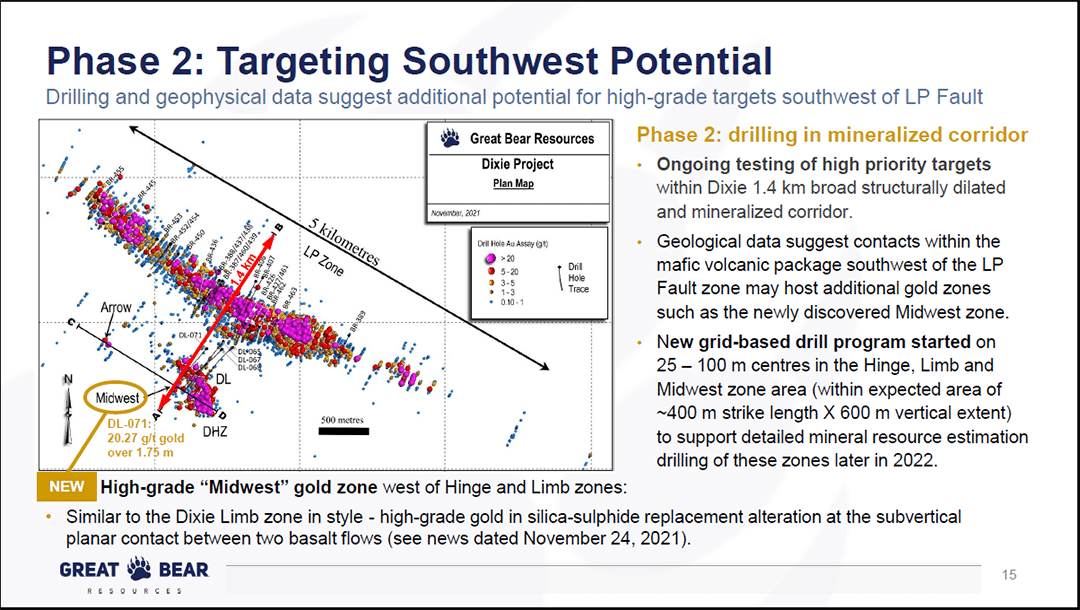
Source: Great Bear December 2021 Investor Presentation
You will notice the reference to Phase 2 on the above slide. Great Bear wrapped up its Phase 1 drilling plan in 2021. It is moving to more detailed testing at depth in the LP Fault Zone and more extensive drilling near the Red Lake style deposits to the southwest.
This is important as these drill results will be unfolding in the coming years, which creates the potential for positive news flow on the resource growth front going forward. Recall the Exxon Mobile and Southwestern Energy example mentioned earlier.
It is important to note that much of the overall resource potential often occurs at depths below 500 meters which is not yet extensively drilled by Great Bear. In the case of Hemlo, 90% of the 22 million ounces of gold were mined beneath 500 meters. The following two slides highlight the Hemlo mine and the large resource discovery opportunity at greater depths.
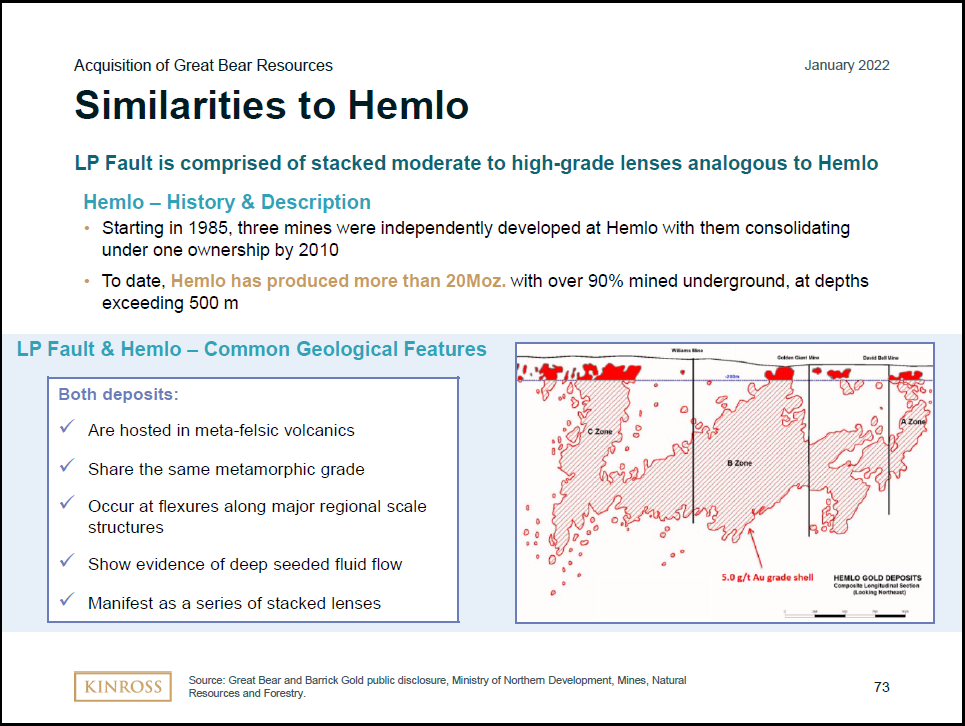
Source: Kinross Gold January 2022 Investor Presentation
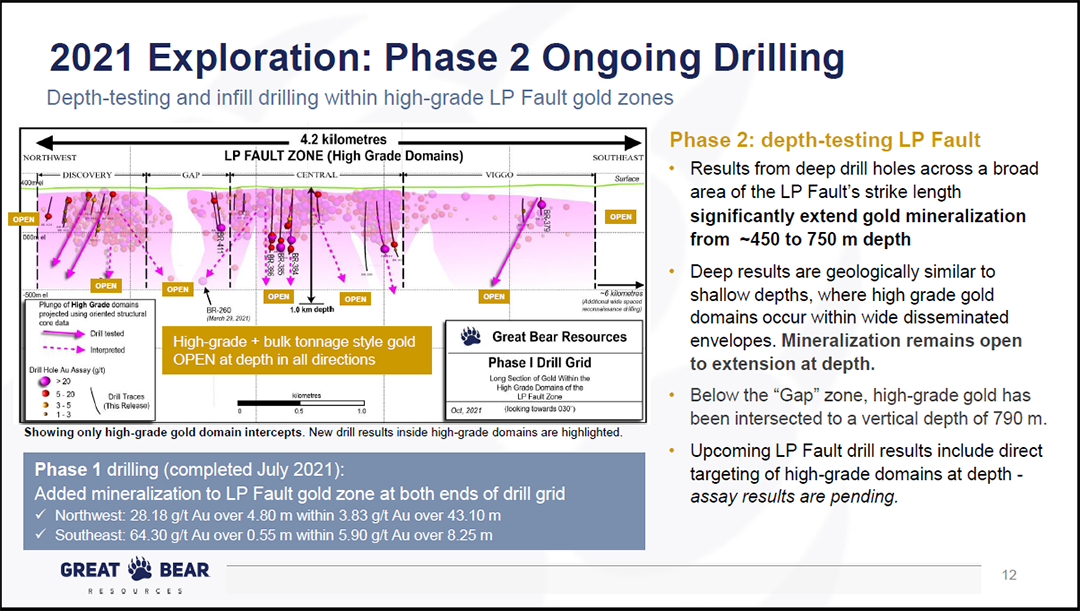
Source: Great Bear December 2021 Investor Presentation
It is important to note that Kinross has been in contact with Great Bear since 2018 to monitor and study the progress of the exploration program. This provides further confidence that Kinross understands the risks and resource potential.
The following table summarizes the production details of the comparable mines in the above slides. Please note that the potential to reach the size of the comparable mines remains an open question. Actual results could be materially different, whether to the upside or downside. As things stand, all signs point toward more similarities than differences.
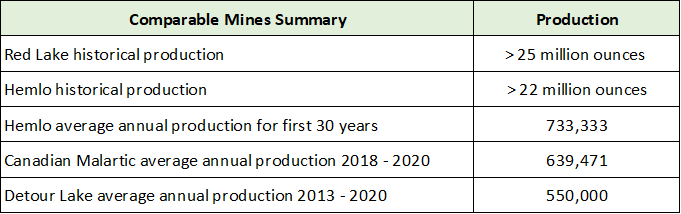
Source: Created by Brian Kapp, stoxdox
Update
Since the above report, Kinross has filed an initial resource estimate of 5 million ounces, all contained above 500m. The company is scheduled to provide a resource update with its Q4 results and stated the following in its September 2023 investor presentation:
Drilling year-to-date has demonstrated potential for a meaningful increase in the underground resource. Kinross expects to declare a resource update as part of its 2023 year-end results.
Relative Valuation
Not only does Kinross offer one of the largest resource growth opportunities in the gold mining industry, but it also trades at a material valuation discount to the group. Using consensus earnings estimates for 2024, the following table displays the valuation of Kinross and its top four gold mining peers.
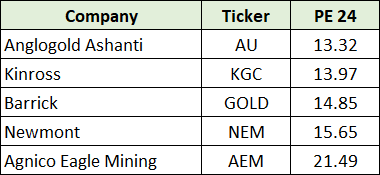
Source: Created by Brian Kapp, stoxdox
Kinross Technicals
The following 20-year monthly chart displays the bullish long-term technical backdrop, or price behavior. Kinross is trading at what should be incredibly strong support (the green line) which stretches back twenty years. The orange lines represent key resistance levels or price targets.
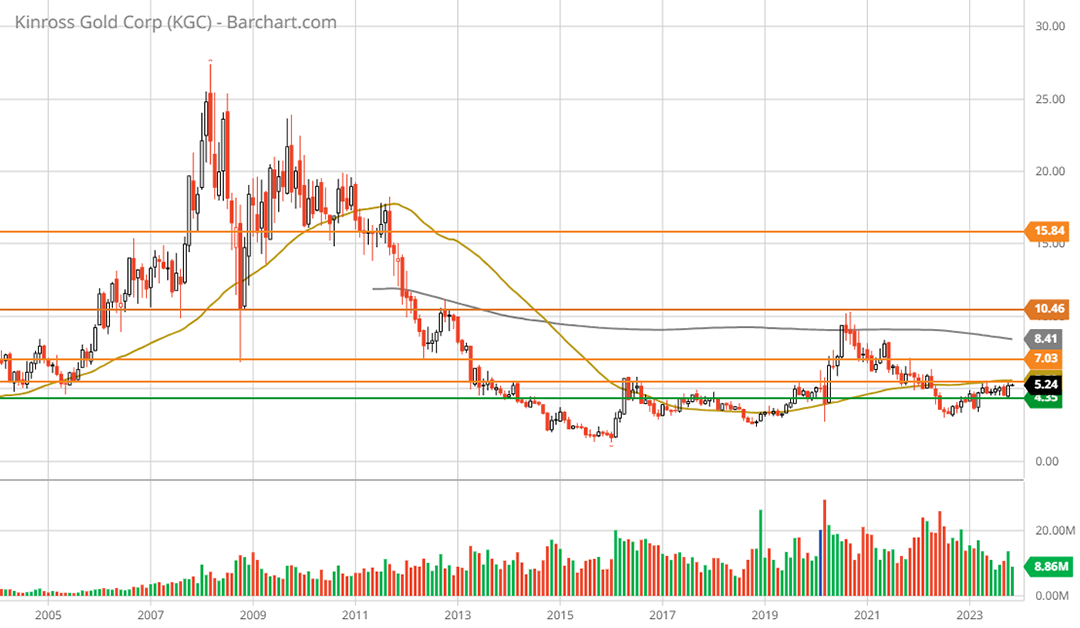
Kinross Gold 20-year monthly chart. Created by Brian Kapp using a chart from Barchart.com
If the current gold bull market resumes above $2,000 per ounce, each of the above technical targets are achievable. The return potential to each of the technical targets is displayed below:
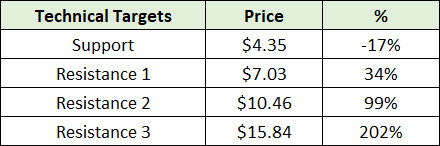
Source: Created by Brian Kapp, stoxdox
Summary
With gold on the cusp of breaking out to all-time highs, and large resource discoveries leading to upside asymmetry in commodity bull markets, Kinross Gold is well positioned for maximizing value in a gold bull market.
Kinross’s Great Bear resource represents one of the largest and highest quality growth opportunities in the gold mining industry. As discoveries unfold at Great Bear, recurring resource growth news flow could serve as a powerful share price catalyst.
Though not guaranteed, the Great Bear asset has all the signs of being a significant, long-lived, top-tier gold resource. The ideal location near the Red Lake district in Ontario offers a friendly jurisdiction and excellent economic prospects with highway access, power lines, natural gas pipelines, and access to labor.
Given the lack of production growth across the gold mining industry, resource growth is highly likely to be the key variable for maximizing upside asymmetry if a gold breakout is indeed at hand, as I believe it is. Kinross Gold is eyeing the gold breakout.