
As discussed in “The retail industry offers timely diversification,” the broad retail industry is a top sector choice for the coming cycle. What many find unusual about this positive view of the retail industry (NYSE:XRT) is that talk of a recession is daily news. Why would anyone invest in retail stocks if we are in a recession or on the doorstep of one?
There are several reasons for the positive view of the industry, and American Eagle Outfitters (NYSE:AEO) in particular. I will begin with the technical backdrop which is largely a reflection of the economic cycle. The dynamic underlying this technical/economic interconnection was discussed in “The market is on a long and winding road.“ From the report:
I include it here as a reminder of the old saying: “it is a market of stocks, not a stock market.”…The saying is worth remembering as sectors, industries, and individual stocks react to different economic factors at different times of the cycle.
Technicals
An interesting feature of many retail stocks, and especially the apparel category, is that they tend to bottom out in advance of, or coincident with recessions. The reasoning is sound as the market is a forward-looking pricing mechanism and apparel retail is highly attuned to the state of the consumer. The following 2-year daily chart of American Eagle depicts this dynamic at play in the current cycle.
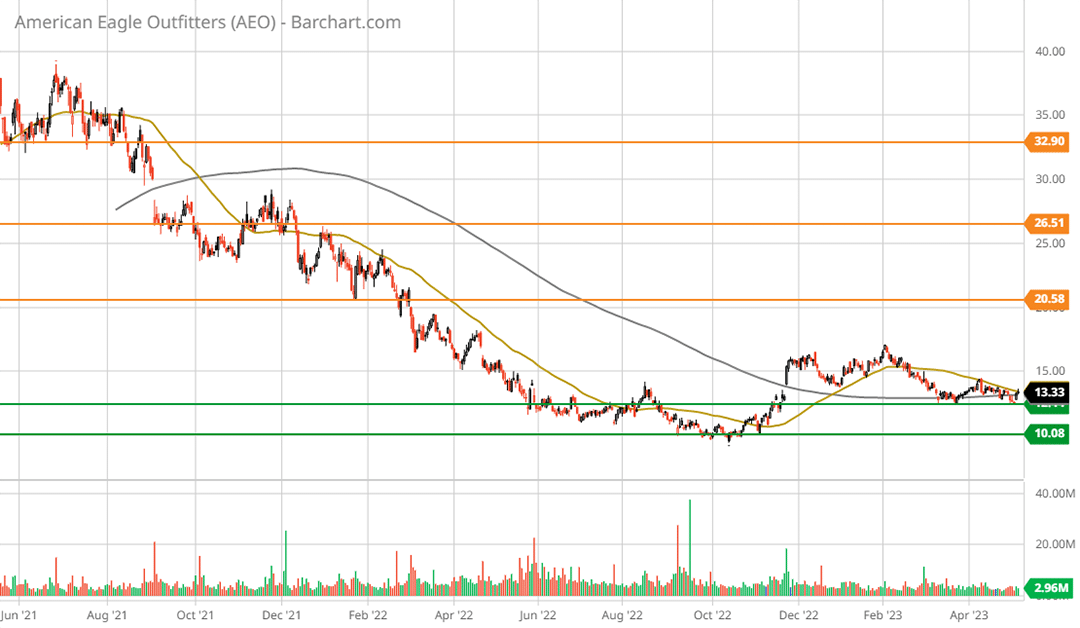
American Eagle Outfitters 2-year daily chart. Created by Brian Kapp using a chart from Barchart.com
American Eagle bottomed on September 8, 2022, with a successful retest of the low during October 2022. What is interesting regarding the September 2022 bottom is that it occurred within a week of the report, “The recession is here, filter the noise.” While a recession has yet to be officially declared, American Eagle’s price behavior is in alignment with the September 15, 2022 recession report.
Note that on all of the charts the green lines encase the primary support zone and that the orange lines are the primary resistance levels. Furthermore, the gold line represents the 50-period moving average while the grey line depicts the 200-period moving average.
In the above chart, the 50-day moving average crossed above the 200-day moving average on December 23, 2022. This golden cross is sending a confirmation signal of a potential trend change.
In addition to the golden cross, notice that the rally off the September to October bottoming process surpassed the prior rally high of August 16, 2022. Technically speaking, this price action resembles a rather powerful cup and handle pattern. The pattern encapsulates the price action from August 2022 through today.
The price behavior suggests an accumulation of the shares is in progress, thus having bullish connotations. The following 5-year weekly chart provides a broader view of recent cycle dynamics.

American Eagle Outfitters 5-year weekly chart. Created by Brian Kapp using a chart from Barchart.com
Recessions
There have been three official recessions since American Eagle became a publicly traded company. Given the unusual nature of the pandemic recession, I will focus on the prior two. The recession start and end dates and the bottom in American Eagle’s share price during each are as follows:
- Recession start: April 2001
- American Eagle price bottom: July 2000
- Recession end date: December 2001
The 2008 recession:
- Recession start: January 2008
- American Eagle price bottom: January 2009
- Recession end: July 2009
What we can say from the above is that American Eagle’s share price has led or been coincident with recessions. The following monthly chart provides a bird’s eye view.

American Eagle Outfitters monthly chart. Created by Brian Kapp using a chart from Barchart.com
In summary, American Eagle’s share price is in the ideal window of accumulation given the recessionary backdrop. Using the technical support (green lines) and resistance levels (orange lines) as possible price targets, the return potential to each is as follows:
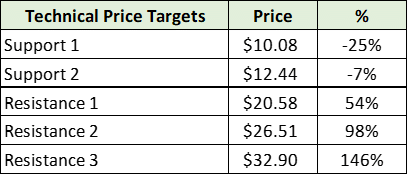
Created by Brian Kapp, stoxdox
I view each of the targets as being reasonable over the intermediate term. Given the stage of the economic cycle, the window for the upside price targets is likely in the one-to-three year range. Technically speaking, the risk/reward asymmetry is decidedly skewed to the upside, with a potential return spectrum of -25% to +146%.
Fundamentals
Turning to the fundamentals, the following table displays consensus estimates for earnings (upper section) and sales (lower section) for the coming three years. In the far right-hand column, I display reasonable price targets using a 15x PE ratio and a 0.84x price-to-sales ratio (P/S) on consensus estimates.
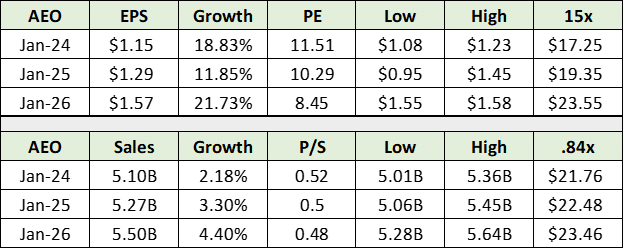
Source: Seeking Alpha. Created by Brian Kapp, stoxdox
If American Eagle is within the ballpark of consensus estimates through 2026, the upside potential to resistance level 2 from the prior table is well supported and equates to 98% upside potential.
Importantly, American Eagle’s earnings peaked at $2.03 per share in the year ended January 2022. As a result, there is evidence of upside surprise potential to the $1.57 per share earnings estimate for 2026. Additionally, American Eagle is trading at a rather large discount to its consumer discretionary sector peers, as can be seen in the following table.
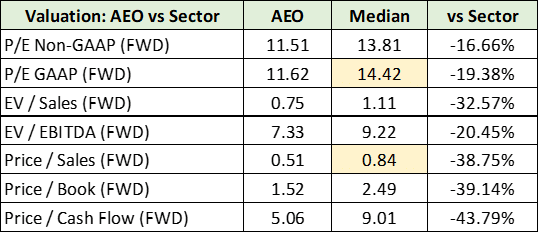
Source: Seeking Alpha. Created by Brian Kapp, stoxdox
I have highlighted in yellow the PE and price-to-sales data for the sector, which support the use of 15x earnings and .84x sales in the consensus estimates table above. Based on consensus estimates and median sector valuations, the risk/reward asymmetry is skewed to the upside with a potential return spectrum of -25% to +98%.
If consensus estimates are too conservative for the 2026 time frame, the high technical upside target of $32.90, or 146%, is within the realm of possibilities. This higher price level equates to roughly 15x American Eagle’s peak historical earnings of $2.03 per share.
Cigar Butt?
A casual glance at the long-term monthly chart in the technical section above hints at the possibility that American Eagle is what Warren Buffett and Charlie Munger refer to as a “cigar butt.” In essence, cigar butts are mediocre businesses which face stagnant to declining economics. Others refer to such companies as value traps.
In other words, such stocks are cheap for a reason and risk remaining at discounted valuations well into the future, thus delivering poor returns. The historical evidence suggests American Eagle has generally been a cigar butt since the shares peaked in January of 2007.
This remains a very real risk going forward, as the retail apparel industry is intensely competitive. As things stand, given the cigar butt risk, American Eagle is best thought of as a short to intermediate-term investment vehicle rather than a long-term buy and hold investment.
Cigar butt or not, as discussed in “Magellan and navigating uncharted markets,” some of the world’s greatest investors have utilized portfolio management strategies which incorporated high portfolio turnover. Peter Lynch of the famed Fidelity Magellan Fund was one such person. The American Eagle opportunity is well suited for such an approach. From the Magellan report:
The primary lesson I draw from Lynch’s tenure at Magellan is that investment strategies are cycle dependent, excluding true growth companies that fall into the potential 10-bagger category… What may surprise many is that Lynch’s strategy at Magellan featured the opposite, extraordinary portfolio turnover… In the process, he produced returns that place him amongst the greatest investors of all time.
Segments
American Eagle’s reporting segments illuminate the cigar butt question. As things stand today, there is in fact a cigar butt segment: the American Eagle flagship store. It is mature with stagnant and volatile economics.
That said, the American Eagle segment remains the cash flow driver of the company. In the following slide from the company’s Q4 2022 earnings presentation, notice that the flagship American Eagle segment reported 2022 sales that were roughly flat with 2019 (the left-hand side).
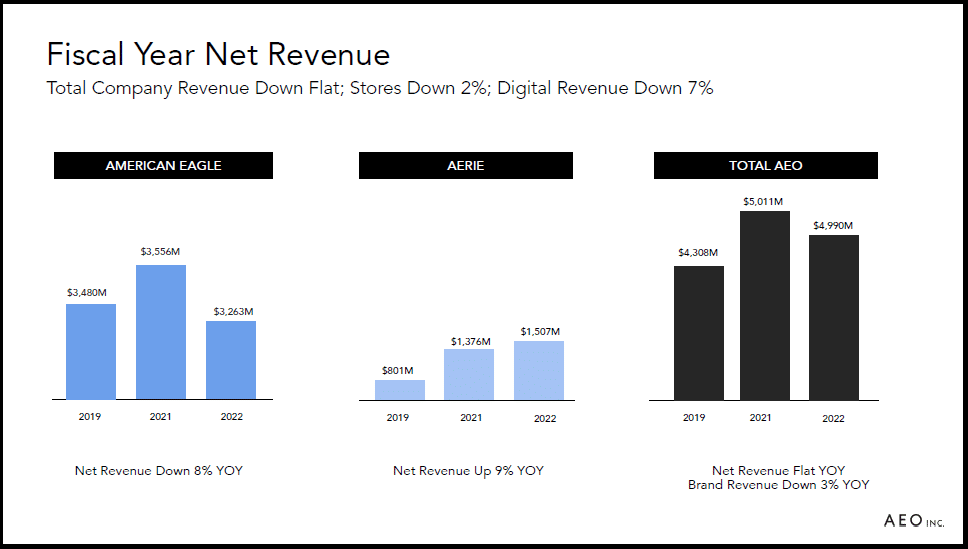
American Eagle Outfitters Fourth Quarter and Fiscal Year 2022 Investor Presentation
Though the flagship segment is mature, the Aerie segment is most certainly not (the middle bars). It is clearly not a cigar butt as evidenced by its 88% sales growth over the past three years. The Aerie segment is the growth driver of American Eagle and offers material long-term growth potential.
Aerie participates in the strongest apparel categories and competes with the likes of the industry leader, Lululemon (NASDAQ:LULU). Looking forward, American Eagle is targeting $2 billion of sales for the Aerie segment over the intermediate term. This equates to 33% sales growth compared to the year that just ended in January 2023.
If achieved, Aerie alone should be sufficient in enabling American Eagle to surpass consensus sales growth estimates. Annual sales growth estimates through January 2026 are conservative, in the low single-digit-percentage growth range. The consensus expectation of 2% and 4% sales growth annually provides a low hurdle for American Eagle.
In addition to Aerie, American Eagle has two retail concepts which are in their infancy and thus not meaningful for reporting purposes. The first is Todd Snyder New York, which is a premium menswear brand with only ten stores. The second is Unsubscribed, which offers one-of-a-kind vintage clothing selections tailored to local markets. Unsubscribed is an interesting concept and has only five stores today.
Turning to profitability, the following slide from the Q4 2022 earnings presentation displays the operating income for each segment. Notice that the operating margin for the flagship American Eagle brand (16.6%) dwarfs that of Aerie (11.1%).
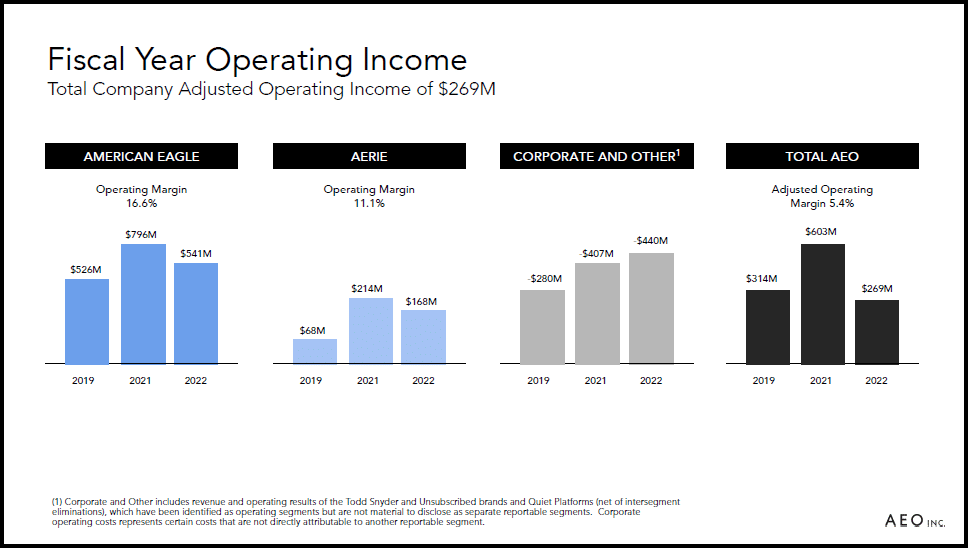
American Eagle Fourth Quarter and Fiscal Year 2022 Investor Presentation
Improving operating margins in the Aerie segment, such as those achieved in the flagship segment, could add significant earnings growth potential to American Eagle. For reference, the company has approximately 197 million shares outstanding, and a history of share repurchases. One can easily envision American Eagle reaching and perhaps surpassing its high earnings year of just over $2 per share.
The question: is American Eagle preparing for takeoff?
Summary
The short answer is yes, I believe American Eagle is preparing for takeoff. With recessionary conditions in effect today, the company is within the ideal accumulation window when looking out to the 2026 timeframe. Furthermore, the company has developed a true growth engine in the Aerie segment, with which to offset its mature flagship stores.
In addition to the above, American Eagle is trading at a steep discount to the consumer discretionary sector across all metrics. This alone introduces upside potential via a reversion to the mean dynamic. When combined with conservative sales growth estimates, the mean reversion could be amplified by upside surprises to consensus sales and earnings estimates in the coming years.
In summary, American Eagle is a decidedly asymmetric risk/reward opportunity within a top sector choice for this stage of the economic cycle. American Eagle is indeed preparing for takeoff.
Price as of this report: $13.15
American Eagle Outfitters Investor Relations Website