
This is a brief market update as the market’s long and winding road back to the head and shoulders top is largely complete. With the return trip complete and Q1 earnings reports in full swing, it is an ideal time to take a step back and examine each side of the road.
The Road
The 5-year weekly chart below is of the S&P 500 index (NYSE:SPY), which captures both sides of the winding road. The orange lines represent the breakdown zone during the peaking process which spanned the final two quarters of 2021 and first two quarters of 2022. This resistance zone can be thought of as the decaying side of the image above.
The green line represents the primary support level which coincides with the October 2022 bottom. It was also the primary resistance level prior to the market topping process in Q3 and Q4 of 2021. Note that the upward sloping green line depicts the short-term price trend.
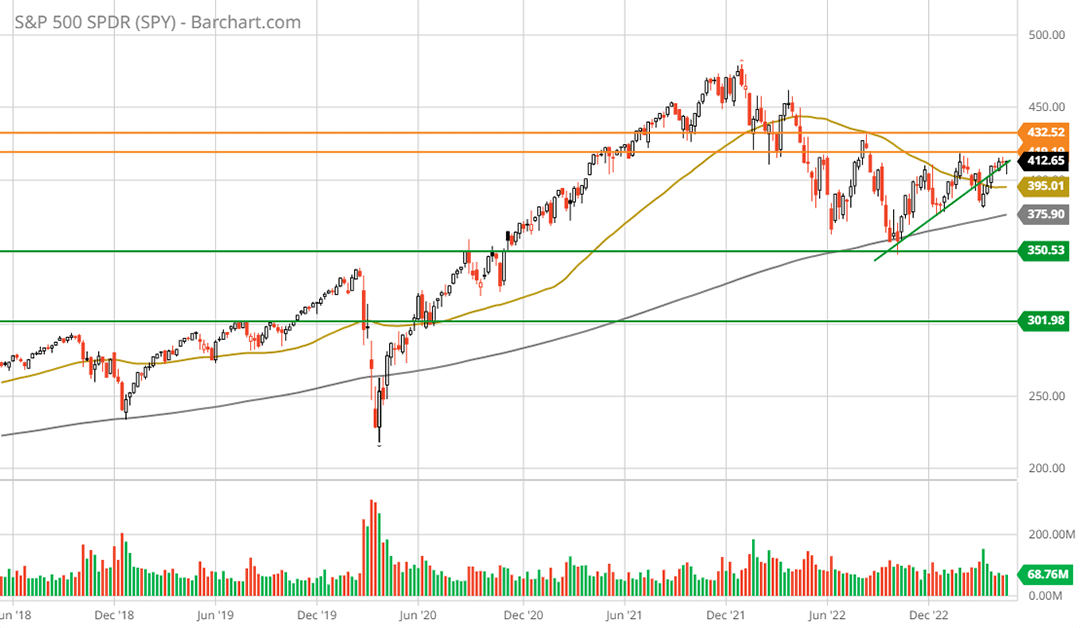
SPY 5-year weekly chart. Created by Brian Kapp using a chart from Barchart.com
The proximity of the S&P 500 to the primary resistance zone combined with a lack of upward momentum suggests an attempted breakout is more likely to fail than not, technically speaking. In fact, for all intents and purposes, the lack of momentum in either direction has now persisted for an entire year. The following 1-year daily chart provides a closer look.
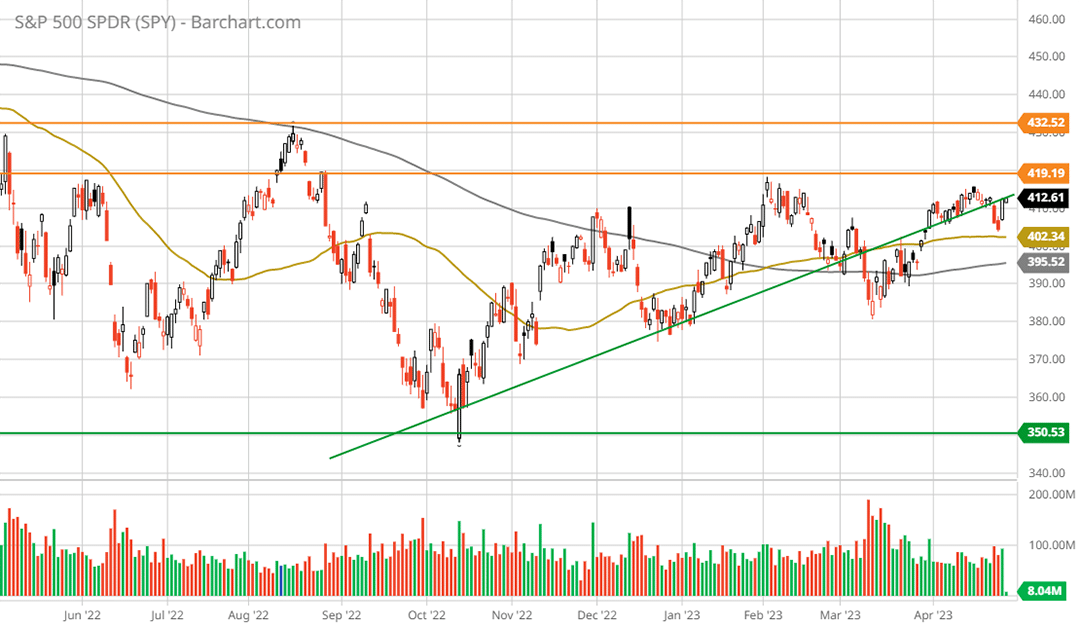
SPY 1-year daily chart. Created by Brian Kapp using a chart from Barchart.com
Note that the 50-day moving average (the gold line) is above the 200-day moving average (the grey line). This confirms the short-term uptrend which remains within a primary bear market. What we can say with certainty is that there is little momentum in either direction.
As such, given the primary downtrend in place, the proximity to the primary resistance zone at the head and shoulders neckline remains the dominant technical force. In the February 15, 2023 report entitled “New bull market or a bear market bounce?”, I summarized the situation as follows:
The fundamental and technical signs point to the broad US stock market nearing a short-term peak. Technically, the head and shoulders neckline from the topping process looms large. From a fundamental perspective, valuations remain extended in relation to the historical evidence and near-term earnings growth.
At the time of that report, the SPY was trading near $414, which is where it is trading today. As a result, the question is: does the above summary of the market backdrop still hold?
The Recession
Technically speaking, the above summary remains the case today. On the fundamental side, as first discussed in the September 15, 2022 report “The recession is here, filter the noise,“ the economy remains in what is best described as an inflationary contraction. This is a recession by any other name.
The official declaration of such, whether or not it occurs, is largely irrelevant from an investment perspective. Official recessions are back dated, after all. The following passage from the report captures the essence:
Given the lags and flaws inherent in economic statistics and data collection, an extra filter is required. As a result, it is helpful to go directly to the source for confirmation of where we are in the economic cycle. The source is the corporations themselves.
The following passage exemplifies the investment irrelevancy of trailing economic data:
Eastman Chemical’s Q3 warning points to recessionary conditions being in effect with a likely start date of Q2 2022 into Q3 2022. Eastman is confirming what we have already heard from RH and other cyclical industries, such as semiconductors.
From an investment perspective, one usually captures the most asymmetric risk/reward opportunities in cyclical stocks by buying during the early stages of a recession. Interestingly, a week prior to Eastman’s Q3 warning, I wrote positively about the company as its valuation was on the cusp of pricing in a recession.
The Eastman Summary below is the summary from the September 6, 2022 report titled “Eastman Chemical is entering a bull market.“ I include it here as a reminder of the old saying: “it is a market of stocks, not a stock market.”
The saying is worth remembering as sectors, industries, and individual stocks react to different economic factors at different times of the economic cycle. Another cyclical example can be found in the October 3, 2022 report titled “A top sector choice for the coming cycle.” It was published within eight days of the October 2022 S&P 500 bottom.
Eastman Summary
After eight years of sideways consolidation, Eastman Chemical looks to be on the cusp of a new bull market. The high likelihood of Eastman surpassing consensus growth estimates through mid-decade combined with its deeply discounted valuation creates an excellent multiple expansion opportunity.
Eastman’s leveraging of secular growth opportunities combined with its organic growth and increasingly premium product mix set the stage for above-average growth rates well into the future. With the consensus expecting stagnant sales into mid-decade, the upside surprises could become substantial. This dynamic could introduce the high end of the fundamental upside targets discussed above.
The above-average dividend yield of 3.4% is likely to grow at well-above-average rates into the foreseeable future. The capital return program is supplemented by a substantial share buyback program. Eastman’s capital return program should provide material support alongside the strong technical foundation nearby.
Finally, the high quality of Eastman’s business is likely being undervalued by the market. This opens the door to further multiple expansion opportunity as Eastman is rerated to the higher-quality end of the materials sector. Eastman offers a truly asymmetric risk/reward opportunity.
Summary
Eastman, like the market, has remained largely unchanged since the September 2022 report. The primary difference between the two is that Eastman is well-defined by its cyclical nature, whereas the market indices are not. The market cap-weighted indices are dominated by technology-related mega-cap corporations. These companies were the secular growth beneficiaries of the last economic cycle.
The last economic cycle ended as 2022 began, with the market indices peaking six months in advance of the onset of recessionary conditions for Eastman. From a historical perspective, this is par for the course in terms of broad stock indices leading the onset of recessions.
While Eastman is trading within its most asymmetric risk/reward window, a recession, it is unclear that the same applies to the broad market indices. The peculiarities inherent in the large technology overweight in the indices is a function of them being the beneficiaries of the just ended cycle.
Complicating matters for the market-cap indices is the explosion of technology budgets since 2019, which points toward the possibility that technology spending could be entering a mean reversion period. This was discussed in more detail in the December 20, 2022 report “Technology outlook for 2023.”
In summary, the market indices continue on the winding road and are likely to struggle with gaining upside momentum given the peculiarities of the moment. That said, there are many opportunities under the market cap-weighted surface. These opportunities are discussed in more detail in the sector series reports previously published on stoxdox.com.