This piece is an extension of the “Sector strategies for navigating 2023” report, which concluded with the top eight sectors for the remainder of 2023 and a review of the biotech opportunity in particular. Here, I will review five of the eight industries with the highest expected earnings growth rates over the next three to five years. The following table, compiled from State Street, displays these industries and their summary data.
The PE FY 1 column is the PE based on forward earnings estimates, the 3-5 yr % column is the expected annual earnings growth rate, and the market cap column is the weighted average for each industry in billions of US dollars.
Top 5 Industries for Earnings Growth
I have covered many individual companies in the above industries. As a result, I can attest to the relative attractiveness of the groups. The constituents in each index fund offer broad industry exposure via the number of companies (231) and the modified equal-weighted approach (46 companies per industry on average).
These factors, especially the weighting methodology, outweigh the relatively small negative effects expected from the less than desirable companies in each index. One could complement the industry exposure above with a more targeted portfolio of individual stocks and ETFs.
A great example of a missed opportunity in the top five industry list is the metals and mining industry. It did not make the top eight list due to its exposure to near-term downside cyclicality. The degree of which is difficult to quantify as the industry was on the receiving end of material price inflation.
On the other hand, there are many individual metals and mining opportunities for which the outlook is clearer and quite favorable. The following reports cover opportunities that would complement the top five list with exposure to the metals and mining industry:
Opportunities in the energy sector that would complement the two oil and gas industries in the top five include:
- “A top sector choice for the coming cycle”
- “Schlumberger is an asymmetric opportunity with supercycle potential”
The two energy industries in the top five list lack international exposure, which offers greater growth potential than the US. Adding OIH adds the international diversification quite nicely while adding a material overweight position in Schlumberger.
Oil and Gas
I covered the bullish intermediate-term outlook for the oil and gas industries in several recent reports. As the fundamentals and technicals are in alignment in supporting a continuation of the energy bull market, tactical considerations are front and center. The following reports cover the bullish backdrop:
- “Relative opportunities in energy for 2023”
- “Is the sun setting on energy stocks?”
- “A top sector choice for the coming cycle”
- “CNX Resources: The Saudi Arabia of natural gas”
Energy Equipment and Services
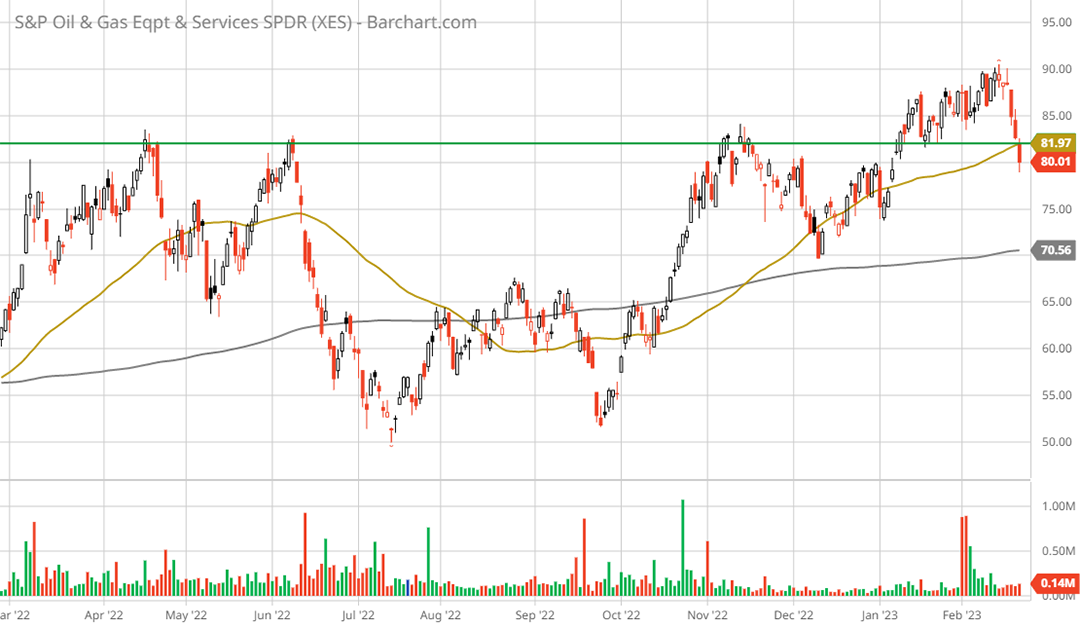
Given the uptrend, the technical backdrop offers a sufficient overview for tactical considerations. I will start with the energy services and equipment industry as it is the top sector choice for the current cycle. The following 1-year daily chart of the SPDR® S&P® Oil & Gas Equipment & Services ETF (NYSEARCA: XES) captures the recent breakout attempt and current retest of what was once a key resistance level. It is now support and is represented by the green line.
SPDR® S&P® Oil & Gas Equipment & Services ETF XES 1-year daily chart. Created by Brian Kapp using a chart from Barchart.com
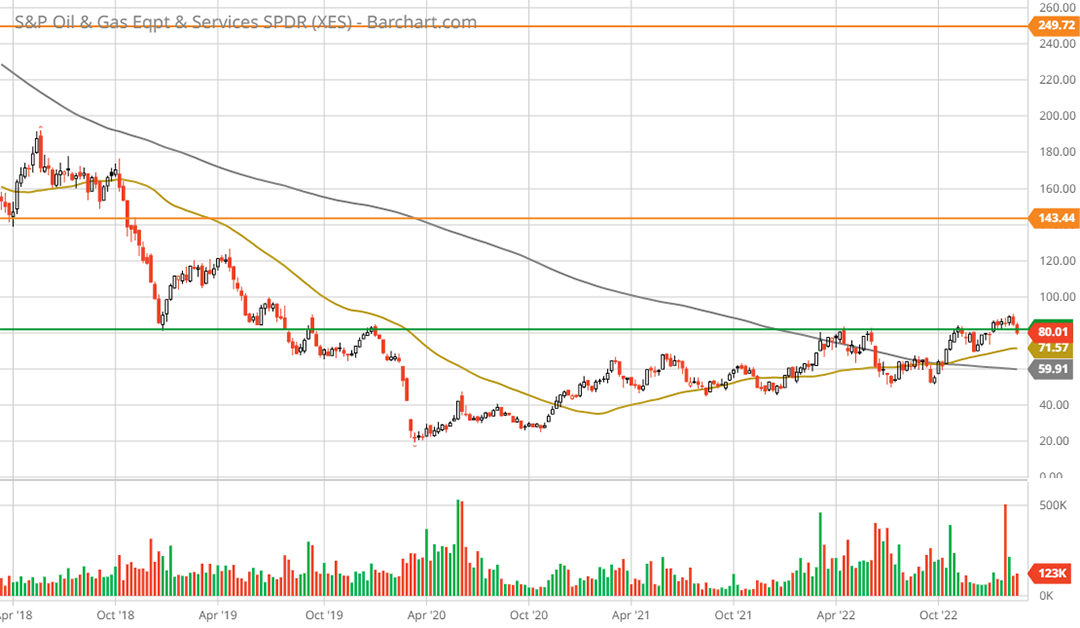
Notice that the 50-day moving average (the gold line) crossed above the 200-day moving average (the grey line) on November 15, 2022. This is a bullish signal in the context of the year-long consolidation process and breakout attempt. The following 5-year weekly chart captures the uptrend within which the recent consolidation occurred.
SPDR® S&P® Oil & Gas Equipment & Services ETF XES 5-year weekly chart. Created by Brian Kapp using a chart from Barchart.com
The sideways consolidation began in March 2021 and lasted nearly two years. Notice that the 50-week moving average crossed above the 200-week moving average on October 10, 2022. Given the long bottoming process, the weekly golden cross is signaling a long-term trend reversal.
In summary, the energy equipment and services industry is in a bull market and on the doorstep of breaking out from a major 5-year resistance level (the green line). It is an ideal technical setup, although there is potential for a short-term price correction back to the 50-week moving average near $72.
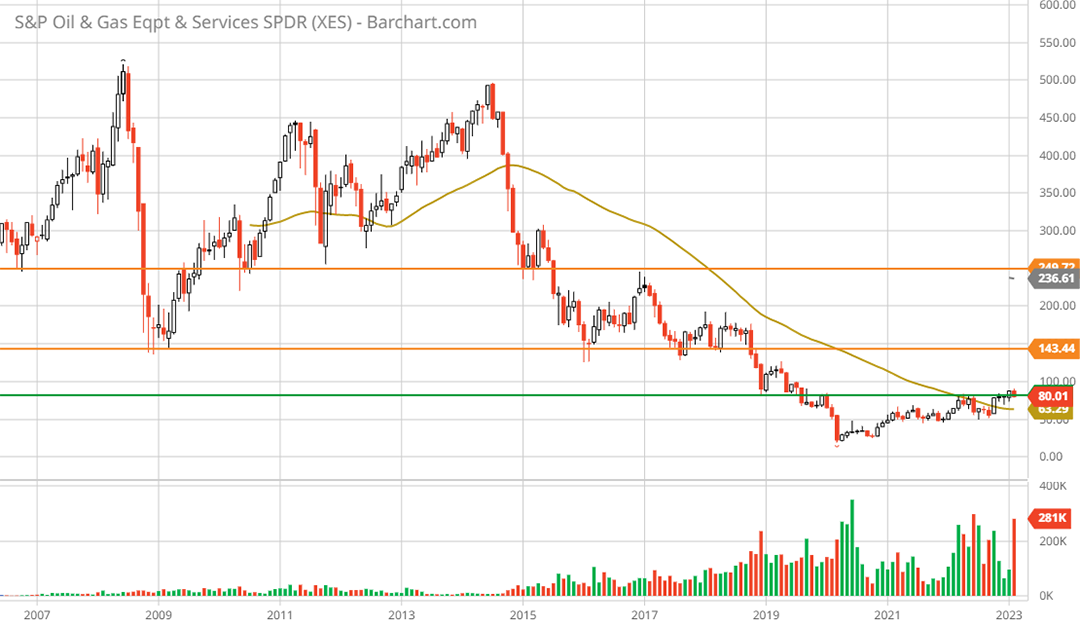
Looking over the intermediate term in the next chart, the two orange lines represent the primary resistance levels. From a fundamental perspective, the two upside targets are well within the realm of possibilities. The following monthly chart places the key resistance levels in context.
SPDR® S&P® Oil & Gas Equipment & Services ETF XES max monthly chart. Created by Brian Kapp using a chart from Barchart.com
The upside potential to the two technical targets is 80% and 213%, respectively. In the nearer term, the first target is achievable and is well supported by the fundamentals. The second target is achievable over the intermediate term. Each of the technical targets date back to the 2007 to 2009 period, pointing to marginal upside resistance once a successful breakout above the green line is confirmed.
The energy equipment and services industry remains a top choice for the current cycle.
Oil and Gas Exploration and Production
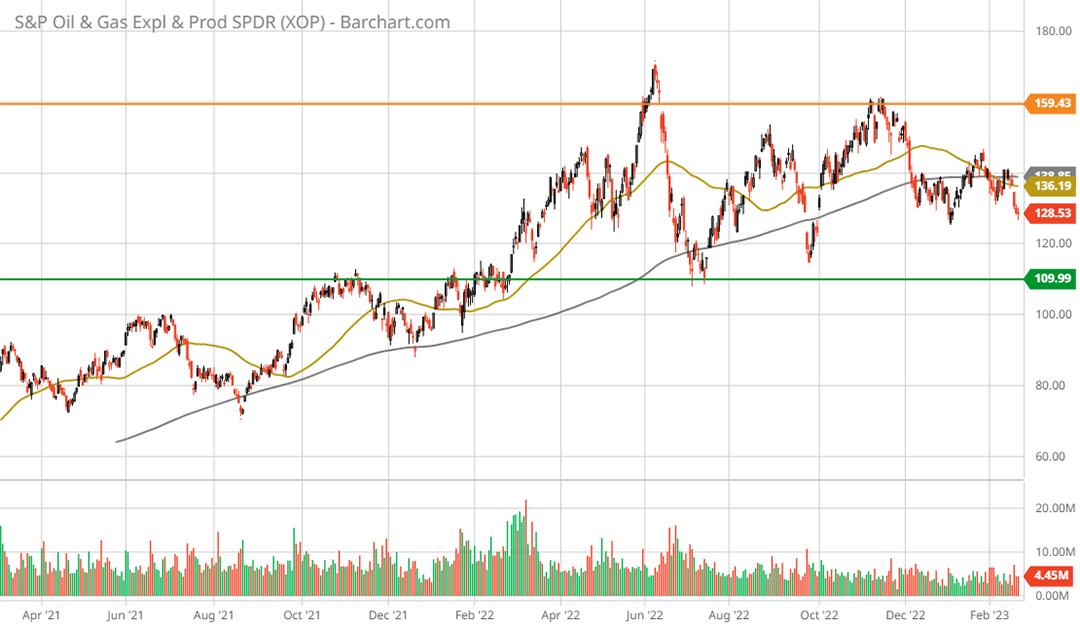
While the oil and gas producers offer less upside potential than the energy equipment and services industry, the deeply discounted valuations in the group offer an added margin of safety. The SPDR® S&P® Oil & Gas Exploration & Production ETF (NYSEARCA: XOP) trades at 5.64x forward earnings estimates compared to the XES at 13.75x estimates. The following 2-year daily chart sets the stage.
SPDR® S&P® Oil & Gas Exploration & Production ETF XOP 2-year daily chart. Created by Brian Kapp using a chart from Barchart.com
The XOP is in a well-defined uptrend, which includes the recent year-long sideways consolidation. Notice that the 50-day moving average (the gold line) crossed beneath the 200-day moving average (the grey line) in early February 2023.
Given the established uptrend, discounted valuations, and positive industry conditions, the death cross is likely a reflection of the duration of the consolidation rather than a signal of an impending trend reversal. The following 5-year weekly chart places the recent consolidation in context of the current bull market.
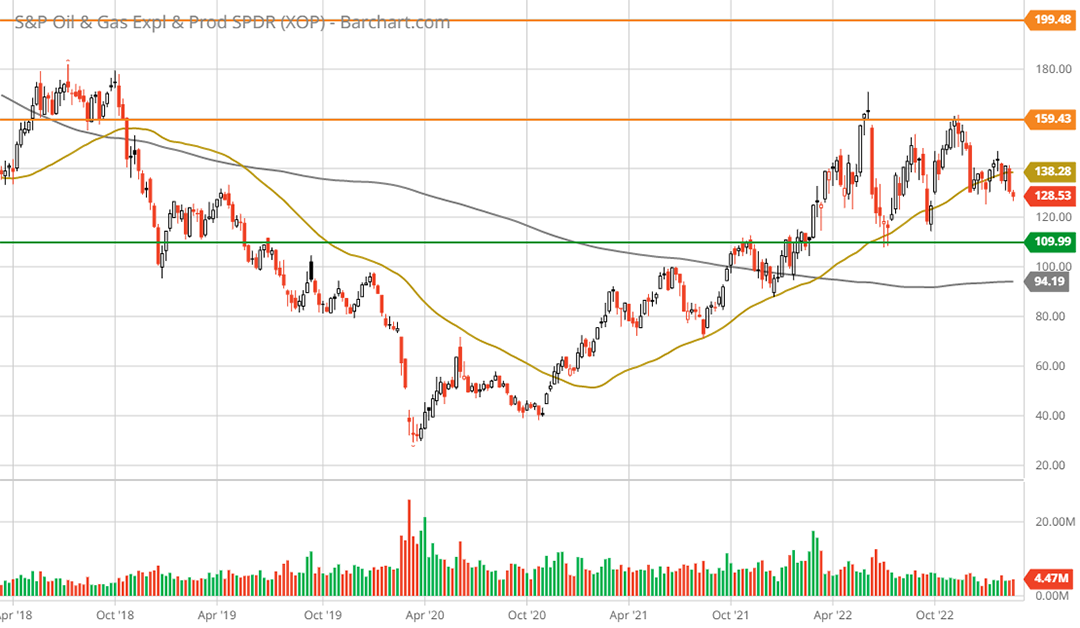
SPDR® S&P® Oil & Gas Exploration & Production ETF XOP 5-year weekly chart. Created by Brian Kapp using a chart from Barchart.com
Notice that the 50-week moving average crossed above the 200-week moving average in March 2022. This is a bullish long-term trend change signal in the context of a long bear market in energy and the aforementioned positive fundamentals. The weekly golden cross in March 2022 also marked the beginning of the year-long consolidation process. The following monthly chart provides further context.
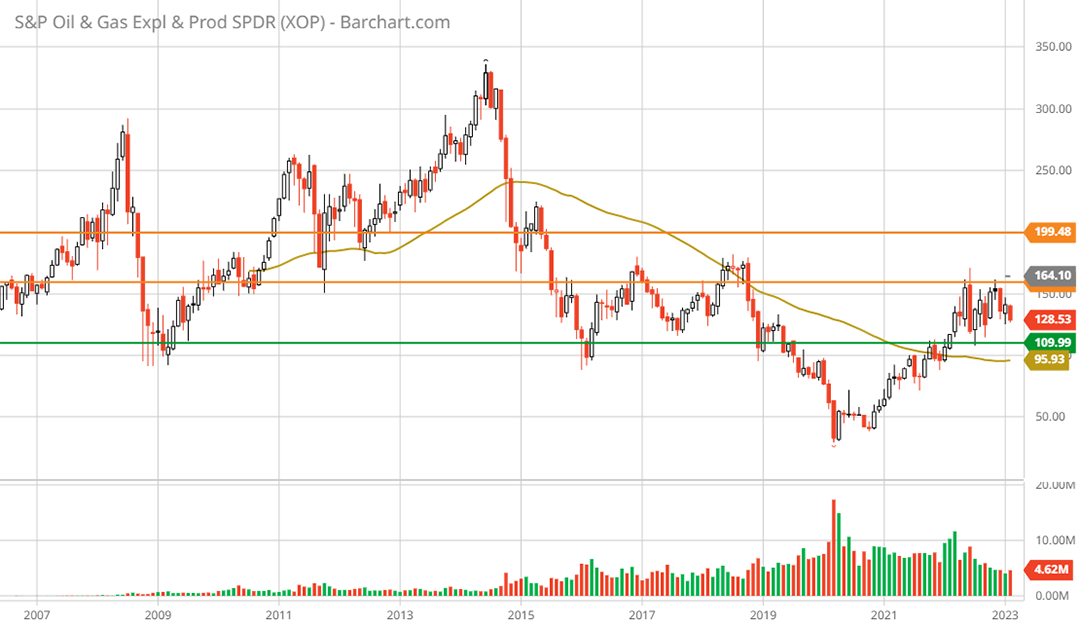
SPDR® S&P® Oil & Gas Exploration & Production ETF XOP max monthly chart. Created by Brian Kapp using a chart from Barchart.com
The green line represents the primary support level near $110, which represents 15% downside potential. The key resistance levels are identified by the orange lines and represent upside potential of 24% and 55%, respectively. Given the lack of trading above the first resistance level since 2015, technical resistance is likely to be mild until the second target near $200.
Strong technical underpinnings combine with favorable fundamentals and discounted valuations to create an asymmetric risk/reward opportunity in the oil and gas exploration and production industry.
Insurance
The bullish case for the insurance industry is two-fold. The extreme asset price inflation in recent years combined with well-above average inflationary trends has created favorable industry conditions. Insurance is a direct beneficiary of inflation on the revenue side, while being more insulated than most from inflationary cost pressures. Secondly, the industry is less exposed to interest rate and credit risk. The following table summarizes the segmentation of the insurance industry SPDR® S&P® Insurance ETF (NYSEARCA: KIE) by line of business.
Looking over the intermediate to longer term, the insurance industry is in a secular uptrend as can be seen in the following monthly chart.
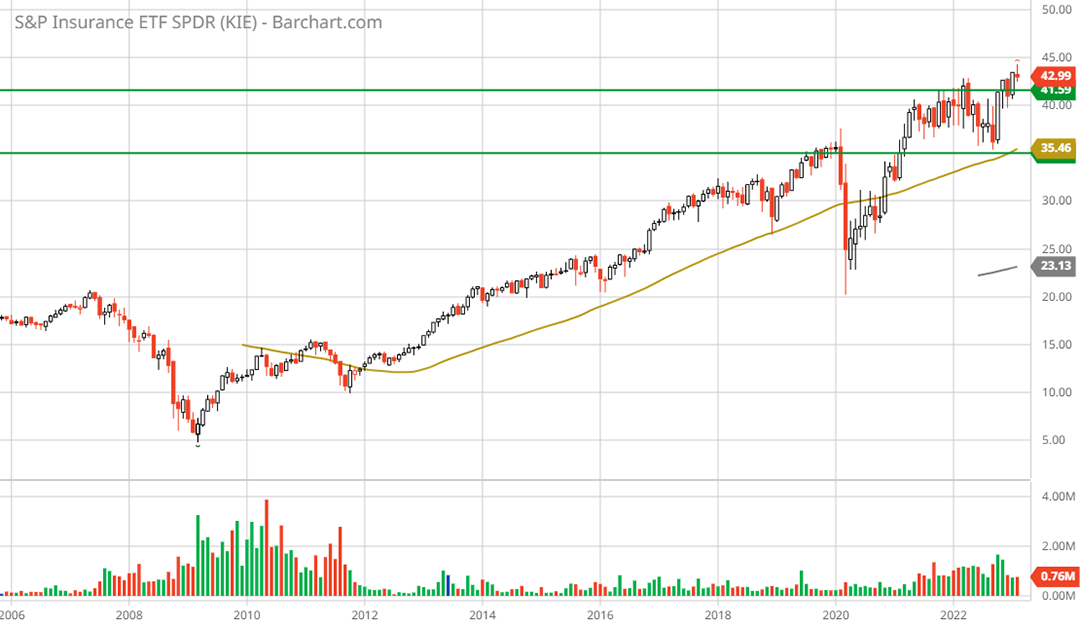
SPDR® S&P® Insurance ETF KIE max monthly chart. Created by Brian Kapp using a chart from Barchart.com
One would be hard pressed to find an industry in a more stable uptrend than insurance. Keep in mind that the 2008 decline was an unusual panic period for financial companies and was quickly reversed by the insurance industry, unlike the banking sector. Similar dynamics are at play today.
Given the stage of the current cycle, and the exposure of banks and capital market firms to credit and interest rate risks, insurance is relatively attractive compared to the broader financial sector. The 5-year weekly chart below displays the more subdued uptrend in recent times.

SPDR® S&P® Insurance ETF KIE 5-year weekly chart. Created by Brian Kapp using a chart from Barchart.com
The green lines represent key support levels. As the price is at an all-time high, there is no technical resistance visible. The downside to the two support levels is -5% to -18%, respectively. Like the energy industries, insurance has been in a one-to-two-year sideways consolidation, The following 2-year daily chart zooms in on the consolidation and recent breakout to new all-time highs.
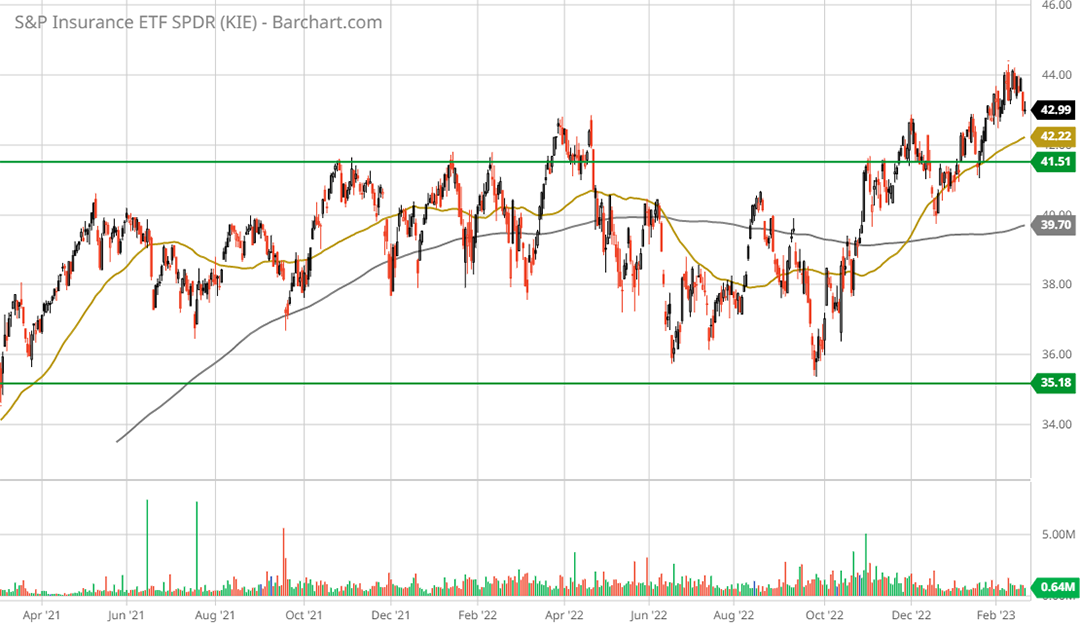
SPDR® S&P® Insurance ETF KIE 2-year daily chart. Created by Brian Kapp using a chart from Barchart.com
The insurance industry is sitting on what should be strong support, which has formed over the past two years. While a retest of the upper support zone is to be expected, the discounted valuation of 11x earnings estimates combined with the expected 17% earnings growth rate over the intermediate term points to a continuation of the long-term bull market.
Transportation
Similar to the insurance industry, transportation is in a well-established uptrend. The long-term uptrend is complemented in the short term by the transports being in a cyclical bottoming process. I covered the cyclical downturn and fundamentals in the following reports:
The following monthly chart captures the long-term uptrend of the SPDR® S&P® Transportation ETF (NYSEARCA: XTN). This is followed by the 1-year daily chart which captures the recent bottoming process. Note that the green lines represent key support levels, and the orange line depicts the only visible resistance zone. In all of the charts, the gold line is the 50-period moving average and the grey line is the 200-period moving average.
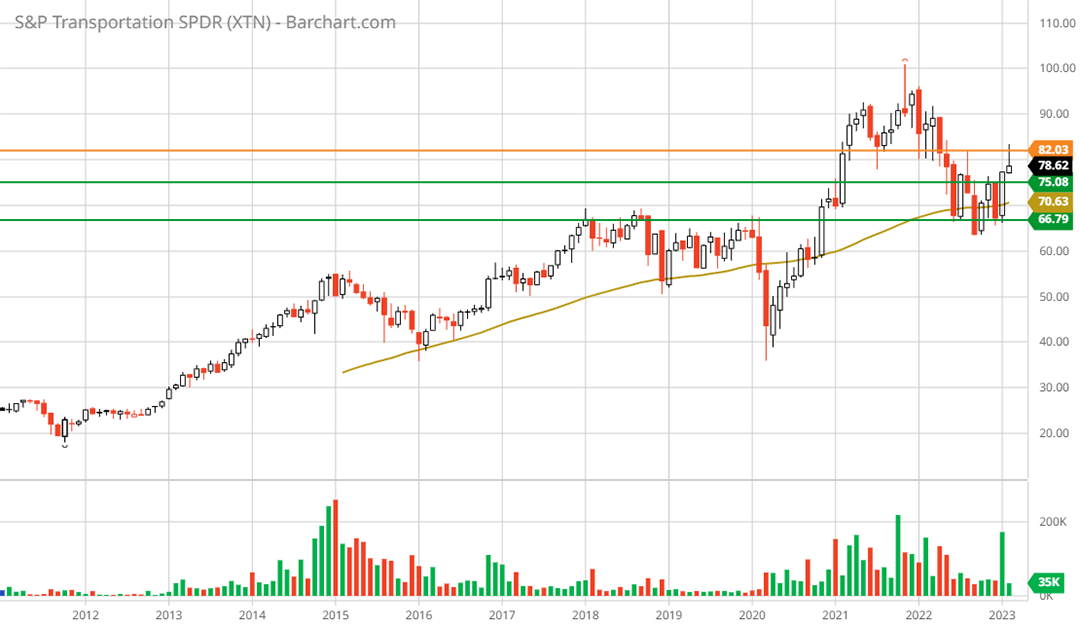
SPDR® S&P® Transportation ETF XTN max monthly chart. Created by Brian Kapp using a chart from Barchart.com
Notice that the shares recently bounced off lower support, which dates back to 2018 and coincides with the 50-month moving average. The 1-year daily chart below captures the recent bottoming process.
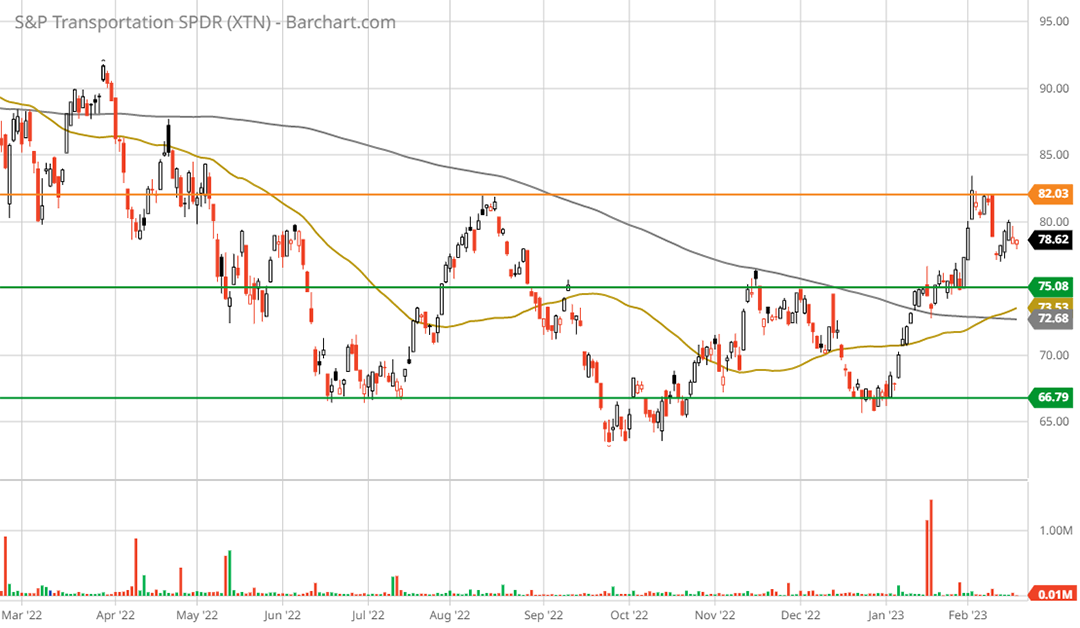
SPDR® S&P® Transportation ETF XTN 1-year daily chart. Created by Brian Kapp using a chart from Barchart.com
Notice that the 50-day moving average crossed above the 200-day moving average in February 2023. This is a bullish signal given the duration of the bottoming process combined with the stage of the economic cycle, discounted valuations, and above-average earnings growth over the intermediate term.
Telecom
The telecom industry rounds out the top five industries. Several bullish factors are at play. First, telecom networks globally are being upgraded to expand capacity, which was touched on in the report, “Comcast is riding the information wave.” Second, the high degree of macroeconomic uncertainty renders the stability of the industry relatively attractive. Finally, the discounted valuations and generally robust earnings growth outlook, at 12x expected earnings and a 12% growth rate, open the door to multiple expansion.
The following monthly chart of the SPDR® S&P® Telecom ETF (NYSEARCA: XTL) captures the long-term uptrend. The subsequent 5-year weekly chart displays the 5-year consolidation and strong nearby support. Note that the green line represents the primary support level and the orange line denotes the only visible resistance.
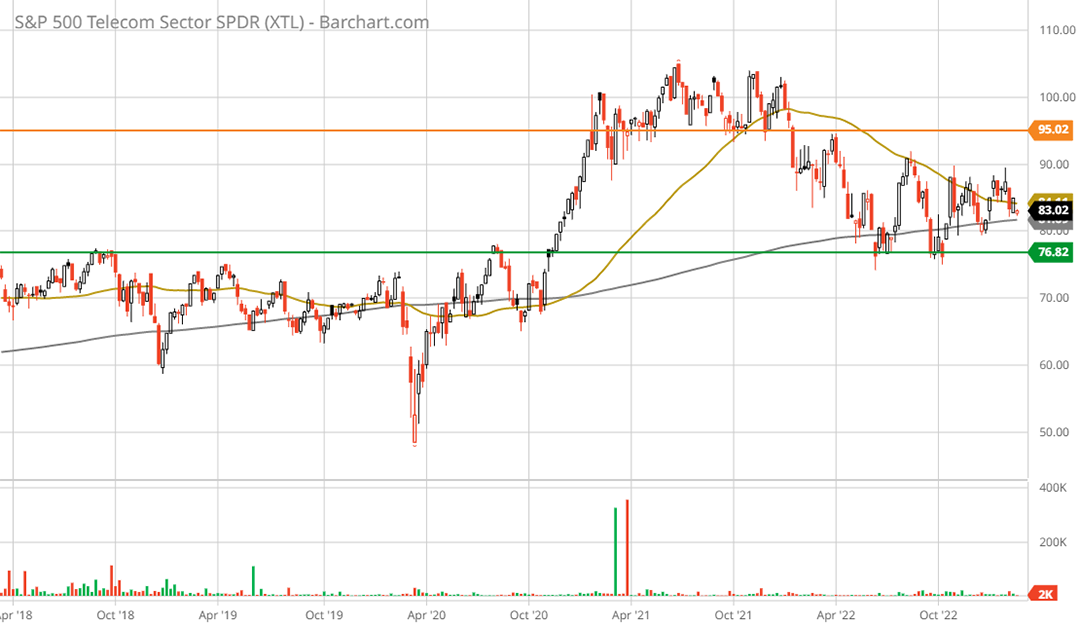
SPDR® S&P® Telecom ETF XTL 5-year weekly chart. Created by Brian Kapp using a chart from Barchart.com
Notice on the above chart that the 50-week moving average remains above the 200-week moving average, signaling that the long-term uptrend remains intact. As the telecom industry is sitting just above primary support and the 200-week moving average, it is in an ideal accumulation zone within in a long-term uptrend.
Summary
With an average PE of 11x forward earnings estimates, the top five industries for earnings growth minimize the primary risk in today’s market: multiple compression. On the upside, the average earnings growth estimate of 24% over the coming three to five years opens the door to significant multiple expansion potential. The top five industries for earnings growth are decidedly asymmetric risk/reward opportunities.
I will cover the final two of the top eight industries, healthcare services and retail, in a subsequent report.


