
There is heightened uncertainty surrounding the outlook for 2023. In our report, “2023 economic outlook,” we place current events into historical context in order to illuminate the economic pathway. From the report:
We are at a critical juncture for the US economy. The current cycle shares many similarities with the 2000 bubble pop and labor participation reversal in addition to similarities with the 1970’s inflationary episode.
As we traverse the global phase change, increasing cross currents throughout the economy are the defining feature. Portfolio strategies that are well suited for such environments were explored in “Magellan and navigating uncharted markets”:
“The system is ideally suited for uncertain times, an actionable framework for managing stocks through time and space.”
Asset Opportunities in Small-Cap Value
The similarities today with the 2000 bubble pop and the 1970’s inflationary episode are many, as are the differences. Small-cap value performed exceptionally well following the dotcom bust. There were two contributing factors to the outperformance.
First, small-cap value offered initial starting conditions that were the opposite of the bubble valuations prevalent across the market-cap-weighted indices. They traded at deeply discounted valuations. Secondly, the economic cycle was shifting to a classic cyclical upturn rather than a resumption of the valuation-driven secular growth outperformance. This was amplified by the long period of underperformance for small-cap value which preceded the 2000 valuation top.
These conditions are in effect today.
CNX Resources
With conditions favoring small-cap value, asset opportunities within the group are especially attractive. As outlined in “Magellan and navigating uncharted markets,” the attractiveness of asset opportunities lies in the potential for added and tangible downside protection, which is manifest in the identifiable asset values. CNX Resources (NYSE:CNX) is a great example of this today.
The Saudi Arabia of Natural Gas
The cornerstone of the CNX Resources investment case is the size and quality of its resource base, which is composed entirely of its Marcellus and Utica shale acreage in Pennsylvania, West Virginia, and Ohio. As a result, reviewing the resource base is a top priority. The following resource summary is from our September 7, 2022 report, “CNX Resources: The Saudi Arabia of natural gas.”
An interesting report authored by Ray Boswell, “Evaluation of Technically-Recoverable Resources in the Marcellus and Utica Shale Gas Plays of the Appalachian Basin,” was published by the National Energy Technology Laboratory on June 23, 2021. The report captures the current state of estimates for what some have called “the Saudi Arabia of natural gas.” Please note that the Saudi Arabia of natural gas refers to the Marcellus and Utica shale plays in their entirety, and not CNX in particular.
The following two slides from the Boswell report set the stage by displaying recent EIA (Energy Information Administration) estimates for both the Marcellus and Utica shale resources. Please note that the total EIA resource estimate is arrived at by adding the absolute values of the final dark orange bar and green bar on the right-hand side of the two images below.
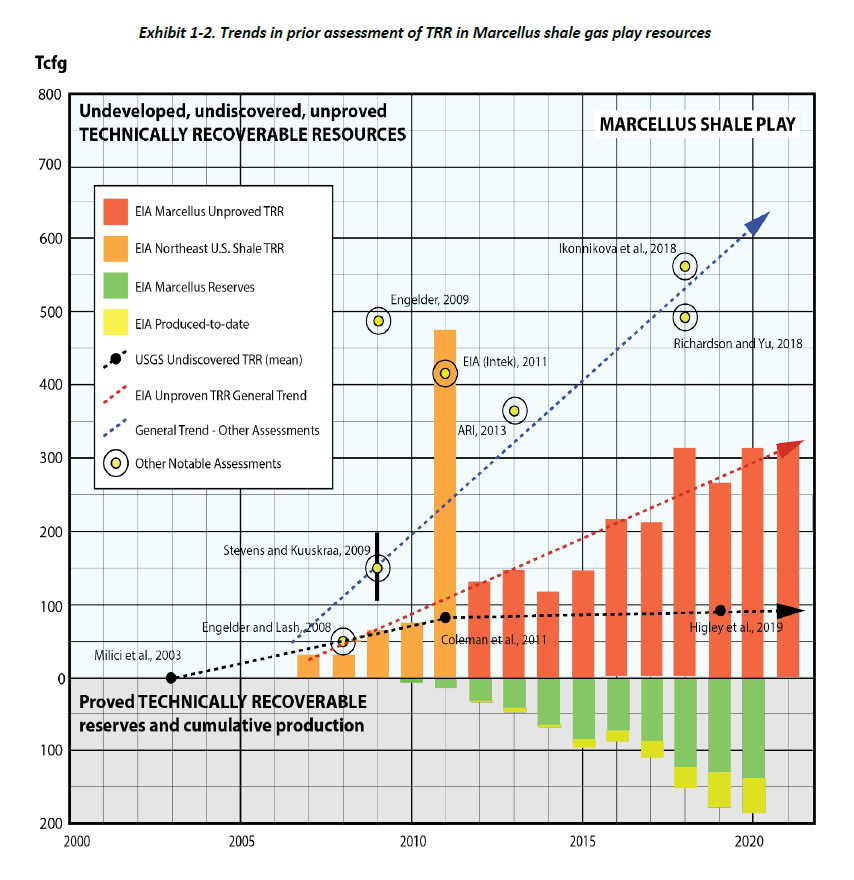
Source: “Evaluation of Technically-Recoverable Resources in the Marcellus and Utica Shale Gas Plays of the Appalachian Basin,” by Ray Boswell, National Energy Technology Laboratory, June 23, 2021
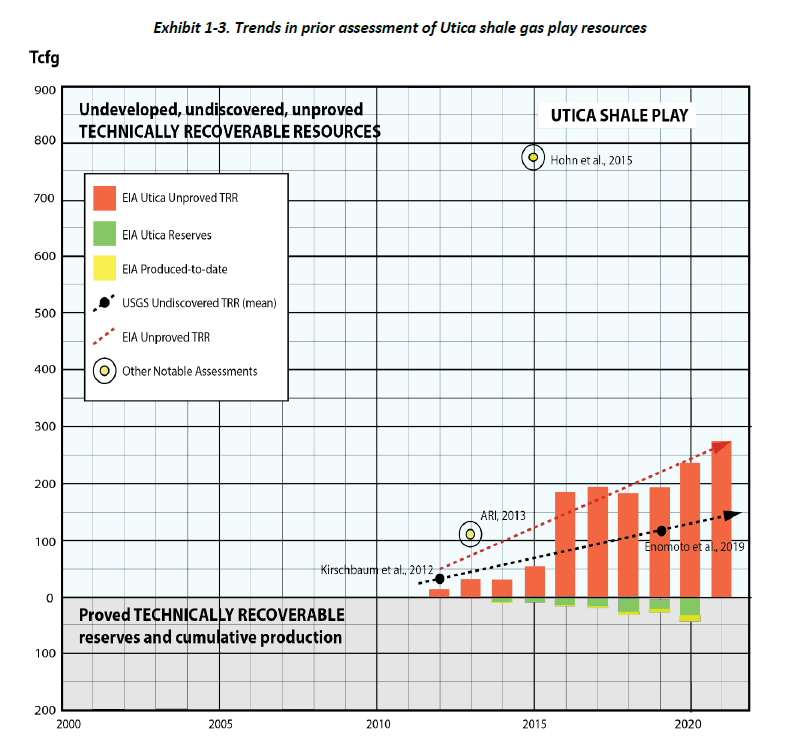
Source: “Evaluation of Technically-Recoverable Resources in the Marcellus and Utica Shale Gas Plays of the Appalachian Basin,” by Ray Boswell, National Energy Technology Laboratory, June 23, 2021
The most recent EIA estimate for the Marcellus shale resource is in the area of 450 tcfg (trillion cubic feet of gas) and the Utica estimate is near 300 tcfg for a total of 750 tcfg. For reference, the largest gas field in the world is estimated to contain 1,236 tcfg, which is the South Pars field under Iran and to a lesser extent Qatar.
The second largest field is the Urengoy field in Russia, which is estimated to contain 222 tcfg. Treating the Marcellus and Utica shale as one field would rank it number two in the world using official EIA estimates. Importantly, the EIA estimates are conservative by nature and are likely to materially underestimate the recoverable resource. The following image from the report summarizes Boswell’s findings and his estimates of the ultimate recoverable resource.
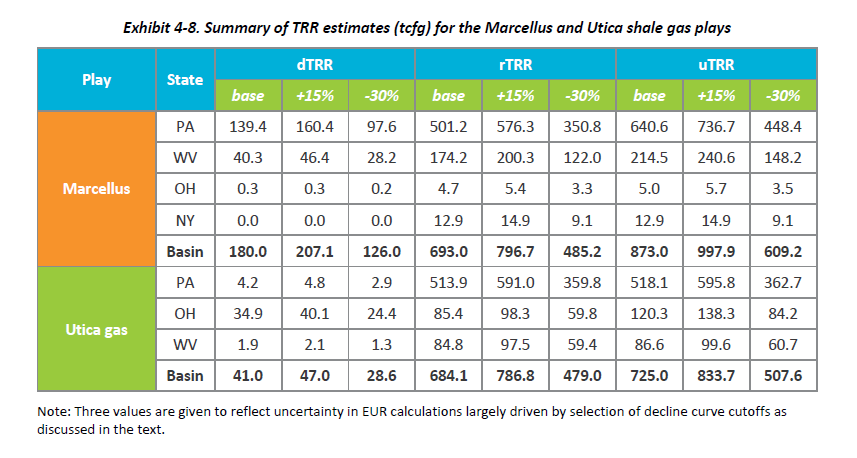
Source: “Evaluation of Technically-Recoverable Resources in the Marcellus and Utica Shale Gas Plays of the Appalachian Basin,” by Ray Boswell, National Energy Technology Laboratory, June 23, 2021
The two summary rows are bolded with the key data being found in the final three columns on the right-hand side under uTRR. The base case estimate is for a total recoverable resource of 1,598 tcfg with a margin of error between 1,117 tcfg (-30% to the base estimate) and 1,832 tcfg (+15% to the base estimate).
The Marcellus and Utica are clearly in the upper echelon of global resource potential. When compared to resource estimates for the largest gas field, near 1,236 tcfg, the Marcellus and Utica shale plays may indeed represent the Saudi Arabia of natural gas.
Shale Sweet Spots
The dominant feature of shale resource plays is that they contain sweet spots which are much more productive than the majority of locations along the resource deposit. This becomes evident in the following images from the Boswell report. The first image is a map of the Marcellus shale surface footprint and the recoverable resource estimates throughout the play. The second image displays the same information for the Utica shale.
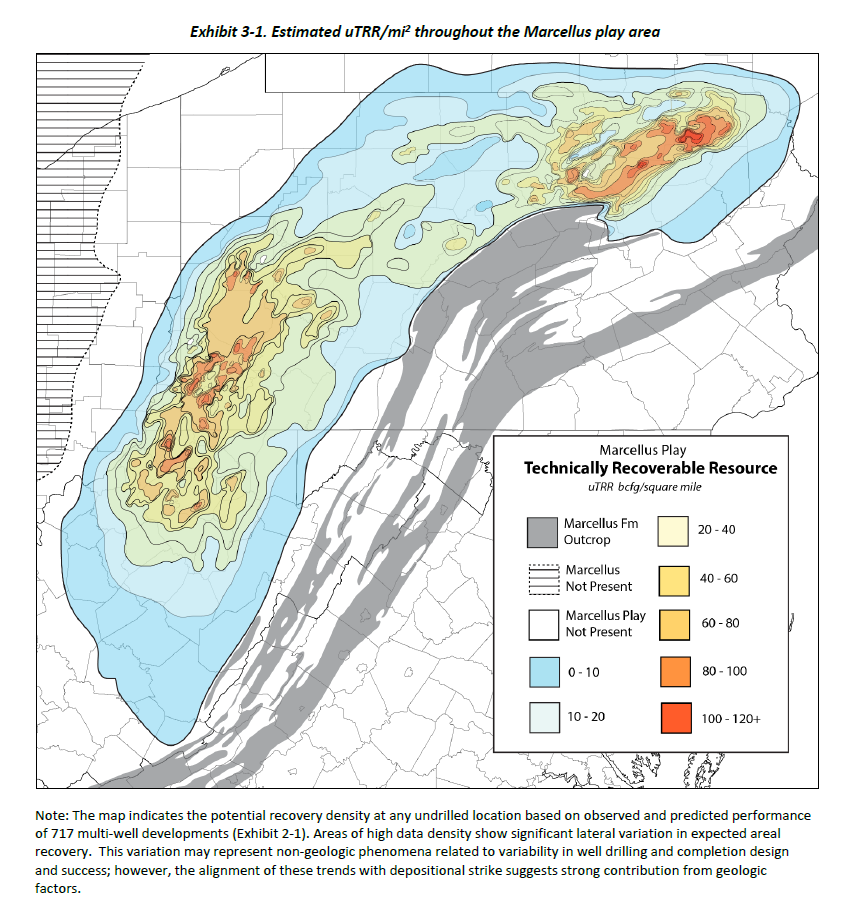
Source: “Evaluation of Technically-Recoverable Resources in the Marcellus and Utica Shale Gas Plays of the Appalachian Basin,” by Ray Boswell, National Energy Technology Laboratory, June 23, 2021
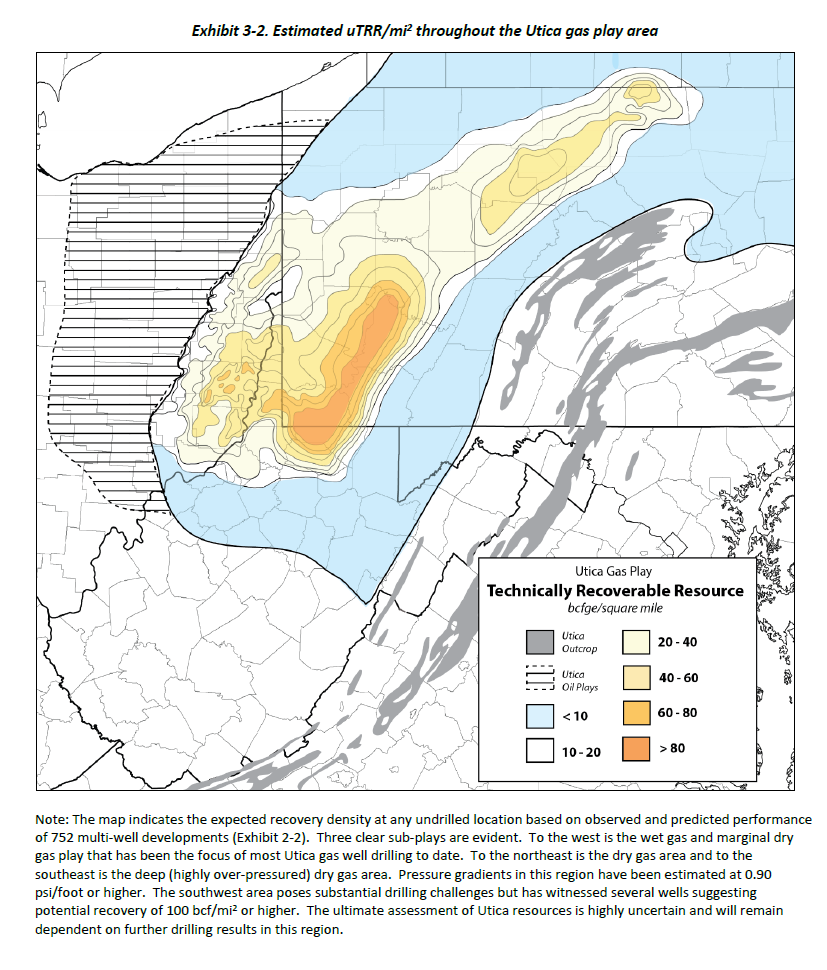
Source: “Evaluation of Technically-Recoverable Resources in the Marcellus and Utica Shale Gas Plays of the Appalachian Basin,” by Ray Boswell, National Energy Technology Laboratory, June 23, 2021
In the above images, notice that the more productive regions, or sweet spots, are shaded in the yellow to red end of the spectrum, with red representing the most prolific regions. Please take a mental snapshot of the yellow to red shaded areas.
These locations represent the highest value resource base within arguably the highest quality and largest recoverable gas resource in the world. The following image from CNX Resources’ Q1 2020 Earnings Results Presentation displays the surface footprint of the company’s acreage position, which is highlighted in yellow.
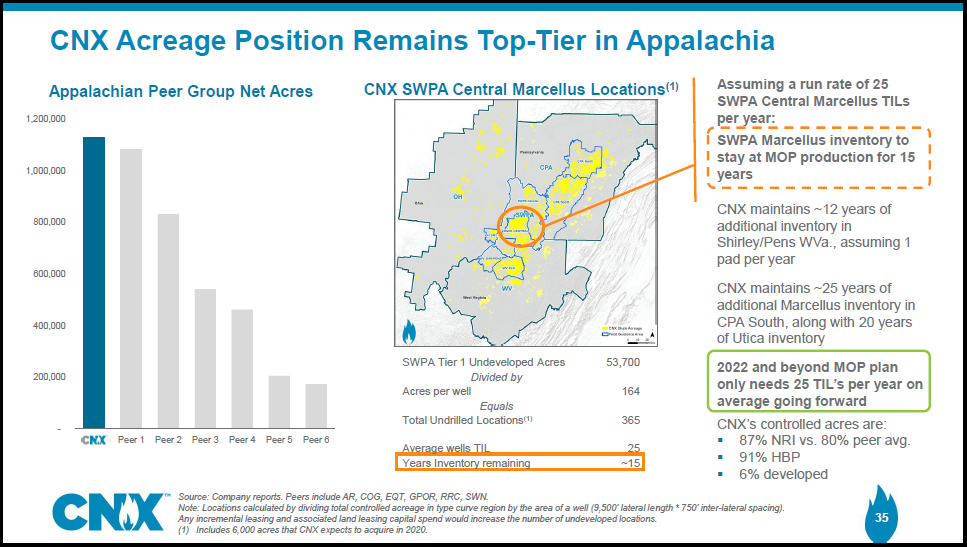
Source: CNX Resources Q1 2020 Earnings Results Presentation
A casual glance confirms that CNX’s resource base is within the sweet spots of the Marcellus and Utica shale plays. As a result, CNX’s asset base is truly world class. In addition to the world-class asset base, CNX has production visibility as far as the eye can see as shown on the right-hand side of the image above.
The orange highlighted information summarizes CNX’s core sweet spot in Southwestern PA. This premium acreage alone offers the company 15 years of production inventory at the current run rate of 25 new wells per year, or TILs in the above image. This level of activity is projected to maintain the company’s current level of gas production. When the remainder of the acreage is added, CNX has production visibility from top-tier assets beyond the life expectancy of most people on earth.
Fundamentals
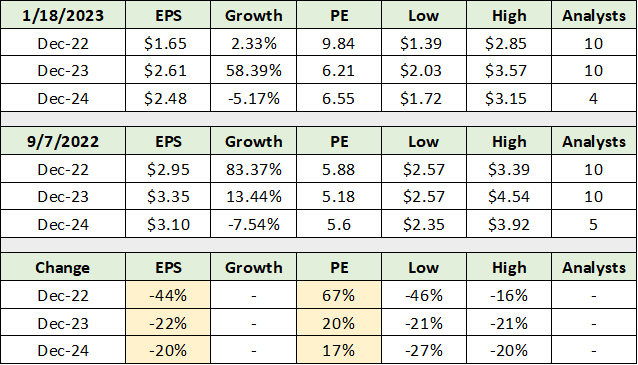
With top-tier assets and production visibility well into the future, the question turns to valuation. The following table displays recent consensus earnings estimates for CNX and compares them to those at the time of the September 2022 report. I have highlighted in yellow the key changes since September 2022.
Source: Seeking Alpha. Created by Brian Kapp, stoxdox
When viewing the changes since September, please note that estimates have been impacted heavily by CNX’s hedging program. Meaning, the company actively hedges the price of future gas production. When prices spike higher, such as what occurred following Russia’s invasion of Ukraine, hedging losses can be quite large and distort the value of the underlying assets.
Importantly, notice that the valuation multiple has expanded to offset the lowered earnings estimates. The share price is unchanged since the last report. This was to be expected as 5x the consensus earnings estimates for 2023 as of September 2022 is now transformed into 6x the lowered 2023 estimate. Given the incredibly low valuation still in place, the market continues to price in material earnings disappointments. As a result, the surprise potential is solidly to the upside.
Further valuation support is found in CNX’s cash flow generation. The company expects to generate a free cash flow yield of 24% to 36% per year over the next two years. If CNX can achieve its free cash projections, it will have a substantial share buyback opportunity. The following image from the company’s Q3 2022 earnings presentation displays its free cash flow ambitions.
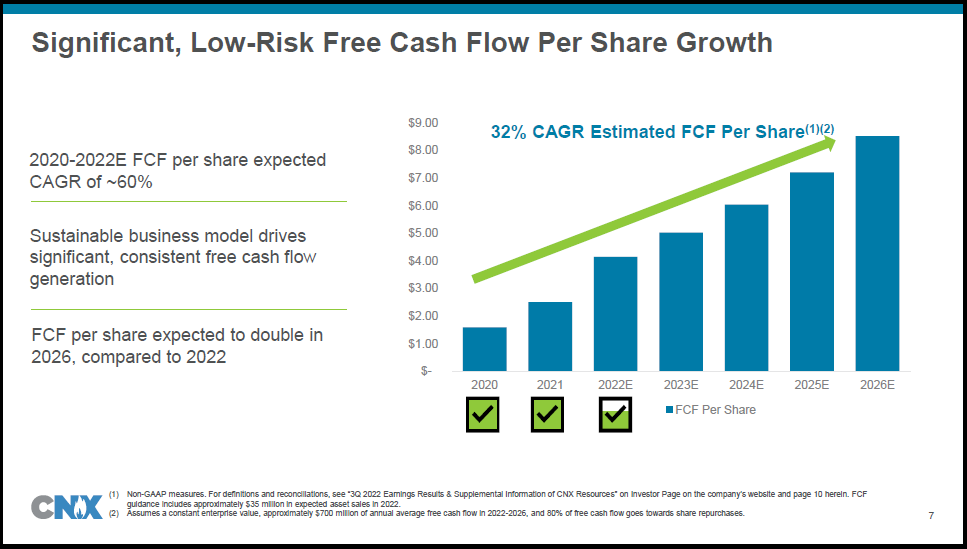
Source: CNX Resources Q3 2022 presentation
Finally, valuation support is found in CNX’s PV10 value filed with the SEC. The calculation is an industry standard which is designed to estimate the present value of each company’s expected cash flows, discounted at a 10% rate. The following table from CNX’s 2021 10-K filed with the SEC displays the company’s PV10 values for the past 3 years. Note that the 2021 figure is based on a gas price of $3.50.
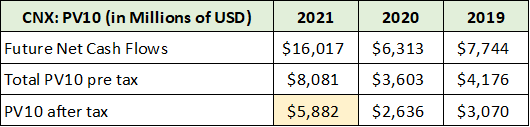
Created by Brian Kapp, stoxdox
Interpretation of the PV10 calculation should be tempered, however, it is a very rough and conservative approximation of value. At $6 billion after tax (highlighted in yellow) and a market capitalization near $3 billion, CNX’s equity is trading at a material discount to this present value calculation. When the company’s debt is added, the enterprise value is roughly equal to the PV10. As the debt is manageable and a capital allocation choice, the pure equity view is informative.
It should be noted that there is a strong case for a more bullish natural gas price environment going forward, which I covered in “Is the sun setting on energy stocks?” Globally, natural gas is a fuel of the future for powering decarbonization. It is a clean hydrocarbon and remains a top choice to replace coal.
Exports of US natural gas are a positive for CNX, though marginal from a volume production perspective. A key export benefit is the linking of US natural gas markets to those globally. Gas prices tend to be materially higher in international markets. This market dynamic should increasingly support US gas prices over time.
In terms of the US natural gas market, supply conditions are set to become much more favorable over the coming decade as the explosion of US shale oil production has crested. US oil production more than doubled over the past decade, while shale oil wells produce 50% gas by volume on average. US oil production flooded the natural gas market, thereby suppressing prices.
As a result, a major headwind for natural gas prices, US oil production growth, has been removed. Projections for US natural gas supply growth through 2050 suggest a much more supportive pricing environment than was the case over the past decade. The following image displays the EIA’s forecast.
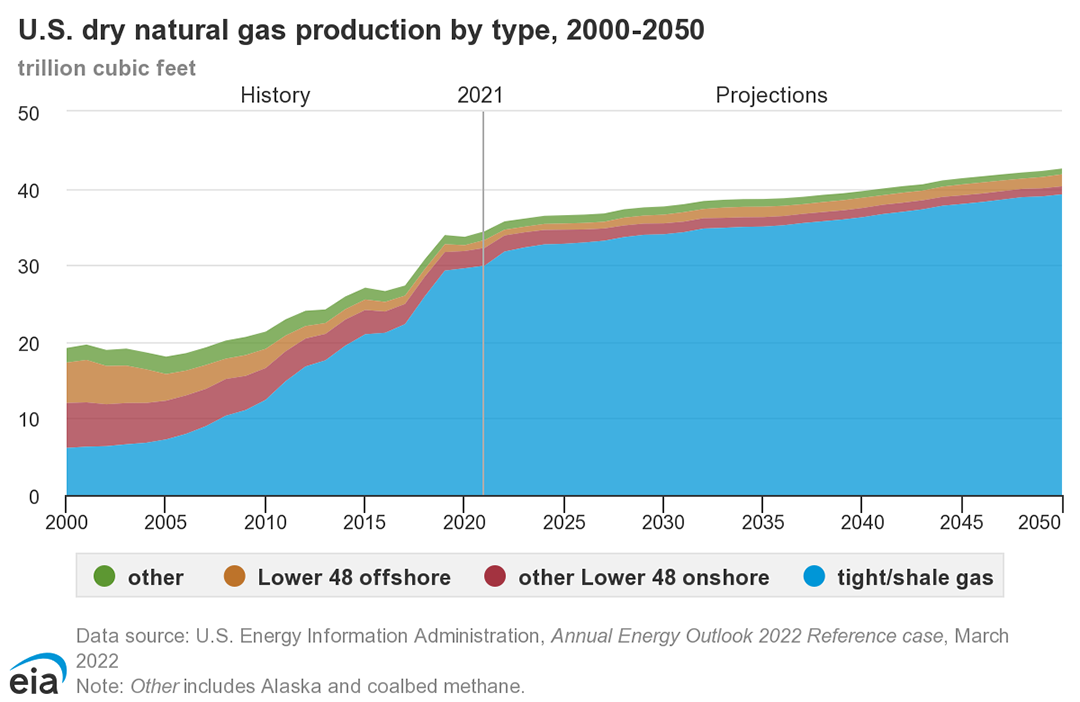
Source: EIA
Importantly, the export tailwinds for stronger US gas pricing look to be secular in nature as do the more favorable domestic supply conditions, which are projected to tighten materially. The cyclical and secular industry backdrop are quite bullish for CNX.
Technicals
Complementing the bullish fundamentals is the technical backdrop, which is becoming quite bullish for CNX. The 5-year weekly chart below captures the established uptrend since the COVID bottom. It also highlights what is likely to be a strong support zone nearby, which was built during the 2018 to 2021 timeframe.
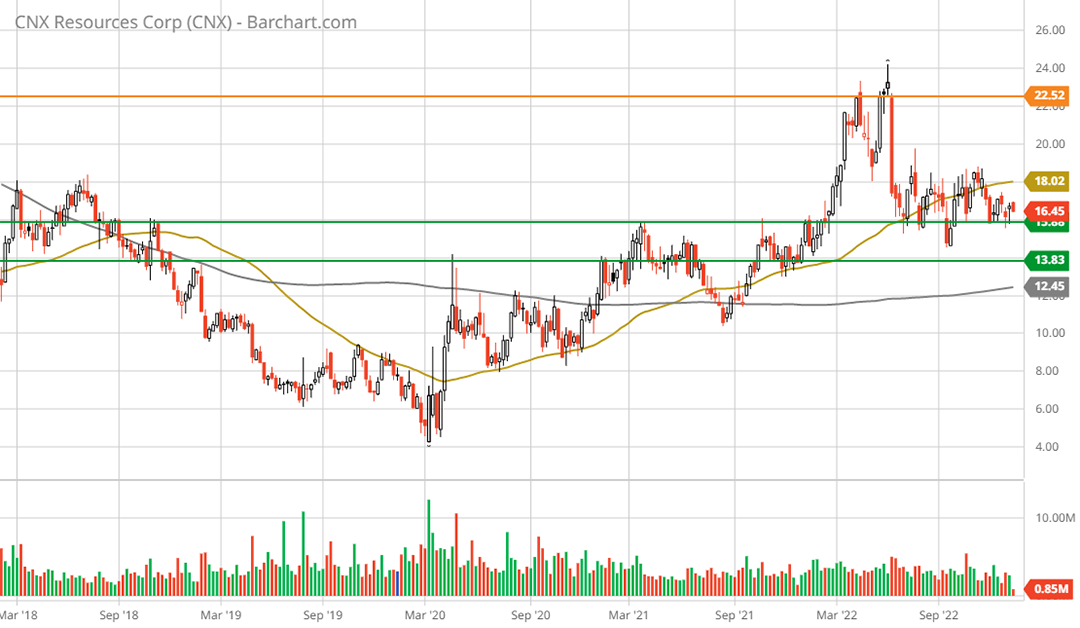
CNX Resources 5-year weekly chart. Created by Brian Kapp using a chart from Barchart.com
The green lines represent the support zone and the orange line is the nearest resistance level. Note that the gold line is the 50-week moving average and that the grey line is the 200-week moving average. A bullish golden cross occurred during the middle of 2021. The 20-year monthly chart below places the past five years in a longer-term context.
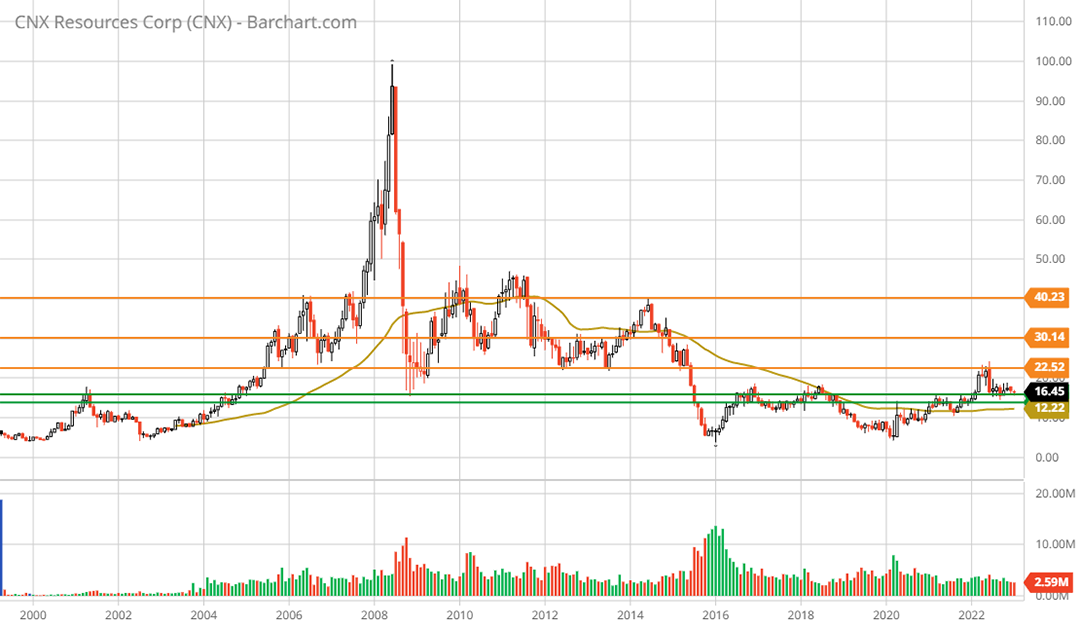
CNX Resources 20-year monthly chart. Created by Brian Kapp using a chart from Barchart.com
As stated earlier in this report, the attractiveness of small-cap value is similar to the valuation bubble top in 2000:
First, small-cap value offered initial starting conditions that were the opposite of the bubble valuations prevalent across the market-cap-weighted indices. They traded at deeply discounted valuations. Secondly, the economic cycle was shifting to a classic cyclical upturn rather than a resumption of the valuation-driven secular growth outperformance.
Summary
The initial conditions today are indeed similar to those following the last major valuation bubble. On the valuation front, 6x CNX’s 2023 and 2024 consensus estimates translates into a 16% earnings yield, while the company expects a free cash flow yield in the 24% to 36% range in the coming years. The technical targets above are well supported by the fundamentals, pointing to a positively skewed risk/reward spectrum of -18% to +143%, or $13.5 to $40 per share.
CNX Resources is a highly asymmetric risk/reward opportunity with high value, tangible asset support on the downside. It is a top small-cap value opportunity.
Price as of this report: $16.06
CNX Resources: Investor Relations Website