I am assigning Airbnb (NASDAQ: ABNB) a negative risk/reward rating based on its elevated valuation, rapidly decelerating revenue growth, and the downside asymmetry of its expected return profile. That being said, Airbnb is arguably the most dynamic investment opportunity in the travel and lodging industry. This should garner it a position on the watchlist of all growth stock investors.
Airbnb’s dynamic growth potential is complimented by the strong free cash flow generation capabilities embedded in its business model. The company’s cash flow potential is on full display through the first half of 2021 and is beginning to resemble that of past industry leaders such as Priceline, now part of Booking Holdings (NASDAQ: BKNG).
In this article I analyze Airbnb’s performance to date in order to uncover the primary trends in its business, before turning to the company’s valuation. The intent is to create a foundation on which an investment strategy for the shares may be built.
Risk/Reward Rating: Negative
Airbnb’s stock is largely unchanged since its first day of trading on December 20, 2020. The subdued performance of the shares thus far is the result of several divergent trends in the company’s business. These have been further clouded by the effects of COVID on the travel and lodging industry. Interestingly, COVID has affected Airbnb both positively and negatively, which is in stark contrast to the decidedly negative effects visited upon its travel industry peers.
Revenue Growth Trajectory
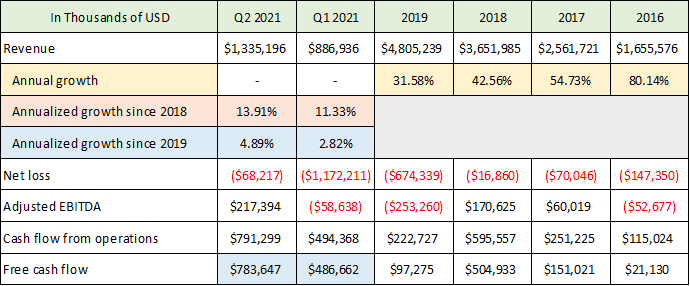
In order to understand the effects of COVID and the resulting volatile operating environment, we must place current trends in the context of Airbnb’s underlying growth trajectory. The following table was compiled from Airbnb’s Q2 2021 10-Q, Q1 2021 10-Q, 2020 10-K, and S-1 registration statement filed with the SEC. The table presents a summary of the company’s financial performance across its history of publicly available information. I have highlighted the pertinent data points to aid in understanding Airbnb’s underlying business trends.
Source: Created by Brian Kapp, stoxdox
The most crucial factor for Airbnb investors is the underlying revenue growth trajectory given the company’s status as a premier growth stock. I have highlighted the historic full year revenue growth in yellow, while excluding the large down year in 2020 resulting from the COVID pandemic. Removing the effects of COVID is critical to understanding the underlying trajectory of the business. While 32% revenue growth in 2019 is impressive, a consistent and materially slowing growth trajectory was well established leading into the COVID crisis of 2020.
In order to carry the growth trajectory into 2021, I have annualized the revenue growth rate through Q1 2021 and Q2 2021 for the preceding three years (highlighted in orange) and preceding two years (highlighted in blue). To clarify, the orange highlighted row depicts the three-year annualized revenue growth rates from Q1 2018 through Q1 2021 and from Q2 2018 through Q2 2021 (using only Q1 and Q2 2018 and 2021 data respectively). The two-year annualized growth rates are calculated similarly from Q1 2019 and Q2 2019 through Q1 2021 and Q2 2021, respectively.
Airbnb’s revenue growth has slowed substantially from 32% in 2019 to an annualized growth rate of 3% in Q1 2021, and 5% in Q2 2021 compared to the same period in 2019. It is likely that the lingering effects of COVID continue to weigh on revenue growth as 3% to 5% growth is well below what one would have projected looking forward from 2019.
Before providing more color on the revenue trends it is important to note that Airbnb’s free cash flow generation in Q1 and Q2 2021 has been impressive and is well above the historical trend line (final blue highlighted row). This is an encouraging trend change. The key question for forward-looking investors is whether the enhanced profitability in 2021 is a sustainable trend change. Or is it an artifact of underinvestment which is contributing to the rapid revenue growth slowdown?
Geographic Revenue Trends
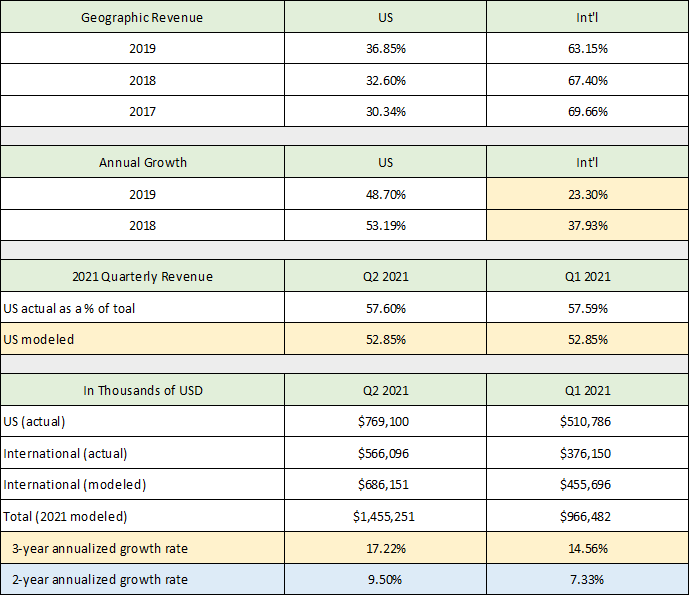
Returning to the underlying revenue trend, the 3% and 5% annualized growth rates in Q1 and Q2 2021 respectively do appear to be extremely low compared to the trend in place at the end of 2019 (32% and slowing materially). The source of the excess slowdown appears to be in the international markets. The following table was compiled from the same SEC filings used above. The upper two sections of the table present Airbnb’s geographic revenue breakdown through Q2 2021, and the revenue growth of each region through 2019. The lower two sections represent adjustments I have made in an attempt to understand the underlying revenue growth trajectory.
Source: Created by Brian Kapp, stoxdox
Surprisingly, international revenue historically has comprised the majority of Airbnb’s revenue. International sales accounted for 70% of revenue in 2017 and 63% of total revenue in 2019. The company’s oversized international revenue growth weighting was slowing rapidly prior to COVID, registering 23% growth in 2019 down from 38% in 2018 (first two yellow highlighted cells).
The geographic revenue mix shift from international to the US accelerated during COVID. In the first two quarters of 2021 US sales comprised 58% of total revenue (up from 37% in 2019). Airbnb’s revenue mix shift toward the US was a well-established trend prior to COVID, with the US growing at twice the rate of the international market in 2019. This material growth rate differential led to a rapid reversal in the geographic weighting of sales. That being said, the shift from 37% to 58% of sales appears too large given the preexisting trajectory.
To adjust for the possibility that international sales are still being more heavily impacted than the US, I have modeled the trends in existence at the end of 2019 through Q1 and Q2 of 2021. The results can be found in the first full yellow highlighted row (US modeled). Based on my estimates, it is probable that US sales would have accounted for roughly 53% of total sales in the first half of 2021 if not for COVID. The massive growth differential in 2019 with the US growing at twice the rate of the international markets coupled with international markets slowing rapidly in 2019 support this view.
Assuming that US sales would have accounted for 53% of total sales in the first half of 2021, I then calculated what international sales would have been in Q1 and Q2 2021 without the lingering COVID effects. The results of this estimation are in the last section of the above table. By my estimation $200 million of international revenue in the first two quarters of 2021 was lost due to COVID. Adding this estimation, I then model what total revenue would have been in Q1 and Q2 2021. Please keep in mind that this estimate is by its nature very uncertain. However, I believe it provides a better view of Airbnb’s underlying revenue growth rate than does the actual revenue results through the first half of 2021.
The final two highlighted rows summarize my best estimate of the underlying annual growth rate through Q1 and Q2 2021. The two-year annualized growth rate improves to 7% in Q1 2021 compared to the actual result of 3% shown in the first table. For Q2 2021, the annualized growth rate accelerates to 10% compared to the actual 5% growth rate shown in the first table.
Consensus Revenue Estimates
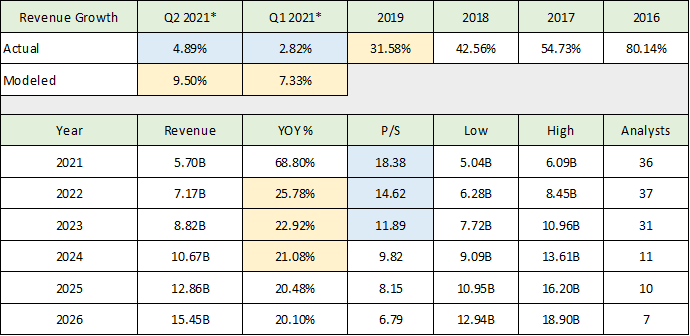
The estimated annual revenue growth trajectory of 7% to 10% through the first half of 2021 is a material improvement compared to the actual results of 3% to 5%. When placed alongside the 32% growth rate posted in 2019, this estimate still remains a significant deceleration. It places Airbnb well outside of what most investors would consider to be a premier growth stock. Please keep in mind that my best estimate of the current underlying revenue growth rate may still be low as the effects of COVID are exceedingly difficult to quantify. Viewing the consensus analyst expectations for Airbnb’s revenue growth will provide further clarity in determining what growth rates are currently priced into Airbnb’s share price. The following table was compiled from Seeking Alpha (consensus revenue estimates in the lower portion) with a summary from the above tables for reference (YOY=year-over-year, P/S=price-to-sales ratio).
Source: Created by Brian Kapp, stoxdox
The year-over-year consensus revenue growth estimate for 2021 is not meaningful as it is compared to a large revenue decline during COVID in 2020. Looking forward, I have highlighted current consensus revenue growth estimates in yellow in the lower portion of the table. For reference, I have highlighted my best estimate through Q1 and Q2 of 2021 and the actual growth rate for 2019 in yellow in the upper portion of the table. Actual results are highlighted in blue.
My estimate of Airbnb’s current growth rate is likely conservative once COVID fully recedes. That being said, consensus estimates of 26% to 21% for 2022 through 2024 appear to be overly aggressive in light of the decelerating trend to 32% in 2019 (following 43% in 2018 and 55% in 2017). When the actual results of 3% in Q1 2021 and 5% in Q2 2021 are added to the picture, there is a heightened risk of Airbnb’s revenue growth materially missing expectations through 2024.
I have highlighted the current price-to-sales valuation multiple in blue for the next three years. At 18x 2021 sales estimates, Airbnb is trading well outside of historical valuation norms for a $100 billion plus company. When the elevated valuation is combined with the heightened risk of expectations being materially too high, a volatile cocktail with extraordinary risk is created.
Key Business Metrics
In light of the acute revenue growth risks over the coming years, it is important to understand the dynamics driving Airbnb’s current business trends. The company reports key performance indicators to provide investors additional information regarding its underlying business trends. The primary measures are Nights and Experiences Booked (a unit sales measurement) and Gross Booking Value (a dollar sales measurement). The following table was compiled from the same SEC documents used thus far.
Source: Created by Brian Kapp, stoxdox
Please note that the annual growth rate displayed for Q1 2021 and Q2 2021 are annualized growth rates from the corresponding quarters in 2019 (the yellow and orange highlighted cells). While the blue highlighted cells are actual year-over-year growth rates in the average booking value per night compared to 2020. I use the actual year-over-year growth rate for booking value per night as it is a price per unit measurement and is thus unaffected by the large revenue decline resulting from COVID.
Nights and Experiences continued to post annualized contraction in Q1 and Q2 2021 compared to 2019. This suggests a much more negative view of Airbnb’s growth rate than the revenue growth rates discussed above. This key business indicator points toward greater risk to consensus revenue growth estimates than actual revenue trends (3% to 5%) or my higher estimate of the underlying revenue growth trends (between 7% and 10%).
Gross Booking Value on the other hand began to grow above revenue in Q2 2021, registering 17% growth. I would estimate that 17% revenue growth is a realistic estimate compared to the 32% posted in 2019 (within a rapid deceleration trajectory). The risk to this higher growth rate is that it is entirely the result of substantially higher prices per night against a backdrop of declining customers. Furthermore, the recent $160 per night pricing represents 41% and 34% price increases for Q2 and Q1 2021 respectively, which are well outside of historical norms. Airbnb’s average booking value per night historically has been very stable in the range of $110 to $117 through 2019.
This massive price increase is a material benefit that Airbnb has received from the COVID crisis. The substantial improvement in booking value per night has also been instrumental in Airbnb’s much improved cash flow generation through the first half of 2021. The key question for investors looking forward is whether this pricing shift is sustainable or merely a one-off as people rented larger properties in less densely populated areas to escape the cabin fever and risks associated with COVID.
To shed light on this question I provide a more granular look at this trend by quarter, beginning with the first confirmation of the higher-priced mix shift in Q3 2020. The following table is compiled from the same SEC documents used throughout this article. The Q3 2021* column is a rough estimate using the company’s broad guidance for Q3 2021 provided in the its Q2 8K 2021 earnings release.
Source: Created by Brian Kapp, stoxdox
I have highlighted the higher-priced unit trend in blue. The average price per night has been historically very stable at just 0.6% annual growth on average as can be seen in the last blue highlighted cell. When the initial shock of COVID subsided in Q2 2020, the average price per night began to skyrocket. It crested at 41% in Q2 2021 as the COVID crisis subsided with the vaccine rollout (the blue highlighted row). The company’s guidance for Q3 2021 was short on details but suggests the increased pricing trend is likely to be stable into Q3 2021, and then begin to recede as people return to more normalized rental patterns.
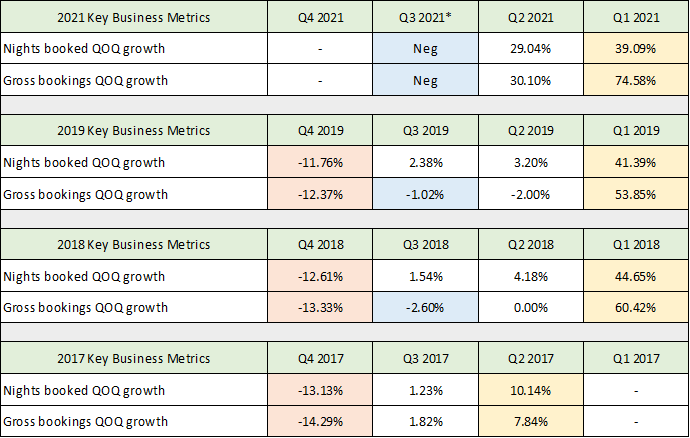
The guidance for unit volume (nights booked highlighted in yellow) is for a continued contraction compared to Q3 2019. This continues to be a negative factor in relation to the consensus revenue growth rates in the 26% to 21% range from 2022 to 2024. The Gross Booking Value appears likely to follow nights booked more closely after Q3 2021 given the likely peak in booking value per night. It should be noted that the company’s guidance for Q3 2021 is for sequential declines in nights booked and Gross Booking Value (quarter-over-quarter or QOQ). This guidance is in line with Airbnb’s historic seasonality as shown in the following table compiled from the same SEC documents.
Source: Created by Brian Kapp, stoxdox
I have highlighted the historically highest quarter-over-quarter growth in yellow and the lowest growth in orange. The negative sequential growth guidance for Q3 is confirmed to be a normal seasonal pattern and is highlighted in blue. This guidance suggests that the snap back from depressed travel due to COVID is subdued as it is not tracking above historic seasonal norms. The lack of growth outside of seasonal norms offers a cautionary signal in regard to consensus revenue growth estimates from 2022 to 2024.
Improved Profitability
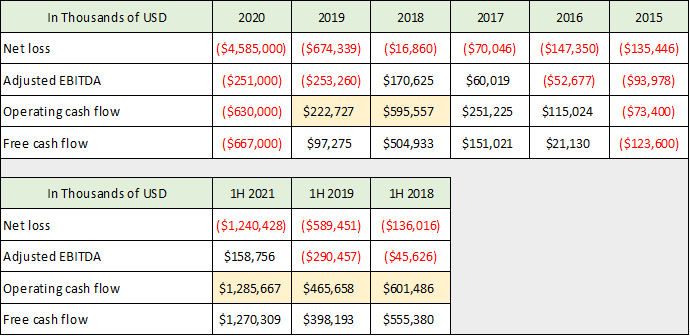
While the data clearly points toward risks to the revenue growth outlook for Airbnb, the substantially improved profitability so far in 2021 is a bright spot. The company has a history of large net income losses which has continued into 2021, with a large $1.2 billion loss in the first half. This follows a massive $4.6 billion loss in 2020. However, Airbnb’s cash flow generation points toward the potential for a vastly improved bottom line, as can be seen in the following table compiled from the same SEC filings. I have highlighted the pertinent cash flow details in yellow.
Source: Created by Brian Kapp, stoxdox
Airbnb has generated $1.3 billion of cash flow from operations in the first half of 2021. This is double the prior first half record of $601 million in 2018. This is a substantial level of cash flow from operations. It should be noted that the second half of the year normally features negative cash flow or cash flow breakeven results due to seasonality. If the first half of 2021 holds, Airbnb would be generating roughly $2 per share of cash flow from operations which would provide needed support to the company’s valuation level.
The key question for investors is the sustainability of this cash flow level. On the sustainability front, the jury remains out. The travel booking industry has a history of supporting substantial cash flow generation. However, the Airbnb model is decidedly different compared to its predecessors. This creates substantial uncertainty in using past performance of other companies as a model for Airbnb.
Sustainable Profitability
The primary difference between the business models of Airbnb and its successful competitors, is that Airbnb caters to much smaller hosts and destinations (such as sole proprietors). Competitors such as Booking have successfully catered to the broad travel industry with large operator hosts such as resorts and hotels. These large operator hosts exercise material operating and advertising budgets which companies like Booking are able to leverage for their own benefit.
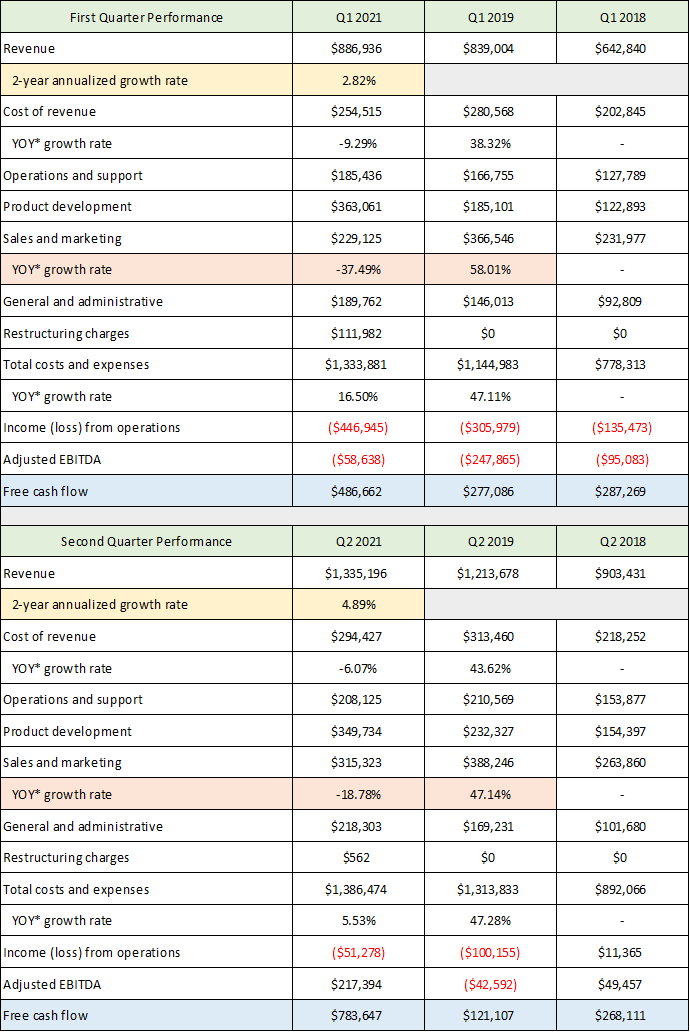
In the case of Airbnb, it is unclear what type of advertising and operating budget the company must sustain in order to support the growth of its smaller host operators. It is likely to be substantial compared to Airbnb’s broad travel predecessors. In the following two tables compiled from the same SEC filings, I highlight a key line item in orange for Q1 and Q2 of 2021 which speaks to the question of sustainable profitability levels. The remainder of the data is provided for reference.
Source: Created by Brian Kapp, stoxdox
Please note that the YOY* rows are year-over-year percentage changes for 2019 compared to 2018, and then 2021 compared to 2019 to remove the COVID effects. The 2021 growth rates are absolute changes versus 2019 rather than annualized. Sales and marketing expenditures were down an incredible 37% in Q1 2021 compared to Q1 2019 and were below Q1 2018. This contraction slowed materially in Q2 2021 to a 19% decline compared to 2019, while Q2 2021 grew compared to Q2 2018. Airbnb is ratcheting back sales and marketing support substantially in 2021.
This one expenditure reduction has added $210 million of cash flow from operations through the first half of 2021 compared to the same period of 2019. The slowing decline in sales and marketing expenditures in Q2 2021 suggests that this trend may be reversing. The relatively stagnant two-year annualized sales growth rates of 3% and 5% for Q1 and Q2 2021 respectively, may be a signal that Airbnb is underinvesting in sales and marketing. This will be an important relationship to monitor in future periods.
Valuation and Consensus Estimates
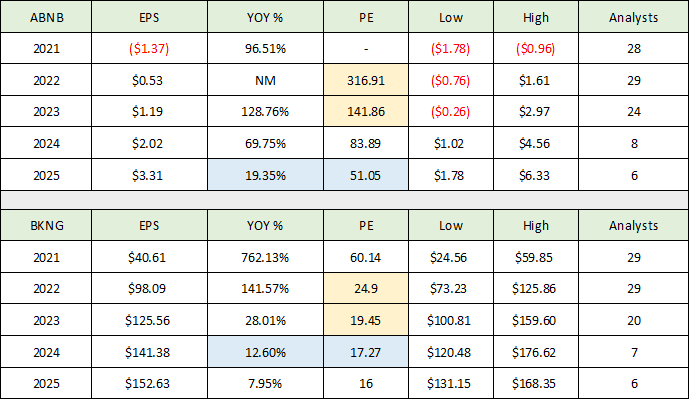
The substantial slowing of Airbnb’s revenue growth trajectory places heightened importance on the company’s valuation. It is critical to remember that the company’s rapidly slowing revenue growth has been held up by an enormous price per night increase. It grew an incredible 34% in Q1 2021 and 41% in Q2 2021, without which the growth trajectory would be materially worse. The pricing support is well outside of all historical norms which, when added to the continued contraction in nights booked, creates tremendous uncertainty for the Airbnb investment case. The risks emanating from the growth uncertainty are compounded by the company’s elevated valuation as can be seen in the following tables compiled from Seeking Alpha. I have stacked Airbnb’s consensus earnings estimates on top of Booking’s consensus earnings estimates to provide a view of both the absolute and relative valuation of Airbnb’s shares.
Source: Created by Brian Kapp, stoxdox
I have highlighted the PE (price-to-earnings ratio) of Airbnb and Booking for 2022 and 2023 in yellow for easy comparison. Airbnb trades at a substantial premium to Booking and to the overall market averages. The market averages are not shown here as Booking’s 2022 PE of 25x is in the ballpark of current market averages. I then highlight in blue the years in which the expected earnings growth rate of Airbnb and Booking are similar to compare the valuation multiples. In this case, the valuation multiple applied to Airbnb remains many times that of Booking’s.
Considering Airbnb’s uncertain growth trajectory and the fact that it is trading at an extreme absolute and relative valuation multiple, some expected return estimates are in order. In the lower portion of the above table, I apply various Booking valuation multiples to Airbnb’s earnings expectations in future years to achieve a range of potential return estimates. I have highlighted the high return estimate and low return estimate in yellow which range from negative 29% to negative 67%.
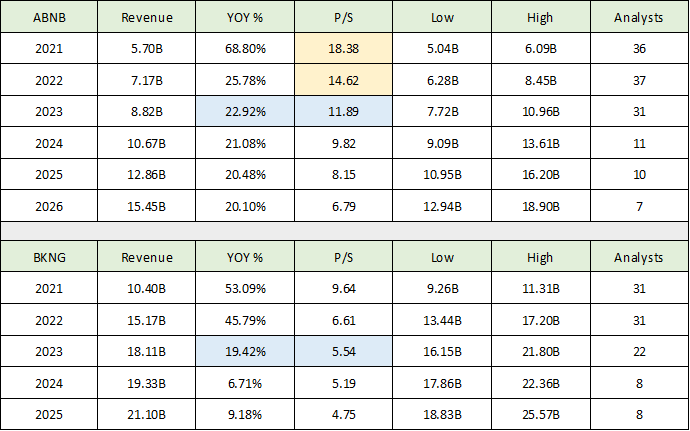
The highest return estimate is based on 60x the 2024 consensus earnings estimate for Airbnb, which is an aggressive valuation multiple and is well outside of historical market valuation norms. This looks to be the highest return expectation as things stand. I touched on the extreme revenue valuation multiple earlier and include the information below alongside the consensus revenue estimates for Booking as a reference point (the table is compiled from data provided by Seeking Alpha). Please note that I have highlighted 2023 in blue for both companies as the growth expectations are similar. Airbnb’s valuation multiple on 2023 revenue estimates is twice that of Booking’s.
Source: Created by Brian Kapp, stoxdox
Technicals
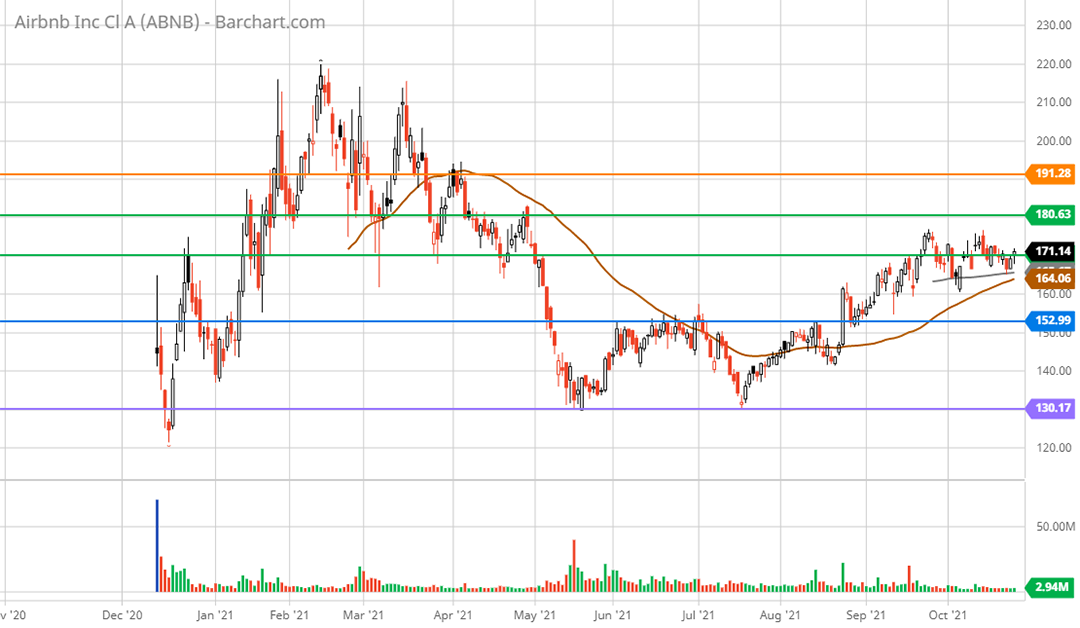
With limited upside potential based on fundamentals and valuation, the charts will provide further context for investors. Given that Airbnb has been trading for less than a year, technical analysis is somewhat limited. There are four well-defined support and resistance levels denoted by the horizontal lines on the 1-year daily chart below.
Airbnb 1-year daily chart. Created by Brian Kapp using a chart from Barchart.com
Airbnb is currently trading up to what should be very heavy resistance between the two green lines (I consider these two lines to be one resistance level). This area represents broken support throughout the topping process between January and April 2021. The orange line just above at $190 should provide strong resistance if the green zone can be overcome. The orange line represents 12% upside from current levels. The heavy overhead technical resistance supports the lack of upside potential from the fundamental analysis.
Nearest support is at the blue line near $152 and then the purple line near $130. The area near the blue line looks to be weak support as it was breached many times since April 2021 and offers little support from a valuation perspective. Support near $130 at the purple line should be firmer. It represents 24% downside from current levels and is close to the highest return estimated in the valuation section of negative 29%. There is an elevated risk that Airbnb will test lower levels for which there is no technical support given that $130 is near the all-time low.
Summary
The extreme valuation coupled with an uncertain and rapidly decelerating revenue growth trajectory creates downside return asymmetry for the shares at the current juncture. That being said, Airbnb is arguably the most dynamic investment opportunity in the travel and lodging industry today. The opportunity is made more enticing by the potential of the business model to generate outsized free cash flow, which can be used for accelerated growth or to enhance investor returns. As a result, all growth investors should have Airbnb on their watchlist in the event that an opportunity to accumulate the shares presents itself.
Price as of this report 10-27-21: $171.14
Airbnb Investor Relations Website: Airbnb Investor Relations


