Following on the heels of “Mind your duration,” I explore the broad implications for the stock market resulting from the interplay between duration risk and recession risk. As a reminder, while stocks do not technically have a measure of duration, the concept of duration risk is directly applicable to stocks. The following quote from “Mind your duration” sets the stage:
Similar to bonds, if the low end of long-term yields is anchored nearby, the dynamic creates the foundation for widespread risk/reward asymmetries across the stock market.
Stock Market “Duration”
Using the SPDR® S&P 500® ETF Trust (NYSE:SPY) as a proxy for the US stock market, we can begin to illuminate the concept of duration as it relates to stocks. In terms of duration, the primary difference between stocks and bonds is the degree of certainty regarding future cash flows. Bond cash flows are contractually well defined, while stock cash flows are highly uncertain.
Furthermore, the degree of uncertainty surrounding cash flows from stocks varies widely. For example, a blue chip consumer staples company such as Proctor & Gamble (NYSE:PG) is highly predictable compared to a consumer discretionary company such as Tesla (NASDAQ:TSLA).
The S&P 500
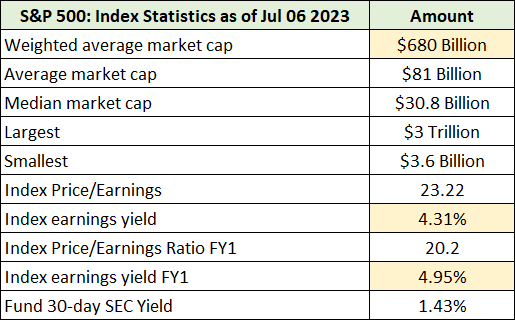
All else being equal, the uncertainty of future cash flows feeds directly into stock market valuations as investors generally seek to be compensated for the level of risk being taken. The level of uncertainty surrounding cash flows for a given company can be thought of as being relative to other stocks, such as a stock index like the S&P 500, and as being relative to the bond market, such as risk-free US Treasury bonds. Summary data for the S&P 500 index is provided in the following table, including highlighted key data points.
With a current earnings yield of 4.31%, the US stock market “yield” is on par with the 5-year US Treasury bond yield which stands at 4.27%. Of note, the stock market earnings yield is beneath all treasury yields out to five years. The yield curve inversion accounts for long-term Treasury yields being lower than the earnings yield on the S&P 500, at roughly 4% for the 10-year through 30-year Treasury bond market.
Equity Risk Premium
Given the risk-free return available on 10-year US Treasury bonds of 4.02%, and the 4.31% earnings yield reported for the S&P 500 index, we can calculate a crude estimate of the Equity Risk Premium, or ERP, to be 0.29%. If we use the forward earnings yield of 4.95%, the Equity Risk Premium is 0.93%.
Please note that one can use various inputs to calculate versions of the Equity Risk Premium. Here, I am using a simple definition as put forth by the Corporate Finance Institute: the rate of return on the stock market minus the risk-free rate.
This version of the ERP is somewhat over simplified and far from perfect as it does not capture future earnings growth. That said, given the actual cash flow yield of 1.43% on the SPY (the 30-day SEC yield in the above table), the lack of earnings growth factored into the ERP is counterbalanced by the lack of actual cash flow.
Depending on the earnings yields and Treasury bond yields chosen to define the ERP, it is in the range of roughly 0% to 1% today. For reference, according to Lisa Shalett, chief investment officer of Wealth Management at Morgan Stanley, the ERP for the US stock market has been in a range of 3% to 3.5% over the past two decades. Looking further back, Tony DeSpirito, chief investment officer of U.S. Fundamental Equities at BlackRock, reports that the S&P 500’s ERP has averaged 1.62% going back to the 1950s.
Taking a very long-term view, looking at the actual historical performance of US stocks versus 10-year Treasury bonds from 1792 through 2013, the realized equity risk premium averaged 3%. This is similar to Morgan Stanley’s estimate of the past two decades of 3% to 3.5%. Of note, the Equity Risk Premium is quite volatile within a range of slightly negative to the mid-teens.
“Duration” Risk
With an ERP in the range of 0% to 1% for the broad US equity market today, valuations are at the high end of the historical record, thus naturally exposing investors to above-average risk. For my purposes here, I refer to this valuation risk as “Market Risk” as opposed to the concept of “Duration Risk.”
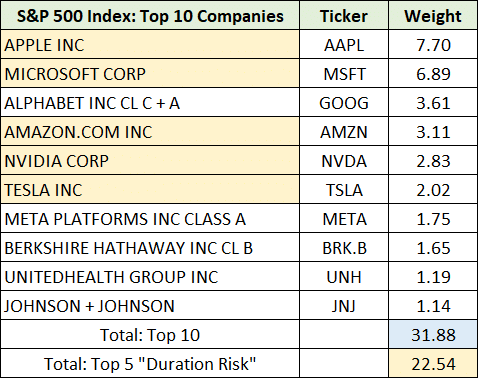
While the low ERP itself is likely embedding some “duration” risk given the yield curve inversion, we can illuminate purer “Duration Risk” by viewing the individual components of the S&P 500. As the top ten companies in the index account for 32% of the S&P 500, viewing the top ten is a sufficiently large sample. The following table displays the companies and their weightings in the SPY.
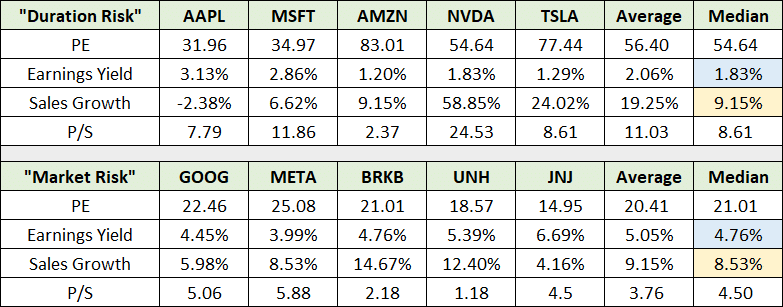
I have highlighted in yellow the five companies that I consider to be exposed to a material amount of pure duration risk. They account for roughly 23% of the S&P 500. In the following table, I separate the top ten into two groups: “Duration Risk” and “Market Risk” while providing key data for each group based on consensus sales and earnings estimates for the current year.
I have highlighted in blue the median earnings yield for each group and in yellow the median sales growth for the current year. The similar sales growth rates combined with the dispersion in earnings “yield” between the two groups reveals the extreme duration risk.
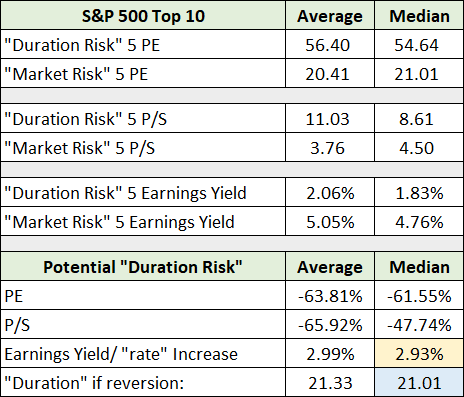
It should be noted that Nvidia’s sales growth rate is coming off a material contraction, while Tesla is at the tail end of a large capacity buildout. In other words, they are not sustainable growth rates. The following table provides a summary view of the top ten broken down into the two groups: “Duration Risk” and “Market Risk.”
The lower portion of the table displays the average and median return potential of the “Duration Risk” basket if valuations normalize to that of the “Market Risk” group. There is material risk in the “Duration Risk” group, which I would categorize as fairly pure duration risk.
Some may consider what I am referring to as pure duration risk as just another way of saying valuation risk. While true, viewing risk from an earnings “yield” or “duration” risk framework places stocks and bonds within the same construct. The duration construct thus enables clearer thinking regarding the interplay between recession risk (inverted yield curve) and duration risk, as well as the interplay between the stock and bond markets.
If valuations were to revert, as shown in the lower portion of the table above, the median earnings “yield” increase would be 2.93%. When combined with a potential return of -61.55%, the duration of the “Duration Risk” group can be thought of as 21 years. Recall that duration in the bond market is the expected percentage change in price resulting from a 1% change in rates.
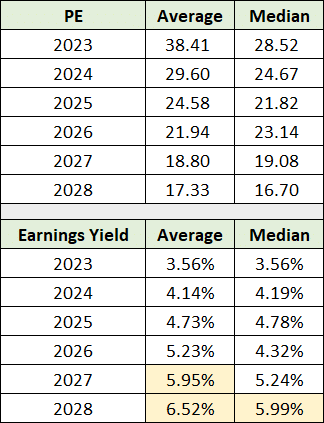
Furthermore, this estimate of potential duration risk can be thought of as separate and distinct from general equity market risk, which is on display in the “Market Risk” group. The following table displays the PE and earnings yield for the top ten companies combined through 2028.
Notice that the top ten companies in the S&P 500 are not expected to compete with and surpass the current 1-year Treasury bond yield of 5.4% until 2027 or 2028 (highlighted in yellow). Keep in mind that earnings estimates are likely to materially miss expectations in the 2027 and 2028 period, either up or down.
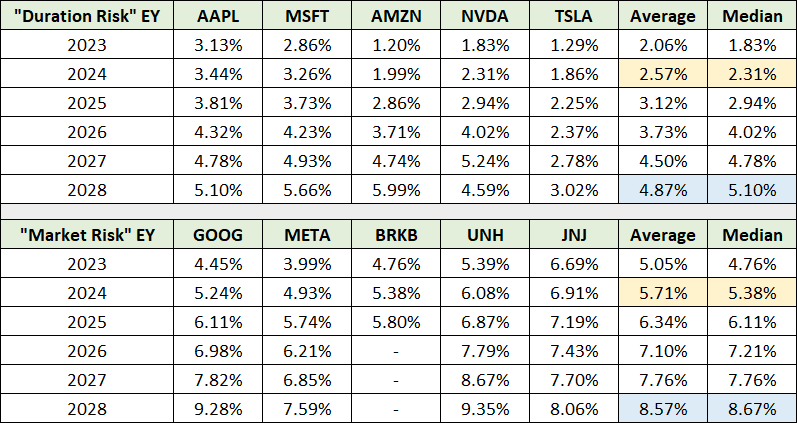
A detailed look at the earnings yield by year for the two groups through 2028 is provided below. I have highlighted pertinent comparisons between the two groups in 2024 and 2028. The earnings yield difference between the two groups in 2024, which persists through 2028 and beyond, illuminates the duration risk embedded in the “Duration Risk” group.
The dispersions between the two groups through 2028 highlights an underlying theme in the market-cap-weighted indices broadly, there is relative opportunity under the surface. In the above example, the “Duration Risk” group accounts for 23% of the S&P 500 index whereas the “Market Risk” group accounts for just 9%.
Given that 23% of the S&P 500 is trading at a median earnings yield of 1.83% based on current year consensus earnings estimates, it is difficult to envision a fundamental catalyst that will sustain a new bull market in the US market-cap-weighted indices. This is especially true when combined with a median sales growth estimate of only 9% for the current year.
Technicals
The technical backdrop mirrors the stretched fundamentals. In the April 29, 2023 report “The market is on a long and winding road” I described the technical setup as follows:
This is a brief market update as the market’s long and winding road back to the head and shoulders top is largely complete… As such, given the primary downtrend in place, the proximity to the primary resistance zone at the head and shoulders neckline remains the dominant technical force.
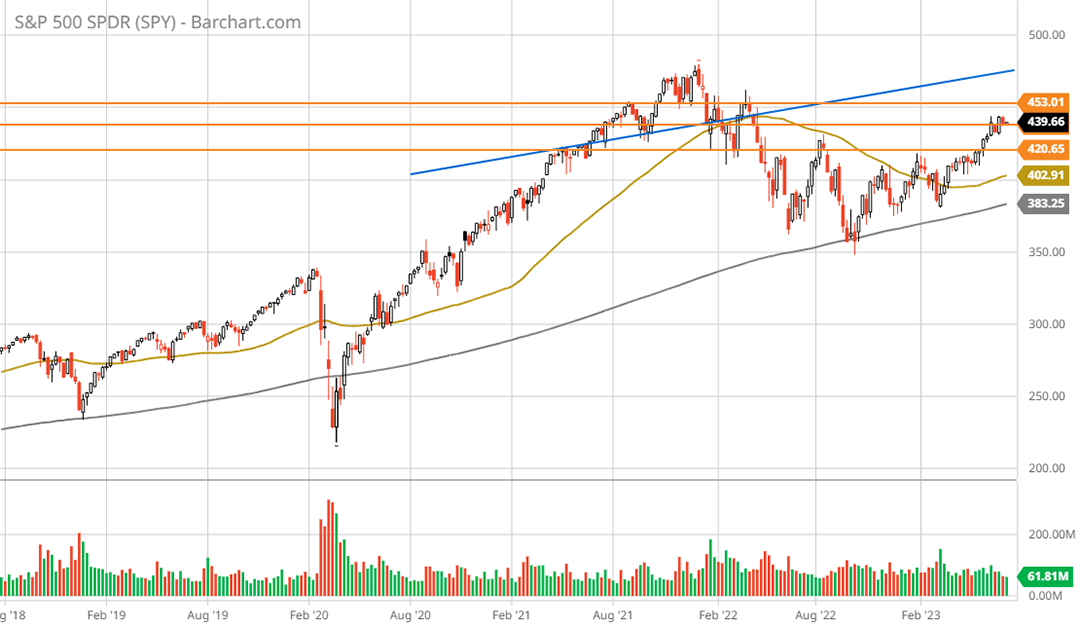
The head and shoulders neckline from the topping process of Q4 2021 and Q1 2022 is displayed by the blue line on the following 5-year weekly chart. Note that the primary resistance levels are denoted by the orange lines.
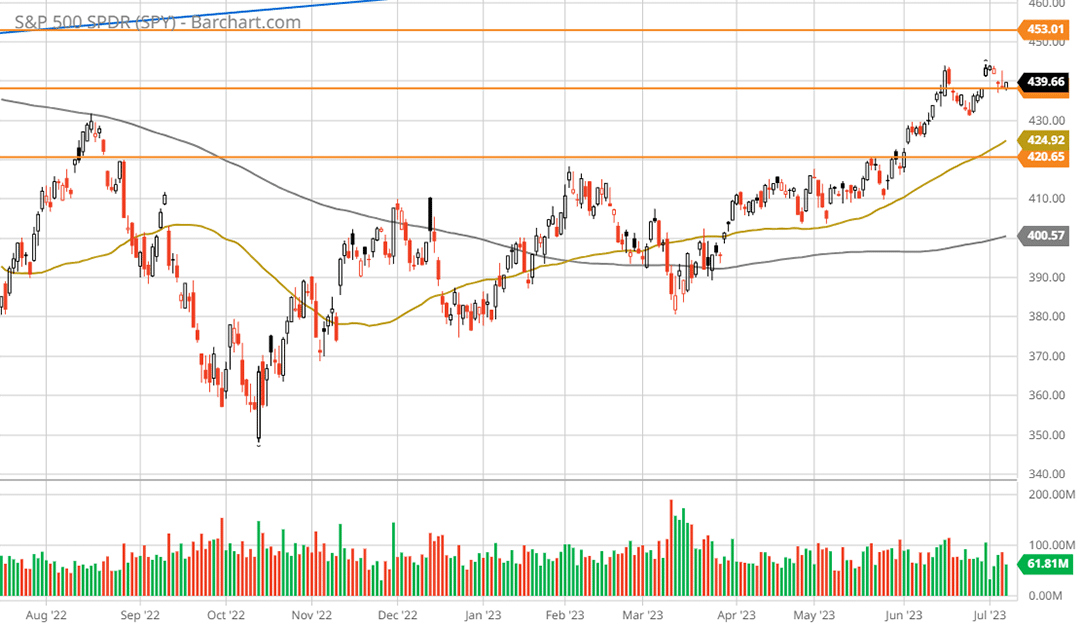
Since the April 29 report, the lowest orange resistance line has been breached from below, opening the door to a potential breakout from the bear market downtrend which began in January of 2022. The breakout attempt started on May 24, 2023. The following 2-year daily chart provides a closer look.
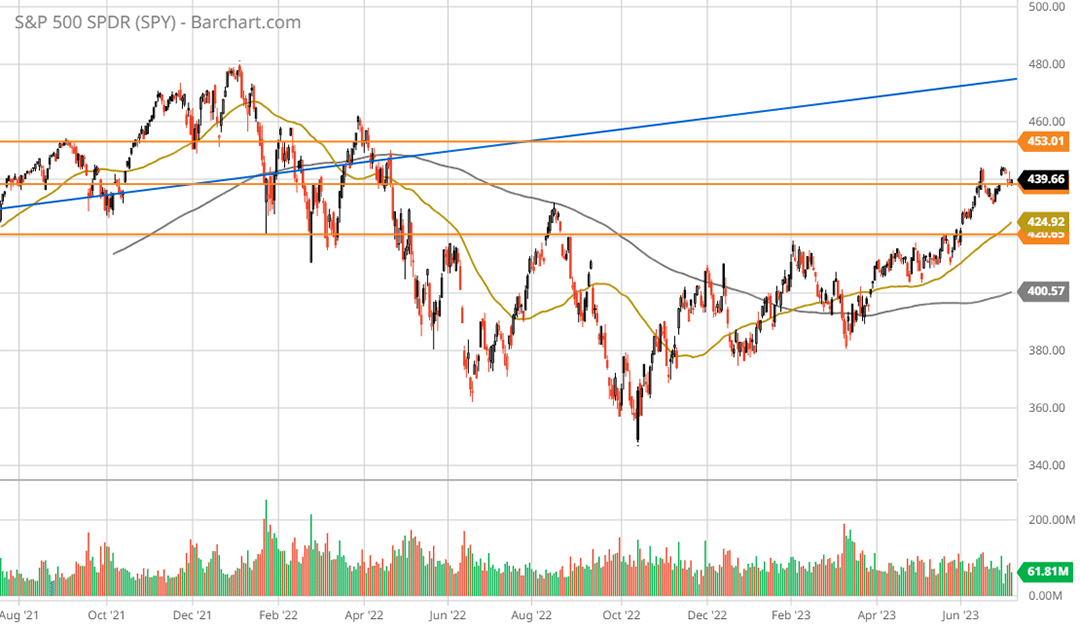
The SPY set a marginal new high compared to the rally high of August 16, 2022. That said, the trading pattern resembles a sideways consolidation as opposed to a new medium-term uptrend. In fact, prices have remained relatively unchanged over the past year as can be seen on the following 1-year daily chart.
What you will notice on the 1-year chart is that there were two distinct upward thrusts following the October 12, 2022 daily closing low near $356 per share. The first was from mid-October into the end of November 2022. This thrust captured 64% of the rally off the October 12, 2022 low to date. The second thrust began on May 24, 2023 and accounts for the remaining 36% of the rally.
Notice that the 50-day moving average (the gold line) is solidly above the 200-day moving average (the grey line). While this confirms the existence of a short-term uptrend, it does not speak to the existence of a new bull market given that the SPY is largely unchanged over the past year.
What we can say, technically speaking, is that we are in a short-term uptrend within a sideways consolidation. Furthermore, the sideways consolidation is occurring within the context of a bear market and has now reached a critical juncture at the prior head and shoulders top of Q4 2021 and Q2 2022.
Summary
Given the stretched fundamentals underlying the market-cap-weighted indices in the US, the case for a new bull market is on thin ice, fundamentally speaking. Technically speaking, with heavy overhead resistance at the head and shoulders top nearby, the technical setup remains tenuous as well.
As a result, the case for further consolidation and retests of lower prices looks to be a much higher probability outcome than a breakout to new all-time highs. This conclusion finds full support from the fundamental and technical backdrops discussed herein.
In terms of the stretched fundamentals and the extreme concentration of a few stocks in the US indices, it is worth considering the cause given the critical market juncture. The title of this report captures what I believe to be the underlying cause, classical conditioning, or Pavlovian conditioning.
In essence, Pavlovian conditioning refers to the process by which an automatic, conditioned response is paired with a specific stimulus. Pairing the extreme outperformance year to date by the mega-cap “tech” winners of the last cycle with today’s inverted yield curve, the conditioned response in 2023 begins to make sense.
The market has priced in a continuation of the conditions which have existed since the 2008 crisis: lower rates (the inverted yield curve) combined with lower equity “yields” (higher equity valuations). As discussed in “Mind your duration,” I view this to be at odds with the historical evidence and the most likely pathway forward.
In summary, if the low end of long-term yields is anchored nearby, the dynamic creates the foundation for widespread risk/reward asymmetries across the stock market. With limited upside potential in the market-cap-weighted indices, the risk/reward asymmetries can be found under the market-cap surface. I will cover these asymmetric opportunities within the construct of “duration” in the next report.


