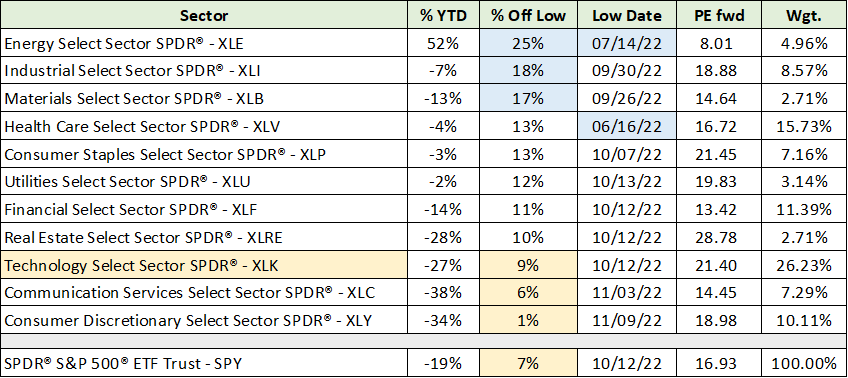
2022 was not kind to the technology sector as evidenced by the Technology Select Sector SPDR® Fund (NYSE:XLK) being down 27% year-to-date. Compared to the S&P 500 down 19% year-to-date, excluding dividends, the underperformance is material. The fund tracks the technology companies within the S&P 500 index, which account for over 26% of its total value.
Technology is by far the largest sector weighting in the S&P 500, the next being healthcare at just under 16%. Given its dominance in the US market indices, the outlook for the technology sector takes on added importance.
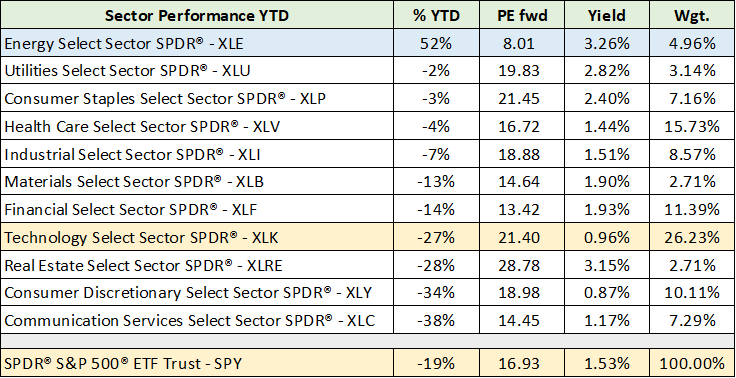
This is especially so as the opportunity costs in technology have been substantial through 2022 compared to most of the other sectors. The following table displays the performance of each of the eleven primary sectors within the S&P 500 index year-to-date, using the SPDR® S&P 500® ETF Trust (NYSE:SPY) as the proxy. It was compiled using data from State Street, its sector funds, and closing prices as of December 18, 2022.
The technology sector and the S&P 500 are highlighted in yellow for ease of comparison. Looking at valuations, technology is tied with consumer staples for the highest valuation, near 21.5x next year’s estimates for a 4.7% earnings yield. I exclude real estate as PE is not the relevant valuation metric for this group.
The opportunity cost is evidenced by the energy sector, which is highlighted in blue. I covered the positive outlook and likelihood of continued outperformance by the energy sector in several recent reports:
- “Relative opportunities in energy for 2023“
- “Is the sun setting on energy stocks?“
- “A top sector choice for the coming cycle“
Given the small weighting in the market indices at under 5%, energy sector outperformance has gone unnoticed for market cap-weighted investment portfolios. Outside of energy, the sector outperformance includes four of the eleven being down 7% or less.
Technology Sector: The Big Two
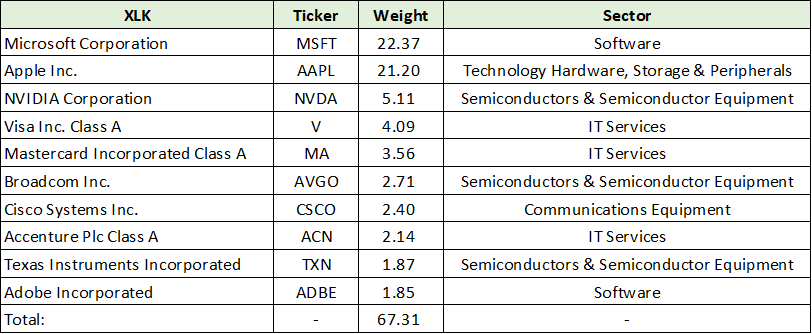
With the technology sector dominating the indices, it is notable that the sector is heavily weighted to just two companies. Apple (NASDAQ:AAPL) and Microsoft (NASDAQ:MSFT) together account for 44% of the total sector value. As a result, the outlook for the sector is largely tied to its two largest companies when using a market capitalization-weighted approach, such as the XLK. For greater context, the top ten companies and their weightings in the sector are displayed below.
One may be surprised to see Visa (NYSE:V) and Mastercard (NYSE:MA) in the top five list of the technology sector. Each is valued at a substantial premium to the market at 25x and 30x next year’s estimates, respectively. Nvidia (NASDAQ:NVDA) is valued at 42x. Rounding out the top five highlights the valuation maturity of the sector, especially considering the intermediate-term outlook.
Consensus Estimates
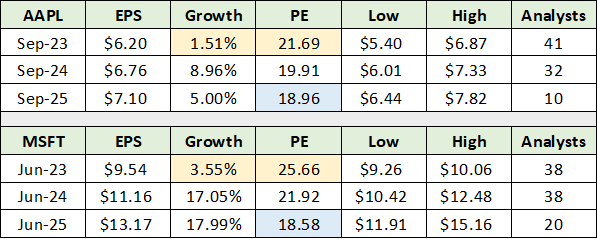
The following table displays consensus earnings estimates for Microsoft and Apple through mid-decade. The data was compiled from Seeking Alpha. I have highlighted the current fiscal year in yellow.
In essence, growth rates are no longer exceptional while valuations are still well above the market. It is difficult to be particularly bearish on the two, as most would agree that Apple and Microsoft are premium companies. That said, the markets are undergoing a phase change which features an expanding opportunity set. The following consensus forecasts for Schlumberger from “Is the sun setting on energy stocks?” offers a glimpse into the increasingly competitive sector opportunities.
Compared to Apple and Microsoft, Schlumberger looks like a dynamic growth company into mid-decade. Another example in the energy sector, from the September 7 report “CNX Resources: The Saudi Arabia of natural gas,” highlights the diversity of the opportunity set.
The energy examples illuminate the diverse opportunities available to investors as we traverse the current phase change in the markets. The following quote from Oaktree’s Co-Chairman Howard Mark’s December 13 investor letter, “Sea Change,” offers his 53 years of experience and context for reviewing the relative attractiveness of today’s opportunity set.
…the environment is and may continue to be very different from what it was over the last 13 years – and most of the last 40 years… investment strategies that worked best over those periods may not be the ones that outperform in the years ahead.
The Drought
A defining feature of market cycles is sector leadership changes. The largest bull market in history ended in January 2022 and it was led by the technology sector. From a cycle perspective, it would be unusual and even unnatural for the technology sector to lead the next cycle. While qualitative in nature, there is reason to believe that the sector will face relative headwinds.
There are many similarities between the recently ended tech-led cycle and that which culminated in the 2000 dotcom peak. One such similarity that may be underappreciated today is the high-powered nature of capital flows in the tech sector in each instance.
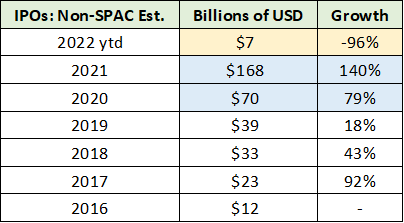
The following table displays the estimated value of funds raised via IPOs in recent years, excluding SPACs and other non-operating companies. Note that the 2016 through 2019 data was compiled from Jay R. Ritter, and the 2020 through 2022 data was compiled from FactSet and Nasdaq.
I have highlighted 2020 and 2021 in blue, in which a combined $238 billion was raised. While it is unknowable, a material amount of this capital likely found its way into technology budgets. This is especially true given the nature of the IPO market during the 2020 and 2021 period. For example, companies like Airbnb (NASDAQ:ABNB), Palantir (NYSE:PLTR), and Coinbase (NASDAQ:COIN) invest most heavily in technology.
Notice that capital flows have all but evaporated in 2022, which is highlighted in yellow. This collapse alone may be sufficient to cause material downside surprises throughout the technology sector as 2023 unfolds. Technology budgets in 2021 and 2022 were set against the backdrop of a $238 billion capital influx from the IPO market alone. The feed through to technology spending was likely substantial.
Technology budgets for 2023 and into 2024 will be set against a backdrop of $7 billion raised from the IPO market year-to-date in 2022. A similar contraction can be found across the broad capital markets, including steep declines in venture capital, private equity, and the bond market generally.
The contraction in capital markets is occurring in sync with an unfolding recessionary backdrop for the broad economy. This will put further pressure on technology budgets as profits are coming under increasing pressure. I covered the unfolding recessionary environment in the following reports:
Given the negative macro-economic developments looking into 2023, the rapid growth rate of technology budgets in 2020 and 2021 creates a heightened risk of negative surprises. A cursory glance at capital expenditures by Meta (NASDAQ:META) and Amazon (NASDAQ:AMZN) captures the scale of the recent investment cycle.
Compared to its 2019 capex level of just under $17 billion, Amazon’s capital expenditures during 2020, 2021, and 2022 are remarkable in comparison. Amazon’s capex came in at $40 billion, $61 billion, and $59 billion (Q3 2022 trailing twelve months) for each year, respectively. The increase over 2019 for each of the past three years has been 138%, 262%, and 250%. It is reasonable to expect a material deceleration or reduction in the coming years.
Meta’s investment growth has also been extraordinary, though less than Amazon’s. The company’s capital expenditures in 2022 are on track to reach $30 billion compared to $15 billion in 2019, a 100% increase. Amazon and Meta are just two companies which together are spending nearly $60 billion more on capex annually compared to 2019. Furthermore, these spending patterns are broadly representative of industry trends.
When the capital market collapse is combined with recessionary conditions and elevated technology spending since 2019, there is a heightened risk of downside surprises. The market may be signaling that this risk is likely to materialize as 2023 unfolds. Evidence is on display in the following performance table from earlier which now includes “% Off Low” and “Low Date” columns.
The low date is the low price reached during 2022, excluding energy for which it is the recent correction low given it is higher year-to-date. I have highlighted in yellow the weakest sectors coming off the 2022 bottom. Given the large year-to-date declines for these sectors (the % YTD column), the weakness of the bounce is a bearish signal entering 2023. It is worth noting that January is known for technical bounces as tax loss selling abates. Regardless, the message of the market is not bullish.
I have highlighted in blue the two sectors that bottomed first in the mid-year timeframe (Low Date). These are by definition leaders in the current cycle. Of note, highlighted in blue, industrials and materials bottomed before the remaining seven sectors, while outperforming materially. This points to possible leadership for these sectors looking into 2023.
As a result, I will cover the outlook for the materials and industrial sectors in coming updates. The sectors offer an attractive opportunity set as covered in the following reports:
- “Gold is on the efficient frontier”
- “Eastman Chemical is entering a bull market”
- “Top commodities for the energy transition”
- “Freeport McMoRan, Doctor Copper makes a house call”
- “BWX Technologies is a perfect recession stock”
- “Rio Tinto is a perfect portfolio diversifier”
Technicals
With the technology sector underperforming and lagging badly off the 2022 lows, the technical backdrop remains quite bearish. The well-defined downtrend is clearly visible on the following 1-year daily chart. Note that the green line represents a key technical support level, while the gold line is the 50-period moving average and the grey line is the 200-period moving average.
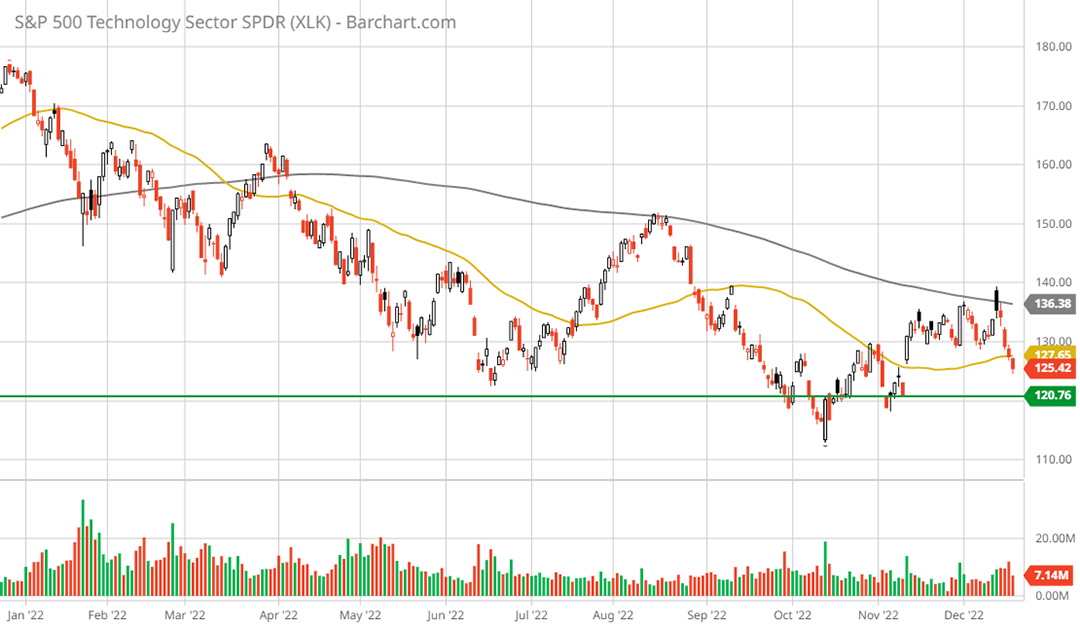
Technology Select Sector SPDR® Fund XLK 1-year daily chart. Created by Brian Kapp using a chart from Barchart.com
Notice that the XLK has been rejected at the 200-day moving average on three separate occasions throughout 2022. This is textbook bear market price behavior. Interestingly, the downside momentum ended in June 2022, followed by a choppy trading range which saw marginal new lows in October. The 5-year weekly chart below provides added context for the downtrend.
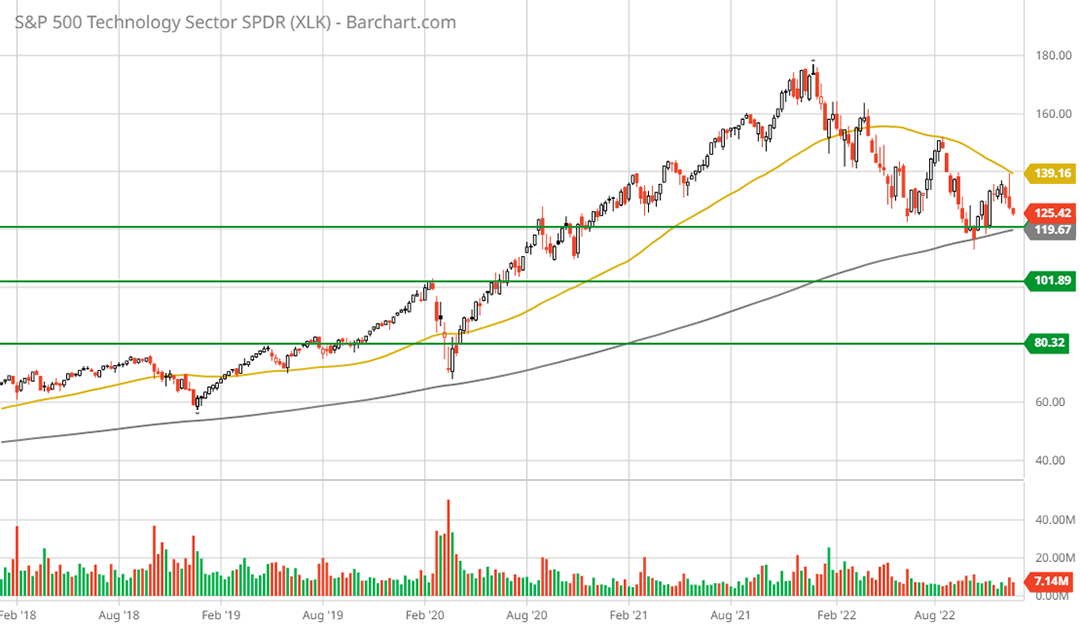
Technology Select Sector SPDR® Fund XLK 5-year weekly chart. Created by Brian Kapp using a chart from Barchart.com
Notice that the XLK is currently testing support at the upper support level (top green line) near $120. This happens to coincide with the 200-week moving average (the grey line). The next support level is 20% lower near $100 per share, which is also the pre-COVID top. With the weakness of the recent bounce and the challenging outlook into 2023, this level could be tested and represents 25% downside potential.
The lower support level near $80 was resistance during 2019 and cannot be ruled out. The zone was undercut during the COVID lows of March 2020. The following 20-year monthly chart places all three support levels into historic context.
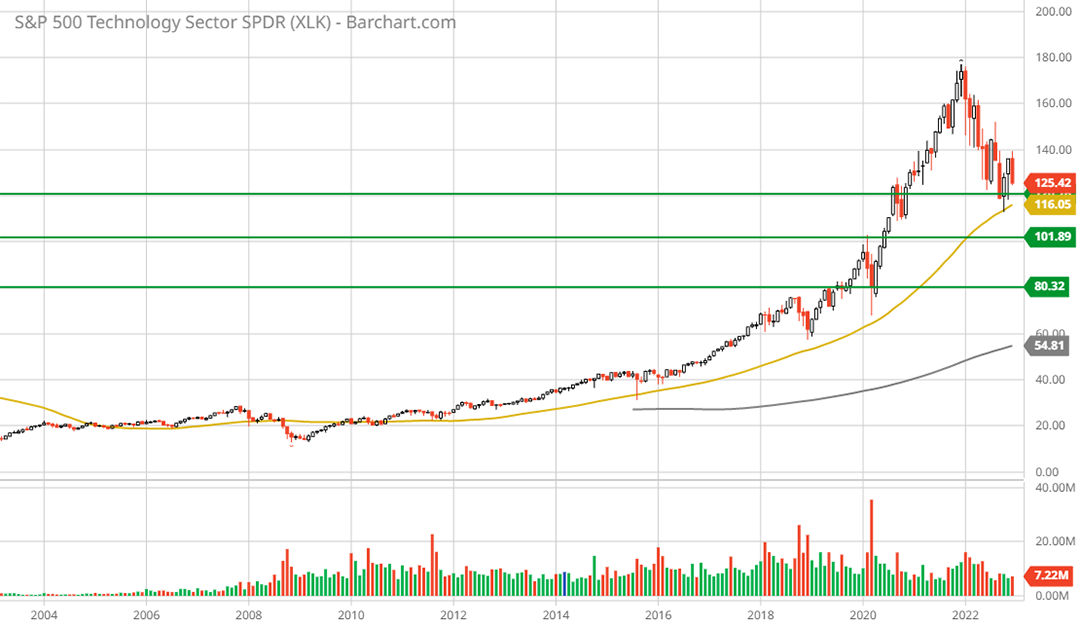
Technology Select Sector SPDR® Fund XLK 20-year monthly chart. Created by Brian Kapp using a chart from Barchart.com
On the left side of the chart, notice that the technology sector traded substantially below its 50-month moving average (the gold line) following the 2000 dotcom top. The sector did not sustainably trade above the 50-month moving average again until 2012. This serves as a reminder of the time dimension possibilities and not as a forecast.
Technically speaking, the XLK remains in a downtrend.
Summary
The bearish technicals, heightened growth uncertainty, and premium valuations combine to create a neutral risk/reward situation. From a portfolio perspective, the market cap-weighted technology sector is relatively unattractive compared to others. Like the energy sector, a more equal-weighted or active portfolio strategy is likely to offer a greater risk/reward opportunity over the intermediate term.


