
I am assigning Freeport McMoRan (NYSE:FCX) a positive risk/reward rating based on the bullish outlook for copper into the 2030s, Freeport’s discounted valuation, its leading industry position, and its proximity to strong long-term support levels.
Risk/Reward Rating: Positive
Freeport McMoRan has sold off an incredible -47% in only three months. What is most interesting is that the extraordinary velocity of the share price decline was in response to foreseeable developments on the copper supply and demand front. In my June 3 Rio Tinto report (NYSE:RIO) I made the following observation on the likely near-term potential for the price of copper as supply catches up with demand in the short term.
…investors should be prepared for a possible test of the $3.50 to $3.90 range. If this were to occur, it would likely create material downside volatility for copper stocks and represent an excellent entry point for investors looking to accumulate shares.
I made the following observation regarding Freeport’s likely share price reaction (emphasis added).
…a copper bellwether like Freeport McMoRan would likely selloff materially in a near-term copper correction… The copper case for Rio Tinto is all about its future growth plans which are well aligned with the potential for supply shortfalls toward mid-decade.
While I expected Freeport to selloff materially, -47% is extreme as it is near the lower end of Freeport’s technical potential (as we will see later). For context, Ivanhoe Mines (OTCQX: IVPAF) is a much riskier copper miner and it sold off a similar amount as Freeport. One would expect Freeport to carry a quality/safety premium to Ivanhoe and much of the mining industry. This relative pricing dynamic supports the view that Freeport’s selloff has been extreme.
The second bolded phrase in the above quote pertaining to Rio Tinto’s copper growth potential gets to the heart of the Freeport investment case: secular demand growth and tight supply conditions. Supply potential is well understood given the long lead time for new mine development and the known geological realities. As a result, demand is the dynamic variable driving the bullish case for copper and thus Freeport.
China
When it comes to copper, China ultimately determines market conditions given that it accounts for roughly 50% of global demand. For a sense of China’s future demand growth potential, the following image from a recent Canary Media article highlights its massive energy transition plans.
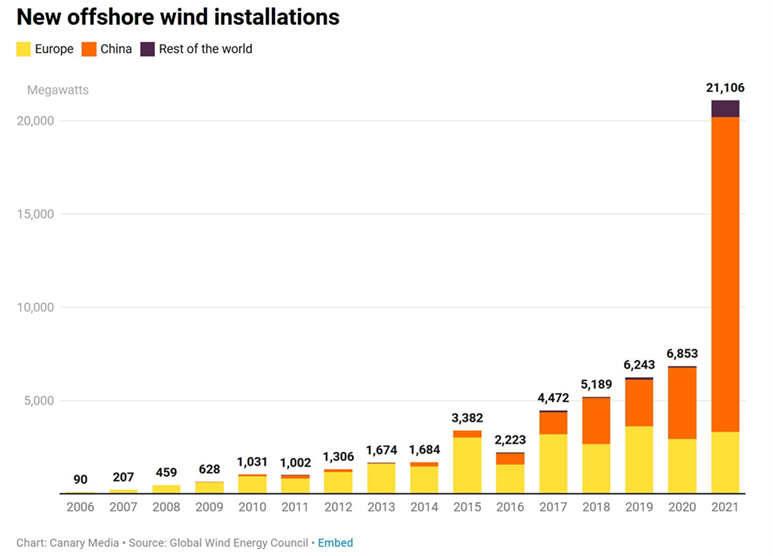
Source: Canary Media
For perspective on Chinese renewable power demand for commodities generally, the following quote is from my January Rio Tinto report and pertains to wind power.
Steel will play an important role in all renewables, including and especially solar and wind. Each new MW of solar power requires between 35 to 45 tons of steel, and each new MW of wind power requires 120 to 180 tons of steel.
While the above image speaks directly to steel demand growth from wind installations, copper is the ultimate enabling metal in generating and connecting renewable energy infrastructure into the global economy. China is in full top-down control of its long and massive energy transition plan. This creates high visibility into future demand growth. The energy transition vector should offer exceptional growth for copper demand into the foreseeable future, both in China and across the globe.
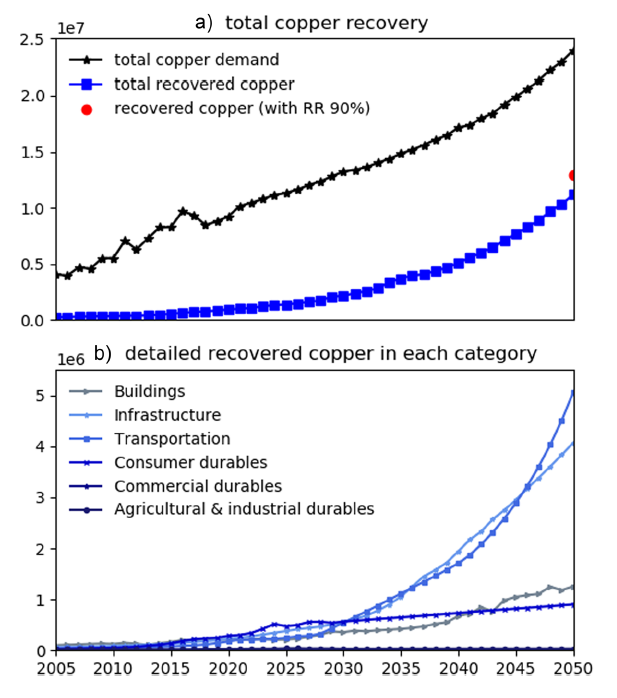
The primary demand-side fear in the market emanates from China’s real estate correction, which has been material and is ongoing. Interestingly, real estate is projected to account for only 5-10% of China’s copper demand over the coming decades. This can be seen in the following chart from a study published by Wiley in the Journal of Industrial Ecology. Forecasted real estate copper demand is represented by the grey area (Buildings).
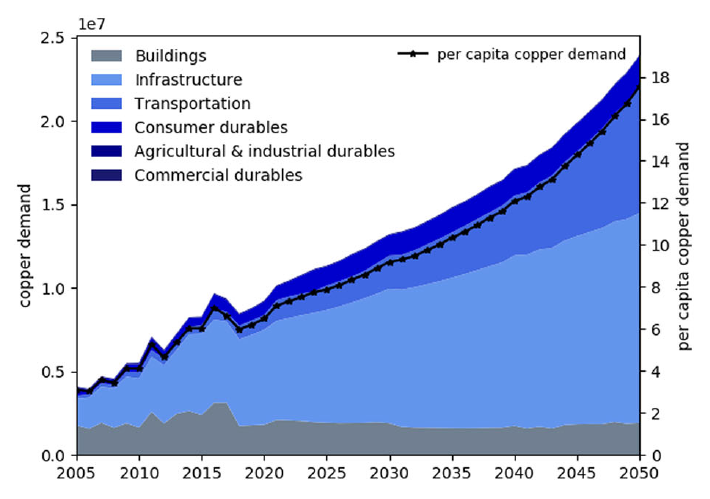
Source: Wiley’s Journal of Industrial Ecology
In fact, the Chinese real estate top is in the rearview mirror from a copper demand perspective. This can be seen in the grey section above and in the detailed Buildings category breakout below. Please note that the left-hand side vertical axis scale on each chart may differ. On the summary chart above and on the final Infrastructure chart below, 2.0 on the vertical scale equates to 20 million tonnes of copper (1e7 on the left axis). Conversely, in the first three charts to follow below, 2.0 would equate to 2 million tonnes of copper (1e6 on the left axis).
Chinese Real Estate: Copper Demand Forecast
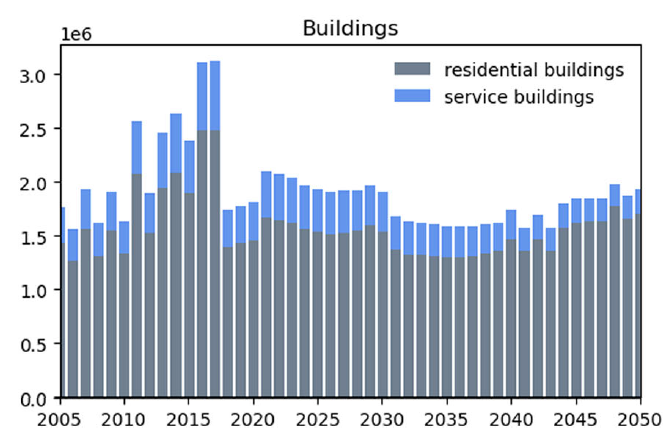
Source: Wiley’s Journal of Industrial Ecology
Notice that copper demand for Chinese real estate decelerated rapidly in the 2017 to 2020 period. Infrastructure, transportation, and consumer durables are now the dominant forces behind Chinese copper demand growth. These forces alone account for an estimated 80-90% of future Chinese copper demand. Projections for each of the three segments driving copper demand growth are provided below with a brief comment following each chart.
Chinese Transportation: Copper Demand Forecast
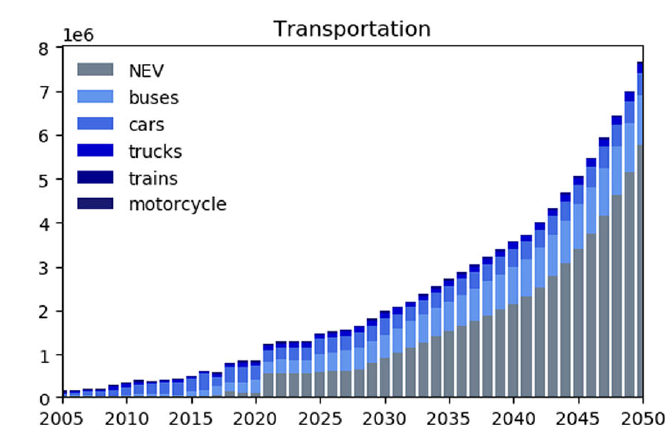
Source: Wiley’s Journal of Industrial Ecology
Notice that transportation demand was expected to reach a step change higher in 2021 at the time of this study in 2019. The step change higher has in fact occurred, not just in China but across the globe. What is notable is that transportation demand is projected to be relatively stagnant through mid-decade, which is likely to prove quite conservative if copper supply materializes to support growth. Transportation alone is projected to consume over 5x as much copper per year as real estate by the end of the forecast period.
Chinese Consumer Durables: Copper Demand Forecast
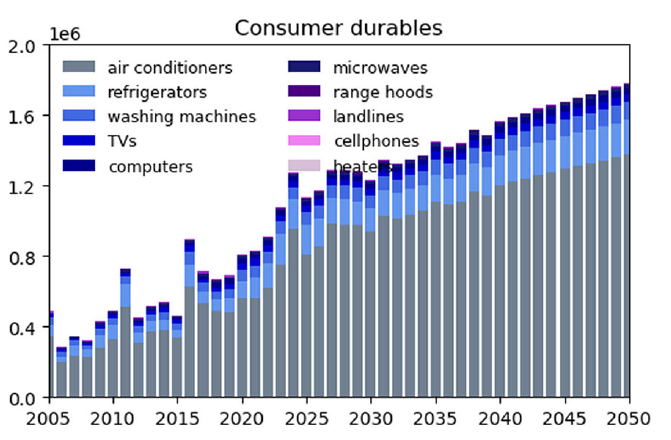
Source: Wiley’s Journal of Industrial Ecology
Consumer durable product demand in China is expected to generate exceptional copper demand growth throughout the forecast period. This growth vector should offer upside surprise potential given China’s low per capita copper consumption, which is estimated to be half that of other industrialized countries (such as Japan and South Korea).
Chinese Infrastructure: Copper Demand Forecast
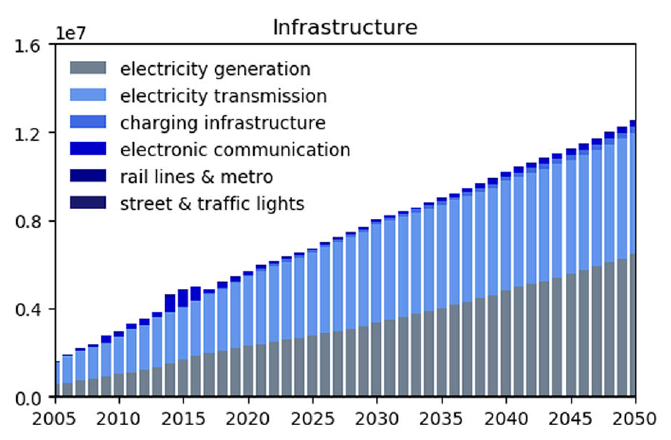
Source: Wiley’s Journal of Industrial Ecology
Finally, infrastructure is expected to account for 50% of total Chinese copper demand. This looks to be an exceedingly high-visibility growth channel as highlighted in the wind power installation image at the beginning of this section. Recent news flow confirms infrastructure to be China’s primary growth engine both today and into the future. The following quote from a major Chinese news organization, South China Morning Post, highlights China’s infrastructure growth intentions (emphasis added).
China is racing against time to rescue its coronavirus-hit economy with a renewed push of debt-fueled infrastructure investment after its local governments set a record for bond issuance in June.
To wrap things up on the key Chinese demand question, the following image displays China’s forecasted copper recycling capacity. Given that copper is reusable, the lack of recycling potential until the middle to latter half of the 2030s further supports extremely bullish supply/demand conditions over the foreseeable future. Please note the vertical scale differences in the next image.
Source: Wiley’s Journal of Industrial Ecology
Global Growth Opportunity
While global infrastructure growth and the energy transition are highly likely to feature China at the core of demand, the fundamental trends underlying the above Chinese copper demand projections apply broadly across the globe. The following table from Citi Research’s Copper Book: 2021-2030 Outlook from my January Rio article highlights the growth opportunity for industrial metals resulting from the global energy transition and the opportunity for copper in particular.
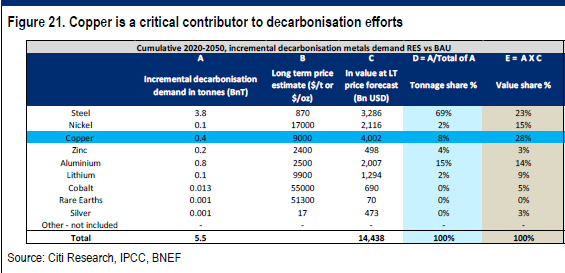
Source: Citi Research’s Copper Book: 2021-2030 Outlook
The most important columns are the final two on the right. Copper is highlighted in blue. Notice that copper is projected to account for 28% of the total value of incremental metals demand resulting from decarbonization plans through 2050. The profit potential is highlighted by the fact that copper accounts for only 8% of the expected incremental tonnage demand growth.
Please keep in mind that these estimates are for incremental demand from decarbonization between 2020 and 2050. This is in addition to baseline demand which closely tracks global GDP growth. Citi estimates incremental copper demand over the coming thirty years to be near 0.4 billion tonnes (column A).
This level of incremental demand over thirty years would average 13.3 million tonnes of additional copper demand per year. For reference, global copper demand is currently in the neighborhood of 21 million tonnes per year.
I view the Citi incremental copper demand estimate as reflecting the desired level of energy transition to be achieved by global leaders and institutions. Meaning, I view global policy initiatives as unequivocally supporting an energy transition to be implemented as quickly as is practical given the realities of supply constraints.
For example, the United States fully intended to implement a Build Back Better infrastructure investment plan under the Biden administration, which would have incentivized renewable energy production and usage. These plans were thwarted by the inflationary effects of supply chain constraints for critical raw materials, including copper.
The following Wood Mackenzie chart from a recent Kitco article illuminates the desired energy transition trajectory and the realities of current supply chain constraints. I view the desired global transition pathway as being captured well by the Accelerated Energy Transition or AET-2 line in the chart.
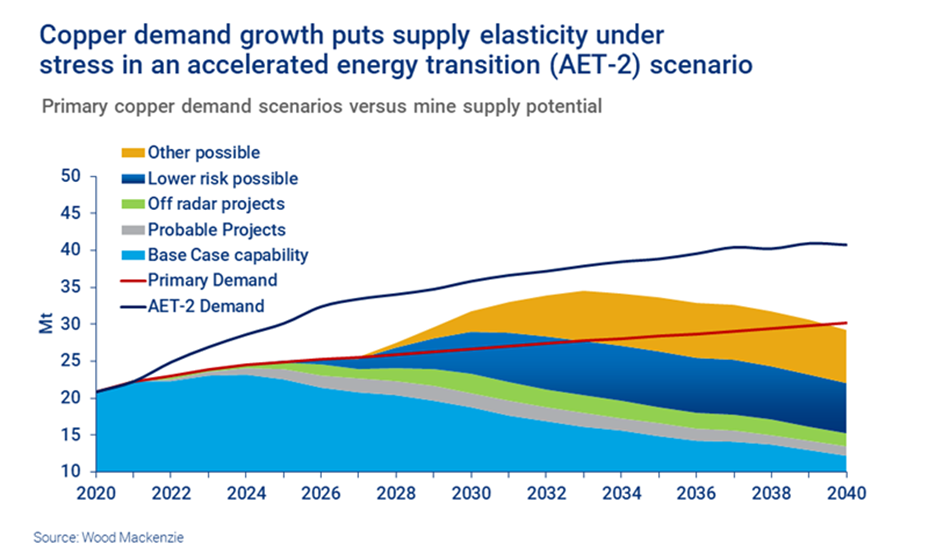
Source: Wood Mackenzie
Notice that the AET-2 line equates to roughly 13.3 million tonnes of additional copper demand per year in the 2026 to 2028 time period and onward, as was suggested by Citi’s incremental demand estimates. As a result of the energy transition, it is highly likely that global policy initiatives will exert material upward pressure on copper supply well into the foreseeable future.
The energy transition is clearly the top global priority. As a result, the energy transition should support a strong copper price environment which is required to incentivize a substantial increase in copper supply. Higher prices are required given the extraordinary risks and time frames involved in bringing new copper mines online and into full multi-decade production. In fact, the current supply shortfall in relation to the desired energy transition pace is largely due to the depressed price of copper in recent times.
Copper Technicals
The technical price action in copper highlights the depressed pricing environment since the 2006-2011 peak. While pricing has been depressed for some time thus limiting new supply growth, the long-term sideways price action has formed what should be an exceedingly strong support base for the future. This is especially the case given the aforementioned excess demand emanating from the energy transition. The following 20-year monthly chart speaks to copper’s long-term support levels.
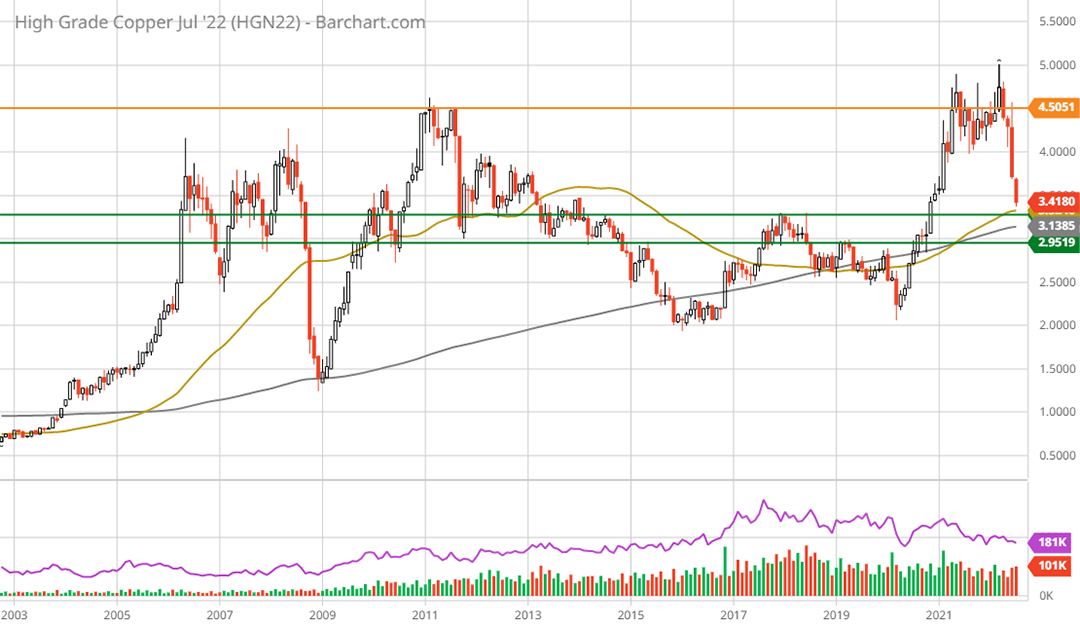
Copper 20-year monthly chart. Created by Brian Kapp using a chart from Barchart.com
Notice that copper carved out a large topping pattern with extreme volatility in the 2006 to 2011 time period. The rapid price runup into 2006 and subsequent peak in 2011 was primarily driven by Chinese demand, which roughly doubled between 2006 and 2016.
The subsequent demand deceleration mid-decade caused by China’s real estate correction (Buildings in the previous charts) is clearly visible in the chart above. The price of copper sold off in advance of this major Chinese deceleration and bottomed coincident with the reduced Chinese demand between 2015 and 2019. The following 10-year monthly chart begins to place the current trend in context.
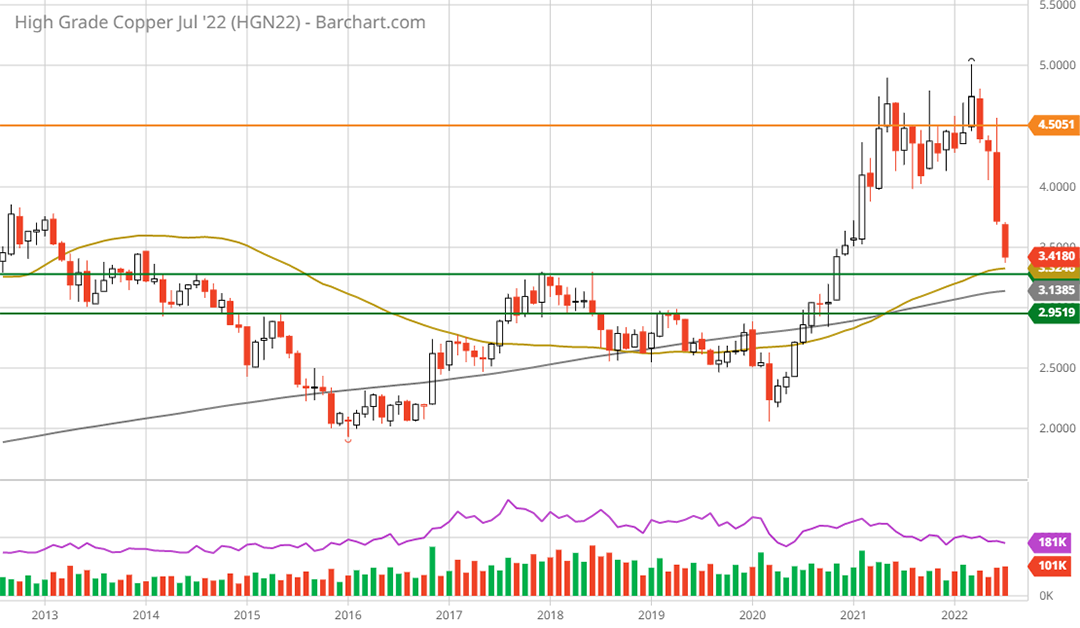
Copper 10-year monthly chart. Created by Brian Kapp using a chart from Barchart.com
Please note that the green lines in the charts represent key long-term support levels, while the orange line represents all-time high resistance. The 10-year monthly chart above depicts a well-defined, long-term W bottom formation, which should offer exceptionally strong support in the $2.95 to $3.30 price range. With copper trading near $3.40, it is sitting at the top end of the long-term support zone. The 5-year weekly chart below provides a closer look at the recent uptrend.
Copper 5-year weekly chart. Created by Brian Kapp using a chart from Barchart.com
Copper is now sitting on its 200-week moving average (the grey line) which happens to coincide with the upper end of the long-term technical support zone (the upper green line). Copper is clearly overextended to the downside in the short term as evidenced by the velocity of the price collapse seen in the following 1-year daily chart.
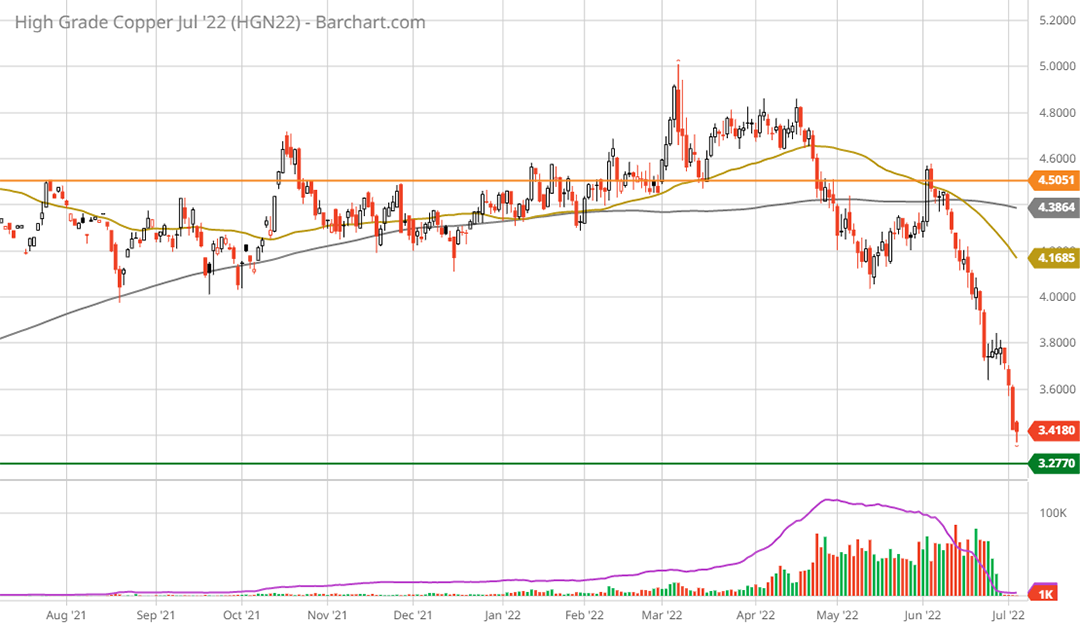
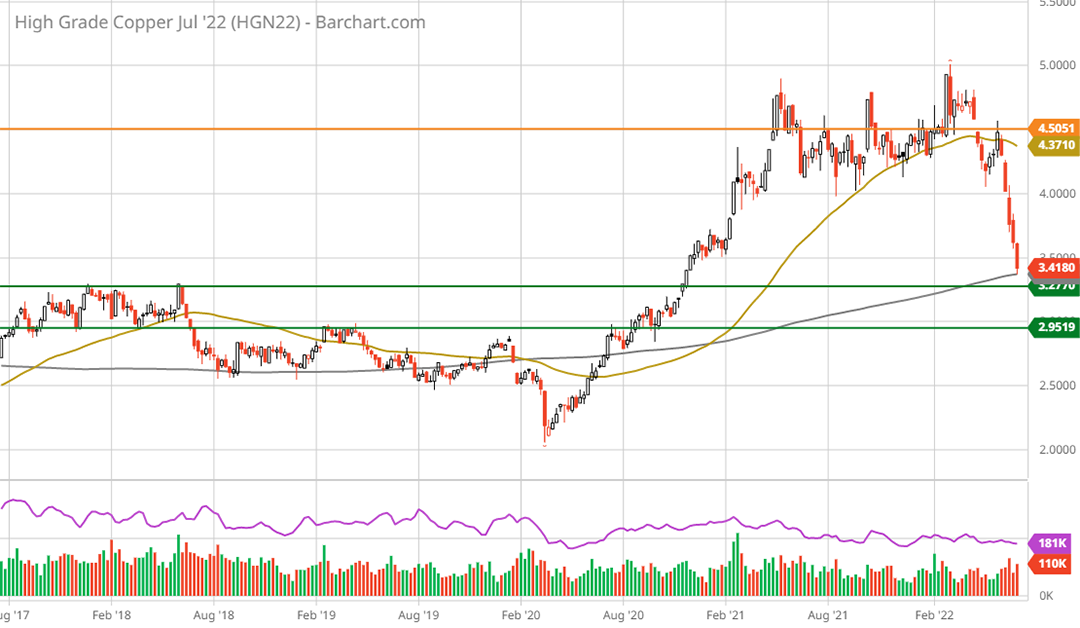
Copper 1-year daily chart. Created by Brian Kapp using a chart from Barchart.com
The 50-day moving average (the gold line) is 23% above the current price. Please keep in mind that copper is a primary industrial commodity at the heart of modern society. The downside overextension combined with copper’s proximity to major support levels and robust demand outlook suggest that the majority of the downside potential is in the rearview mirror.
Freeport Technicals
Freeport’s technical backdrop is identical to that of copper. The following monthly chart provides a bird’s eye view of Freeport’s trading history. Like the copper charts, the green lines represent major support levels while the orange lines represent an all-time high resistance zone.
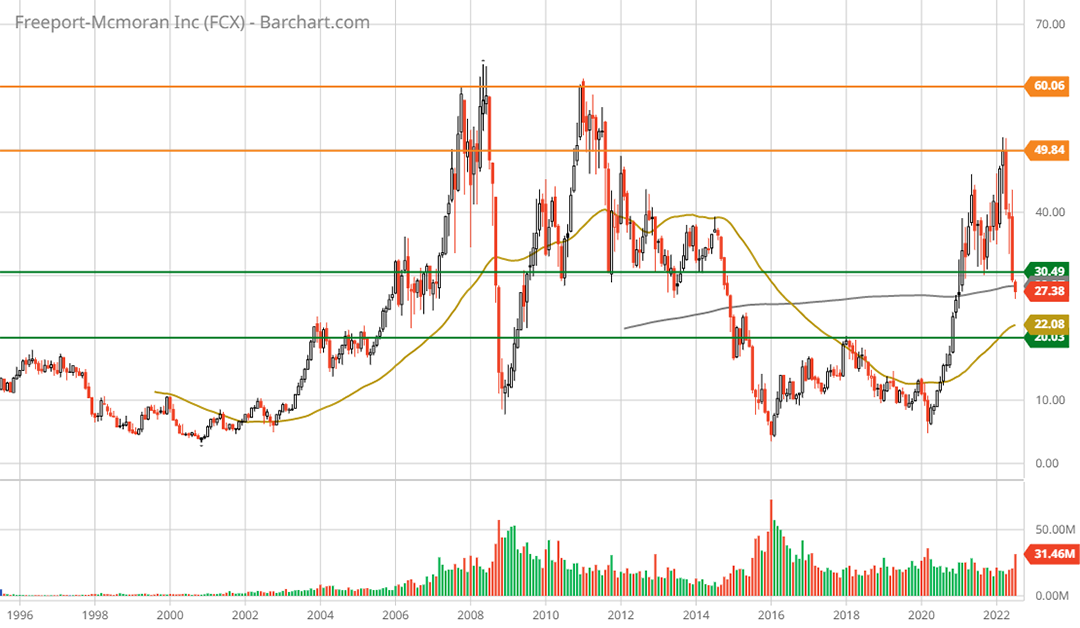
Freeport McMoRan long-term monthly chart. Created by Brian Kapp using a chart from Barchart.com
Freeport is already beneath the first primary support level near $30 (the upper green line). As things stand, the worst-case scenario appears to be $20. This was primary resistance between 2016 and 2020 and coincided with the Chinese real estate demand deceleration discussed above. The 10-year monthly chart below provides a look at the massive W bottom that has formed over the past decade.
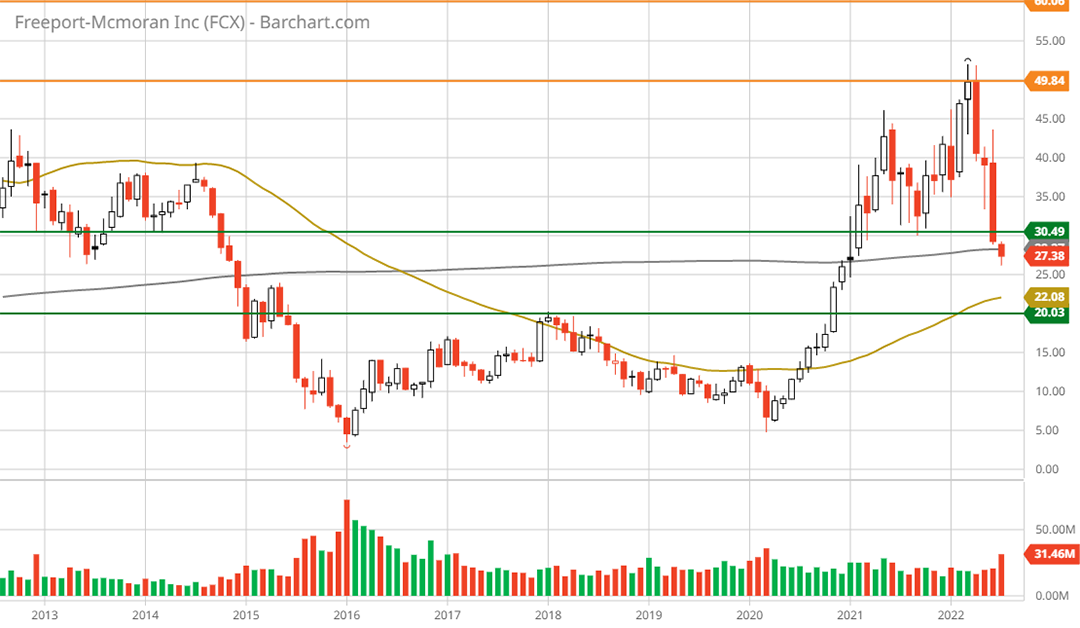
Freeport McMoRan 10-year monthly chart. Created by Brian Kapp using a chart from Barchart.com
The 5-year weekly chart below provides a closer look at the recent uptrend.
Freeport McMoRan 5-year weekly chart. Created by Brian Kapp using a chart from Barchart.com
The $20 level should offer extraordinary support while the 200-week moving average (the grey line) sits just above near $23, confirming the likelihood of an exceptionally strong support zone. The downside potential to $23 and $20 is -15% and -23%, respectively. The 1-year daily chart below offers a closer look at the technical upside potential.
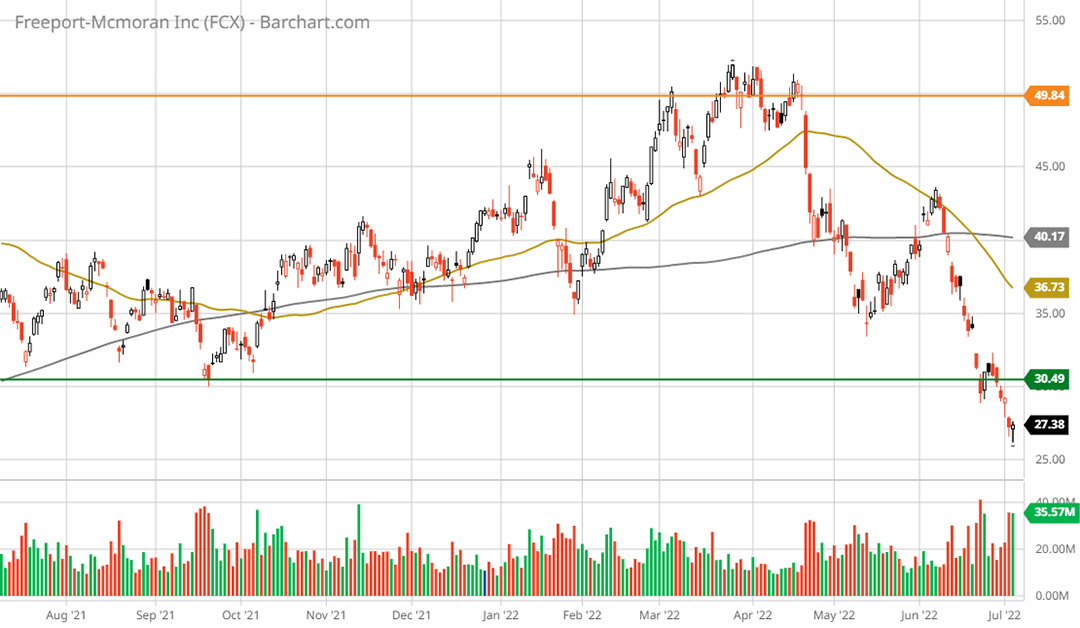
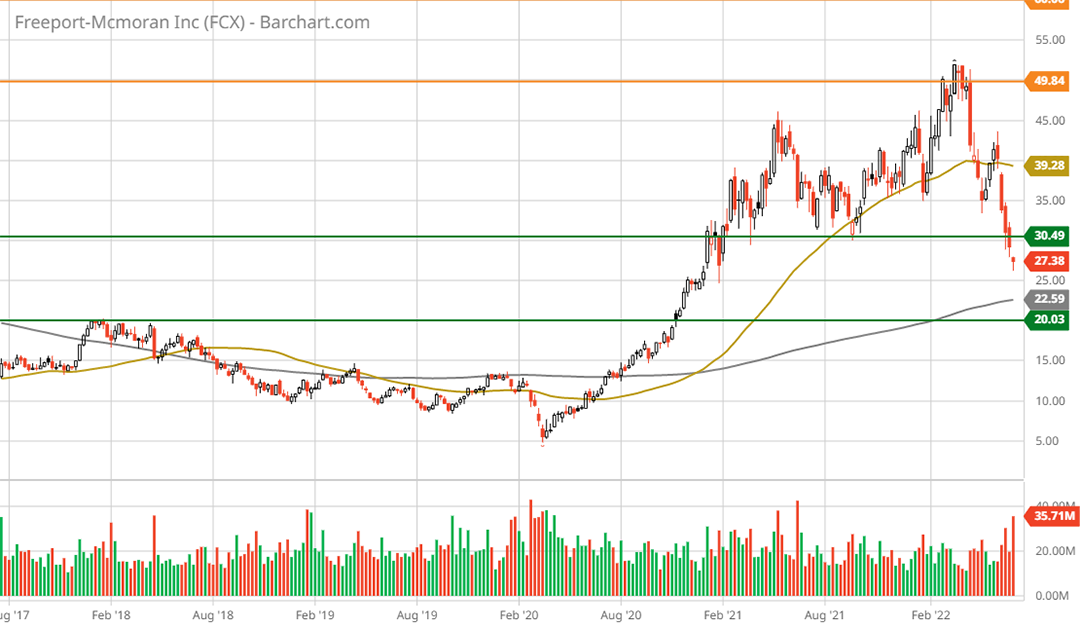
Freeport McMoRan 1-year daily chart. Created by Brian Kapp using a chart from Barchart.com
Nearest resistance is at the 50-day moving average (the gold line) and the 200-day moving average (the grey line) which represent +37% and +48% upside potential, respectively. The next major resistance level is near all-time highs in the $50 area. This represents +85% technical upside potential.
Fundamentals & Valuation
The asymmetric technical risk/reward setup of -23% to +85% is mirrored in Freeport’s fundamentals and discounted valuation. The following table was compiled from Seeking Alpha and displays consensus earnings estimates for Freeport through 2026.
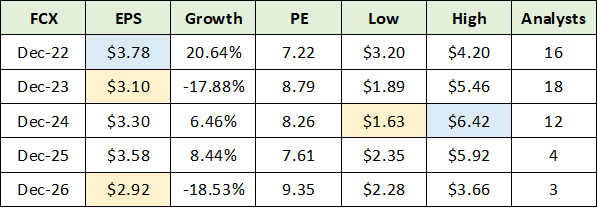
Source: Seeking Alpha. Created by Brian Kapp, stoxdox
Notice in the EPS column that the consensus estimates call for a declining earnings trend through 2026. The consensus trend is not in sync with the strong demand backdrop as detailed above. Additionally, notice that I have highlighted 2024’s low and high earnings estimates of $1.63 to $6.42. The PE ratio range based on these two extreme earnings estimates for 2024 is 17x to 4x, respectively.
At a current PE ratio of 7x the 2022 consensus estimate, it appears highly likely that Freeport’s valuation is now pricing in the low earnings estimate for 2024. The current valuation, at 17x the lowest estimate, is near Freeport’s 5-year average PE multiple of 15x as can be seen in the following table compiled from Seeking Alpha.
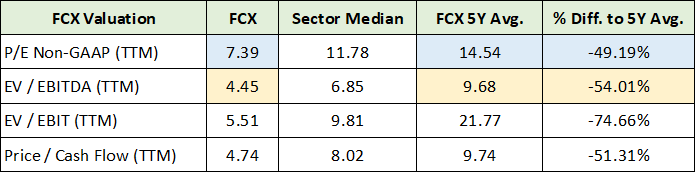
Source: Seeking Alpha. Created by Brian Kapp, stoxdox
If Freeport can hit the consensus earnings estimate for 2024 and trade at its average 5-year valuation multiple, the shares would offer upside potential of +81%. This is inline with the upside technical target of +85% near all-time high resistance. In addition to this natural risk/reward asymmetry, there is further upside potential.
Copper Price Forecasts
Freeport’s declining earnings trend, which is estimated through 2026, is not well supported by industry copper price forecasts. The following table provides a breakdown of the copper price estimates used in my January Rio Tinto report. The data was compiled from Citi Research’s Copper Book: 2021-2030 Outlook and “Copper price forecast: Will it surpass its all-time high?” by Nicole Willing. I have highlighted in yellow the average copper price forecasts through 2030, and in blue the bullish Goldman Sachs forecast through 2025. Copper is currently trading near $3.40 per pound.
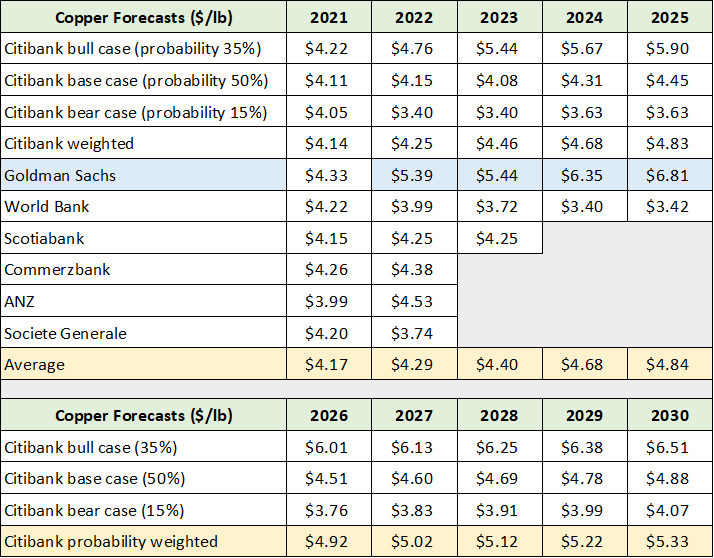
Created by Brian Kapp, stoxdox
The Goldman Sachs forecast through 2025 offers a reasonable upside scenario as the copper supply and demand balance is tenuous given the explosion of alternative energy demand. With copper trading in the low $4 range in 2021 with the same expected for 2022, and higher prices forecasted through 2025 to 2030, one would expect Freeport to achieve earnings growth over the period.
This is decidedly not the case looking at consensus earnings estimates which forecast a declining earnings profile for Freeport. As a result of this discrepancy and the excess demand reality under the desired energy transition pathway discussed above, Freeport offers exceptional upside surprise potential looking out to 2025 and into 2030.
Freeport: Foremost In Copper
Freeport’s tagline, “Foremost In Copper,” is apt given its leverage to copper prices and its leading position as the world’s second largest producer. The following slide from Freeport’s Q1 2022 earnings presentation highlights the company’s sensitivity to copper prices. Every $0.10 per pound change in the price of copper is estimated to translate into an annualized $425 million cash flow change for Freeport (the right-hand side of the slide).
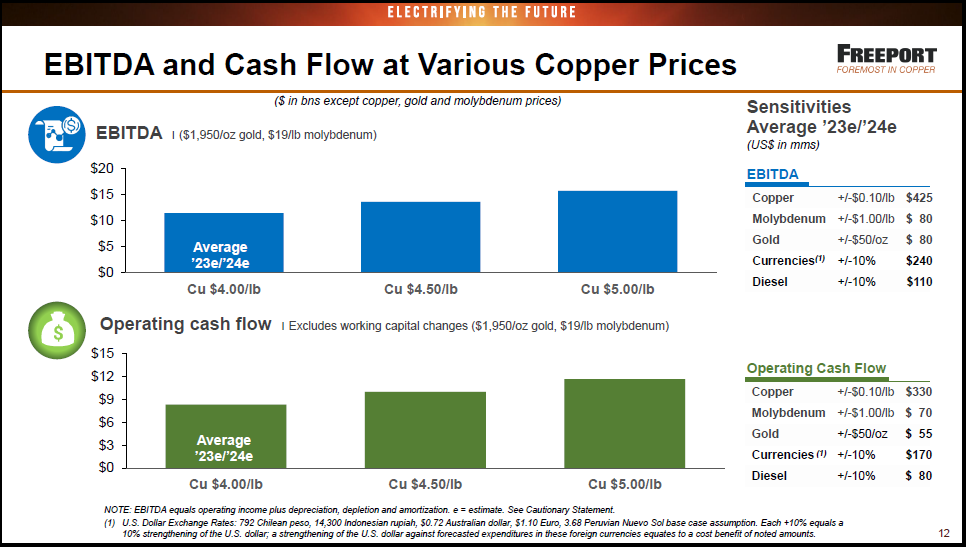
Source: Freeport’s Q1 2022 earnings presentation
The next slide from the same presentation reaffirms the favorable demand backdrop created by the energy transition that was detailed above.
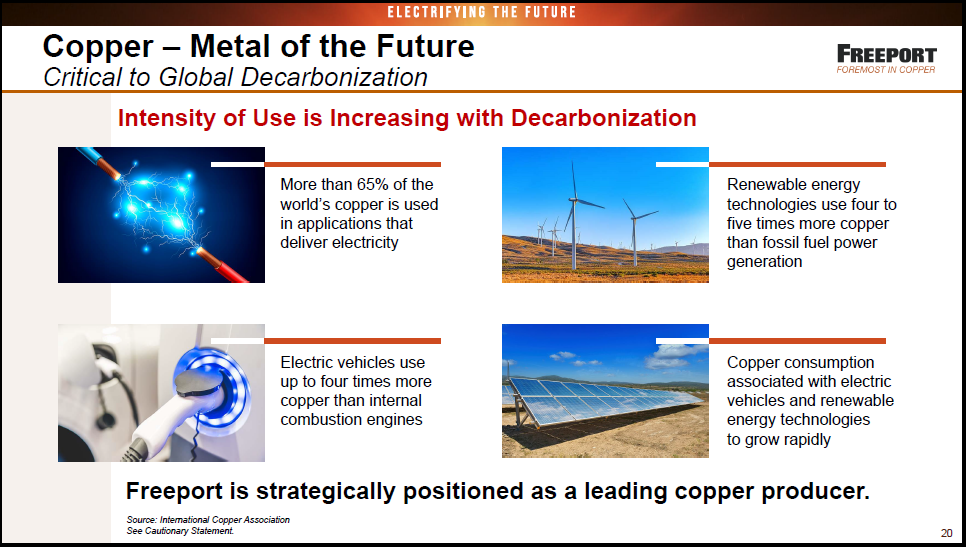
Source: Freeport’s Q1 2022 earnings presentation
The final slide from Freeport’s Q1 2022 earnings presentation displays the company’s production outlook through 2024. Notice that production is estimated to remain relatively stable. At current prices, Freeport, like most miners, is not expanding to meet the extraordinary demand potential that would materialize under the world’s preferred energy transition trajectory discussed above.
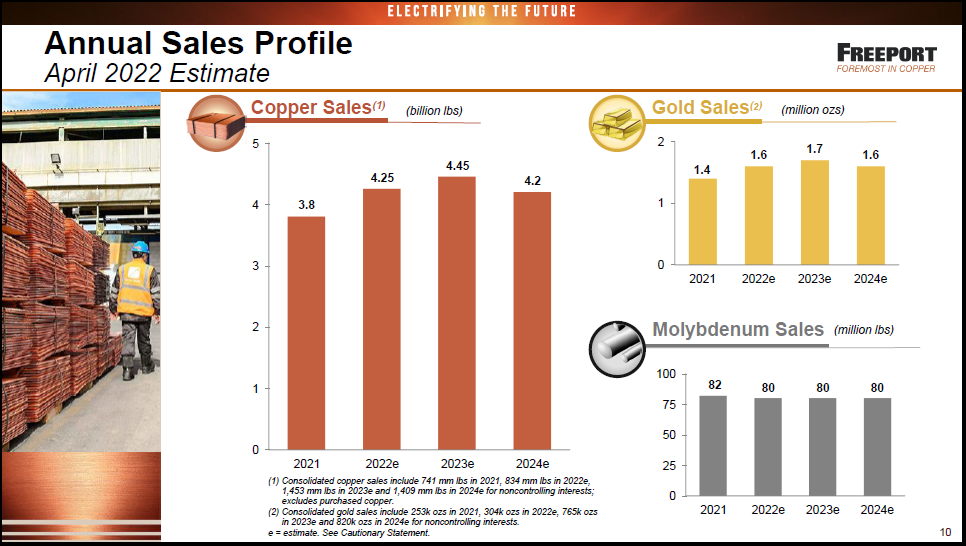
Source: Freeport’s Q1 2022 earnings presentation
If copper prices resume their upward trend, the upside earnings surprise potential for Freeport is substantial given its stable production outlook. Additionally, recall that Freeport’s current valuation appears to be pricing in the lowest earnings estimate for 2024, which would result in a 17x PE at the current price if it were to transpire.
This lowest earnings estimate of $1.63 per share in 2024 embeds substantially lower copper prices compared to current analyst estimates, which are in the range of $4.29 to $6.35 per pound through 2024. For example, if copper prices hit the middle of the expected range near $5, Freeport’s free cash flow per share is likely to be in the neighborhood of $6. Freeport’s 5-year average PE of 15x applied to this free cash flow potential translates into a $90 per share valuation, which represents upside potential of +233%.
Summary
Freeport’s discounted valuation, recent share price collapse, and enhanced upside surprise potential create an exceptionally asymmetric risk/reward situation. The shares appear to be well supported on the downside from both a fundamental and technical perspective. On the upside, the nearer-term return potential is material at north of +80%, with further potential toward +233% visible.
In conclusion, with the global energy transition highly likely to stress available copper supply and place upward pressure on prices, Freeport McMoRan offers one of the most levered opportunities to the largest secular growth trend of our time.
Price as of this report: $27.38
Freeport McMoRan Investor Relations Website: Freeport McMoRan Investor Relations