Victoria’s Secret (NYSE:VSCO) became an independent company on August 3, 2021, and began trading at $48 per share. At the time of the separation, its former parent organization, L Brands, changed its name to Bath & Body Works, Inc. (NYSE:BBWI). For the first time, the Victoria’s Secret brand is free to seek its maximum value potential.
Valuation
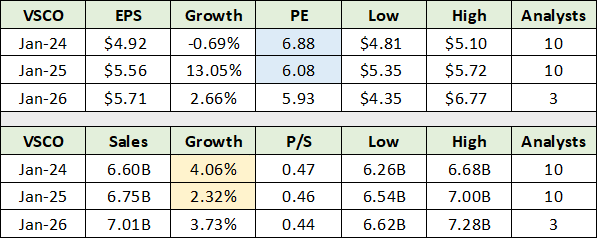
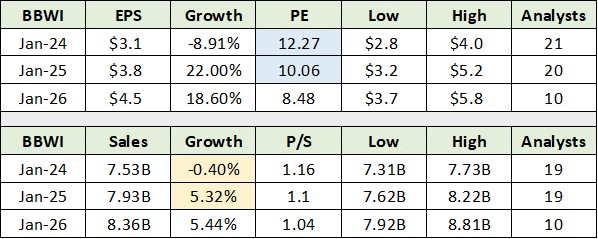
The following tables set the stage for the Victoria’s Secret investment case. They compare consensus growth estimates and related valuations for Victoria’s Secret to those of Bath & Body Works. I have colored coded the comparable cells in each table for ease of comparison.
As covered in “The retail industry offers timely diversification,” the retail industry as defined by the SPDR® S&P® Retail ETF (NYSEARCA:XRT) trades at 12x forward earnings estimates. Victoria’s Secret trades at a steep 42% discount to the group and to its former parent company, Bath & Body Works.
Is The Discount Warranted?
The above comparison highlights the first pillar of the Victoria’s Secret investment case, valuation. Notice the yellow highlighted cells in the above tables. Sales growth estimates are quite similar and do not lend support to such a deep valuation discount for Victoria’s Secret.
Similarly, earnings growth estimates over the next two years are not materially different. Given the uncertainty surrounding the 2026 estimates, Bath & Body Works’ future growth acceleration in comparison to Victoria’s Secret’s should be taken with a grain of salt. As the nearer-term earnings picture for each company is similar, the steep valuation discount for Victoria’s Secret is not supported by consensus estimates.
Comparing Victoria’s Secret’s valuation and growth rates to the overall retail industry results in the same conclusions as those drawn from the Bath & Body Works comparison. With the shares trading near $32, a reversion to the valuation mean of 12x forward estimates would place the shares at $59 and equates to 85% upside potential.
Potential Return Spectrum
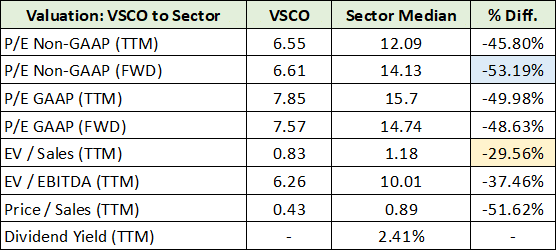
The upside potential to the industry mean receives strong support when viewing Victoria’s Secret in relation to median sector valuations. On a sector level, Victoria’s Secret is a member of the consumer discretionary group. The following table compares the valuation of Victoria’s Secret to that of the sector median across various metrics. I have highlighted in blue the largest discount to the sector and in yellow the smallest.
If Victoria’s Secret were to trade at the sector median of 14x forward non-GAAP earnings estimates, the upside potential equates to $69 per share or 130% upside. The upside to the 1.18x EV/sales valuation equates to $59 or 85% upside potential.
Profitability measures argue in favor of Victoria’s Secret trading in line with its sector and industry peers. The following table compares Victoria’s Secret to the sector median across various measures of profitability. Victoria’s Secret is more profitable across all measures, and its lower capital expenditure needs should translate into above-average free cash flow profitability.
Victoria’s Secret is using its material free cash flow generation to repurchase 10% of its shares this year at the current price. This follows the same repurchase amount in 2022. At this rate, the buybacks alone could drive substantial EPS growth. The trailing free cash flow yield at $32 per share is 23%. Free cash flow in 2022 was similar to the level in 2021.
The average free cash flow over the past two years was $615 million, which equates to $7.31 per share on 84 million shares. This level appears to be a reasonable annual baseline over the intermediate term. If in the ballpark, a 23% free cash flow yield is quite attractive for a company with significant brand equity and growth potential.
Growth Potential
From the above valuation comparisons, it is clear that the market does not expect Victoria’s Secret to achieve consensus estimates. The market is questioning a core pillar of the Victoria’s Secret investment case, its deeply discounted valuation. As a result, whether Victoria’s Secret can achieve or come close to consensus estimates is a key question.
The 10% share buyback appears to be sufficient for meeting and exceeding consensus earnings estimates. Consensus growth estimates are in the mid-single digits over the next three years. In terms of sales estimates, the consensus is for low-single-digit sales growth over the next three years. Inflationary trends render consensus sales growth estimates over the intermediate term to be highly achievable.
International
The primary driver of organic sales growth for Victoria’s Secret over the intermediate to longer term is the international market. International sales account for 9% of total sales. As a result, the company has a long runway for future growth internationally. The following table, compiled from Victoria’s Secret’s SEC filings, displays the sales breakdown by region and type for the just completed fourth quarter and the full year 2022.
Notice that sales contracted by 6.5% in 2022 and 7% in the last quarter. The forecast for the current quarter is for the same level of decline. The company is currently facing recessionary conditions.
In this light, the low-single-digit sales growth estimates for the next three years appear to be too conservative. This introduces material upside surprise potential given the above-average profitability and free cash flow generation potential.
Direct to Consumer
In addition to international expansion, direct-to-consumer sales offer material growth potential. Direct sales represent 29% of the total. As many brands are in the 50% of total sales range, growth potential in the direct channel remains substantial.
The recent acquisition of Adore Me, a 100% direct-to-consumer brand, sends a strong growth signal on the direct sales front. Victoria’s Secret acquired Adore Me for $400 million, which is 1.6x trailing sales of $250 million. The following paragraph from the press release is a quote from the CEO, Martin Waters, regarding the growth potential:
This acquisition will be a significant accelerant as we pivot toward growth and modernize the foundation of our company with technology at the forefront of everything we do. From a financial point of view, we firmly believe the standalone Adore Me business can continue their industry-leading sales growth at operating margin rates that are similar or accretive to the VS&Co operating model.
At Adore Me’s trailing annual sales rate, it would add 13% top line growth to the direct sales channel. This is likely to substantially understate the growth impact on direct sales over the next three years. Victoria’s Secret is highly likely to exceed consensus sales growth estimates over the intermediate term.
Technicals
With material multiple expansion potential and consensus sales growth estimates appearing materially too low, the risk/reward asymmetry is decidedly skewed to the upside. The technical backdrop offers context for tactical considerations. The following weekly chart places the trading history in the broadest context.
The orange lines represent the key resistance levels and the green line represents the only visible support level. What is clear is that Victoria’s Secret has been in a trading range of between $29 and $48 for the past year. As the shares are within 10% of the lower end, if the trading range holds, the upside to the first resistance level is 50% higher.
This upside potential to $48 is well supported by the fundamentally-derived upside targets of $59 to $69 per share. The upper resistance level at $60 is also well within the fundamental target range. Zooming in on the 1-year daily chart, notice that the 50-day moving average (gold line) crossed above the 200-day moving average (grey line) in December 2022. Technically, this is referred to as a golden cross.
Summary
Given the deep valuation discount, current recessionary conditions, and attractive growth outlook relative to expectations, the golden cross in December 2022 is sending a bullish price signal. Victoria’s Secret offers significant upside at the current valuation while the brand serves as a solid foundation on which to grow. With many visible and significant growth opportunities, Victoria’s Secret is a highly asymmetric risk/reward opportunity.
Price as of report: $31.85
Victoria’s Secret Investor Relations


