
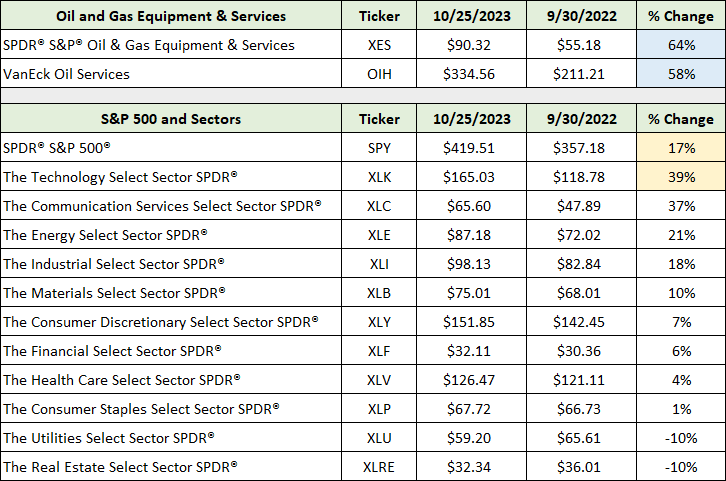
In the October 3, 2022 report “A top sector choice for the coming cycle,” I made the case for the energy equipment and services industry being a top sector choice for the current stage of the cycle. The following table displays the price performance (using illustrative funds) since the report. It includes the energy equipment and services industry (two funds), the S&P 500 index, and the 11 sectors within the S&P 500 index.
Source: State Street Corporation. Created by Brian Kapp, stoxdox
I have highlighted in blue the performance of the energy equipment and services industry, and in yellow that of the S&P 500 index and the technology sector (which is the top performing of the 11 sectors). The outperformance relative to the S&P 500 is 46% for the XES and 41% for the OIH. Compared to the technology sector, the outperformance is 25% for the XES and 19% for the OIH.
Technicals
The most interesting aspect of the energy equipment and services industry’s outperformance is the absence of broad-based market recognition that it has even occurred, let alone that it may continue. The investment community’s disregard for this sector is reflected in the technical backdrop. The following long-term monthly chart of the XES provides a bird’s eye view of the industry’s performance in recent decades.
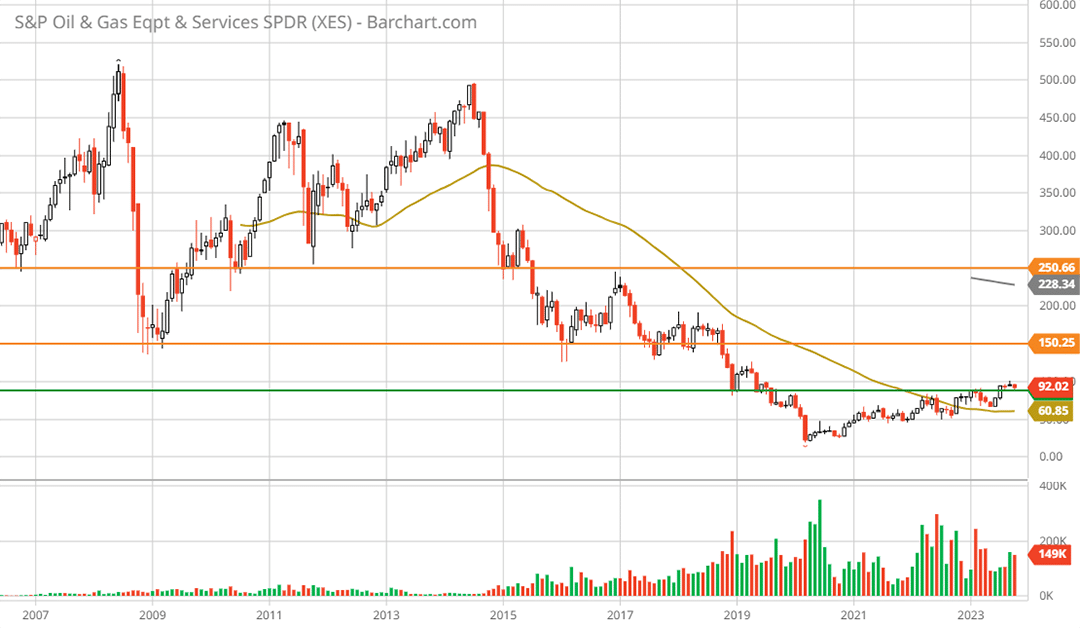
SPDR® S&P® Oil & Gas Equipment & Services ETF XES max monthly chart. Created by Brian Kapp using a chart from Barchart.com
Notice that the industry’s exceptional performance in recent years is barely visible on the long-term chart. In respect to all of the charts, the orange lines represent primary resistance levels (technical price targets) and the green line represents the nearest primary support level. Additionally, the gold line is the 50-period moving average and the grey line is the 200-period moving average.
Looking at the two primary resistance price targets, the upside potential to each is 66% and 177%, respectively. The following 5-year weekly chart provides a closer look at the scale of the industry’s recent outperformance.
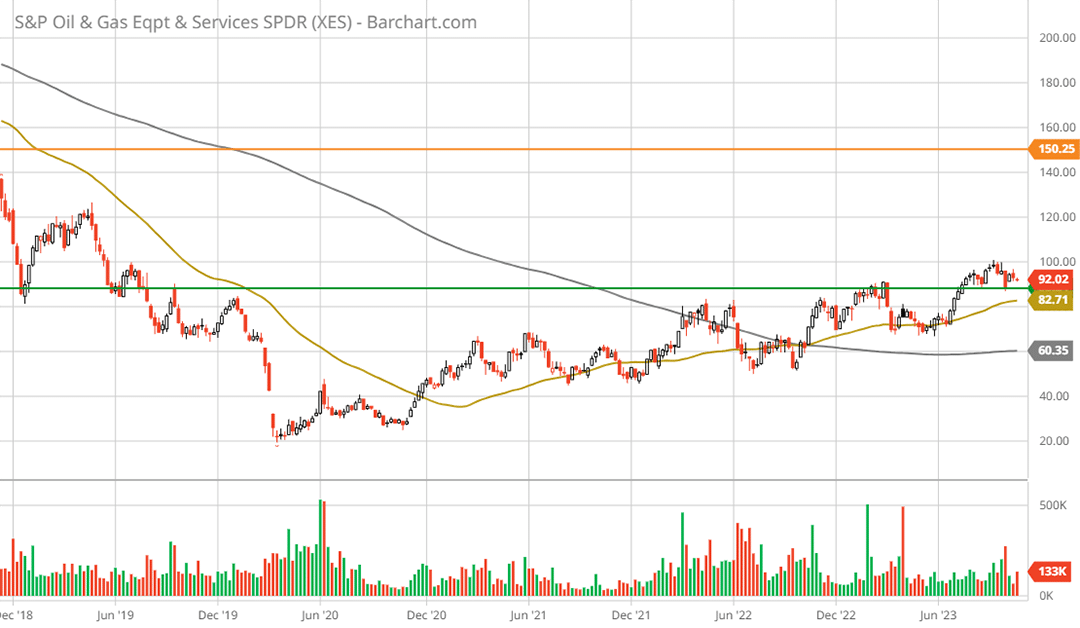
SPDR® S&P® Oil & Gas Equipment & Services ETF XES 5-year weekly chart. Created by Brian Kapp using a chart from Barchart.com
The group has just surpassed a primary resistance level which is now a support level (the green line). I covered this likelihood on February 23, 2023 in “Top 5 industries for earnings growth” (emphasis added):
In summary, the energy equipment and services industry is in a bull market and on the doorstep of breaking out from a major 5-year resistance level (the green line). It is an ideal technical setup, although there is potential for a short-term price correction back to the 50-week moving average near $72.
Interestingly, following the February report, the industry did test the $70 area and found support. Notice that the 50-week moving average crossed above the 200-week moving average in Q4 2022, one year ago. Technically speaking, there is no visible resistance until 66% higher when taking a 5-year view. The following 2-year daily chart zooms in on the current bull market.
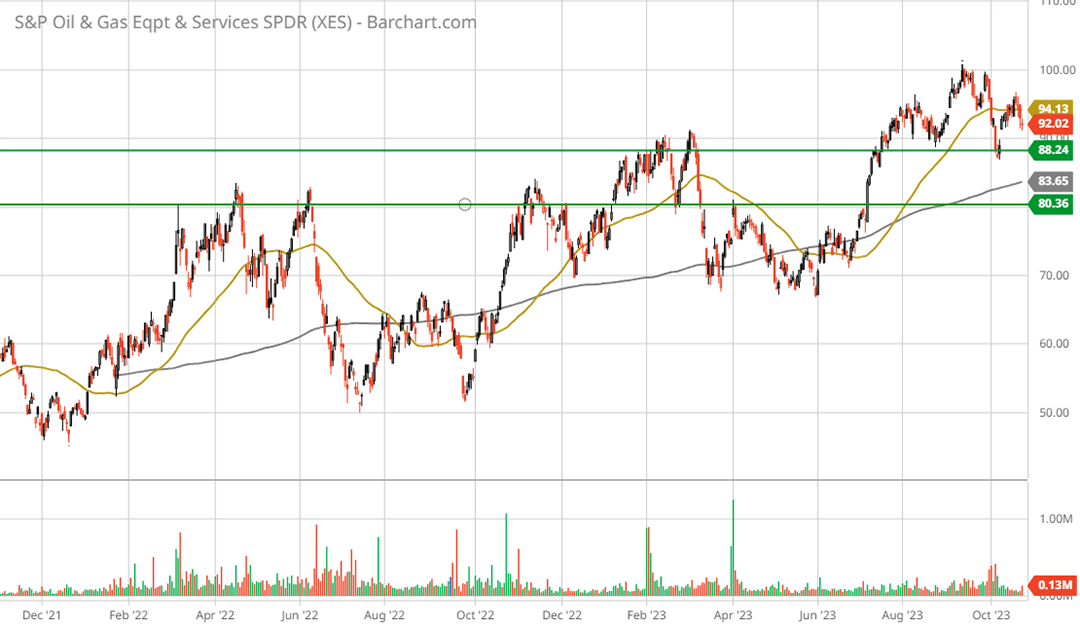
SPDR® S&P® Oil & Gas Equipment & Services ETF XES 2-year daily chart. Created by Brian Kapp using a chart from Barchart.com
In the above chart, I have added a second support level (the green lines) which encapsulates the nearest support zone. The downside to the lower support level is -11%. The technical return asymmetry is highly skewed to the upside.
Fundamentals
Given the cyclical nature of the energy equipment and services industry, the key question as to the duration of the bull market is what is the current stage of the energy upcycle.
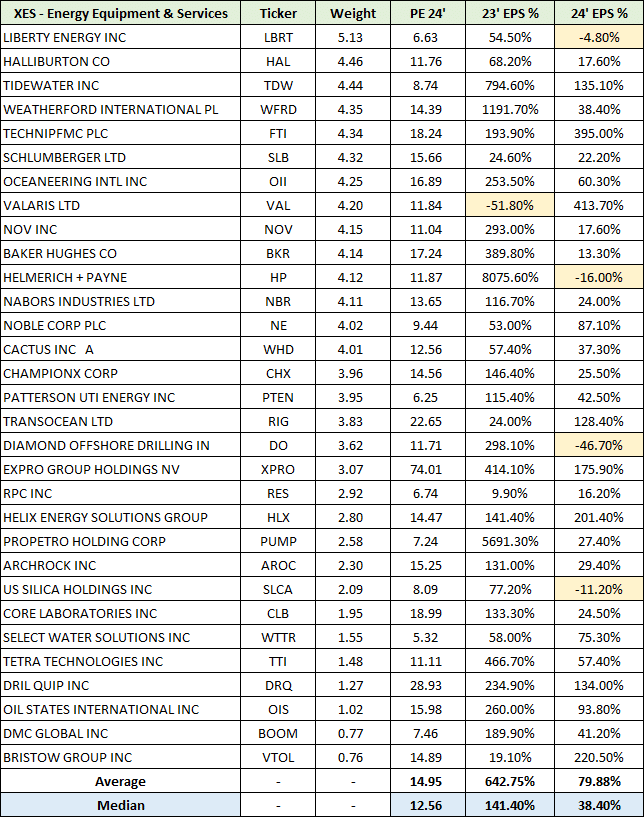
The current stage of the cycle is captured in the following table which displays consensus earnings growth rates for each member of the group over the next two years and the valuation of each using 2024 consensus estimates. I have highlighted in blue the pertinent summary data for the group and in yellow the negative growth estimates.
Source: TIKR.com
The median valuation of the group is 12.56x 2024 earnings estimates with a median growth rate of 38.4% expected for the industry in 2024. This would follow 141% median growth in 2023 if consensus estimates are achieved.
From a cyclical perspective, as evidenced by the 141% growth rate expected for 2023, the industry is in the early stages of an upcycle. If we are in the top of the third in a nine inning energy upcycle, as I believe is roughly the case today, the fundamental asymmetry remains to the upside.
In light of geopolitical risks being at their highest levels in decades, the following passage from the December 12, 2022 report “Is the sun setting on energy stocks?” is an important reminder of the industry backdrop ─ which is a long investment downturn by energy producers following the 2014 peak:
Today, US producers are squarely focused on shareholder returns and are unlikely to expand production materially. This is evidenced by the draw down in DUCs (drilled but uncompleted wells) as discussed in “A top sector choice for the coming cycle.”
Oil and gas producers in the US are restricting available well inventory to the lowest levels in a decade, and beneath the level reached in 2013.
The underinvestment by the industry since 2014 is likely to serve as a major catalyst if the long and stable upcycle materializes.
Summary
While the industry is highly cyclical, and thus volatile, the current energy upcycle looks to be one of steady and persistent growth through mid-decade. The cycle length and stability may surprise market participants after the 2023 to 2024 growth inflection.
If correct, the door is open to upside surprises and a material valuation re-rating for the group. The energy equipment and services industry remains a top sector to stay in the bull market flow.