Retail is one of the final two among the top eight industries covered in the report, “Sector strategies for navigating 2023.” Before diving in, the following is a summary of current market conditions from the prior sector report:
…valuation compression remains the primary risk… As a result, the relative opportunities in the stock market reside in those segments and sectors which are trading at discounted valuations. These opportunities are prevalent in the small to mid-cap value segments of the US market and stretch into the large-cap segment.
Retail
As discussed in “Sector strategies for navigating 2023,” the drawback to using the 11 primary sectors of the S&P 500 as the opportunity set is that they are dominated by a few large companies. As a result, they can materially reduce diversification in market-cap-weighted portfolios.
For example, the consumer discretionary sector in the S&P 500, as defined by the Consumer Discretionary Select Sector SPDR® Fund (NYSEARCA:XLY), includes the retail industry. The following table displays the top five companies and their weightings.
I have highlighted in blue the percentage weight of the top five companies in the consumer discretionary sector. At 56% of the index, it is fair to say that it is a concentrated portfolio within the sector and its various industries. The average PE multiple of 40x forward earnings estimates (the yellow cell) highlights the exposure of this group to today’s primary risk, multiple compression.
Expanding the view using the SPDR® Portfolio S&P 1500® Composite Stock Market ETF (NYSEARCA:SPTM) triples the total opportunity set. Viewing by industry rather than sector doubles the number of opportunity vectors.
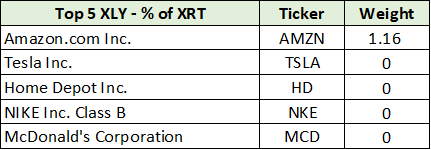
The retail industry within the S&P 1500 Total Market Index is represented by the SPDR® S&P® Retail ETF (NYSEARCA:XRT). Retail is the most directly comparable industry to the consumer discretionary sector in the S&P 500, as represented by the XLY. The following table displays the weightings of the top five companies in the XLY within the XRT.
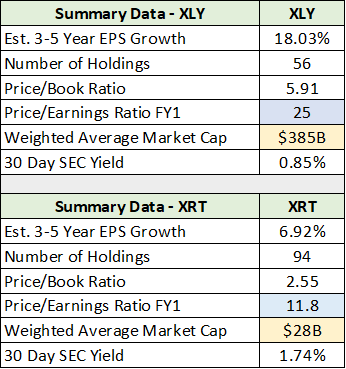
What was a 56% weighting of the top five companies in the XLY becomes a 1.16% weighting in the XRT. Concentration risk is eliminated when using the XRT as opposed to the XLY, thereby greatly expanding diversification. The following table compares the XLY and XRT across key variables. For ease of comparison, I have highlighted in blue the PE ratio on forward earnings estimates and in yellow the weighted average market cap for each fund.
The XRT offers a material reduction in multiple compression risk with a PE of 12x compared to 25x for the XLY. This reduction in risk is accomplished with material exposure to the small and mid-cap value universe, as evidenced by the weighted average market cap of $28 billion compared to $385 billion for the XLY.
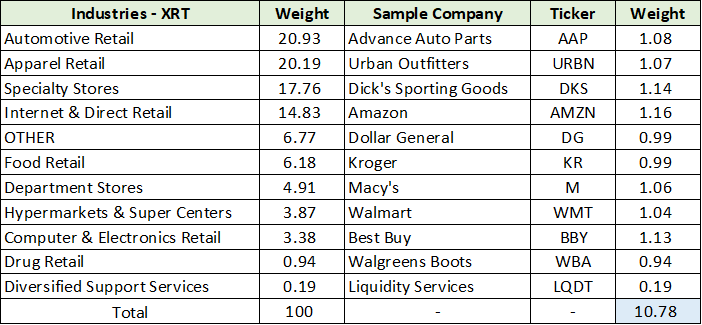
To provide greater color for the retail industry, the following table displays the sub-industry allocation within the XRT and includes a representative company for each. Given the modified equal weighting in the XRT, the company weightings are representative of the weightings of the other 93 firms in the portfolio.
I have highlighted in blue the total portfolio weight of the sample companies. Eleven companies comprise 11% of the XRT portfolio. In comparison, five companies make up 56% of the XLY portfolio.
The retail industry offers broad consumer diversification at a discounted price while adding material diversification compared to the market-cap-weighted consumer discretionary sector. Company details for each sub-industry and their weightings are covered next.
Automotive
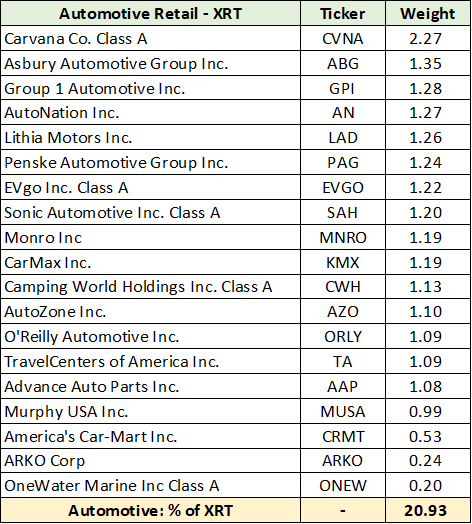
Automotive is the largest sub-industry in the retail industry at 21% of the XRT portfolio (highlighted in yellow below). This is similar to the 24% automotive weighting in the XLY. The key difference lies in the composition of the industry in each fund. Tesla accounts for 64% of the automotive weighting in the XLY and 15% of the total portfolio.
The largest holding in the XRT automotive industry accounts for only 10% of the sub-industry and 2% of the total portfolio, as can be seen below. Note that exposure to less than desirable holdings, such as Carvana, are systemically minimized via quarterly rebalancing.
As can be seen above, each automotive company in the XRT accounts for roughly 5% of the sub-industry weighting and 1% of the total portfolio. The weighting and rebalancing remove the concentration and undesirable stock risks that are prevalent today in market-cap-weighted portfolios.
Apparel
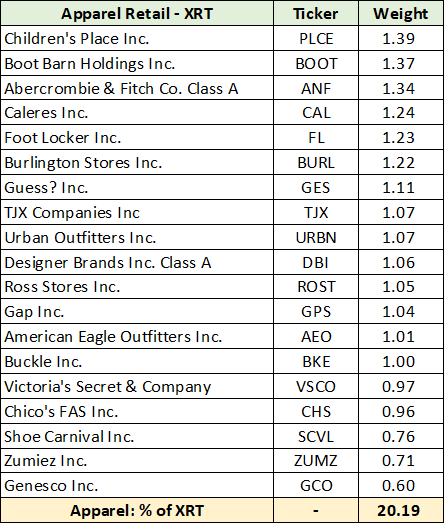
The apparel sub-industry is the second largest weighting at 20% of the XRT, which compares to apparel’s 5% weighting in the XLY. This is a material divergence in sub-industry exposure. Furthermore, Nike accounts for 50% of the apparel industry exposure in the XLY. The top three apparel companies account for 92% of the apparel exposure in the XLY.
In contrast, each of the 19 companies in the XRT apparel sub-industry account for roughly 5% of the apparel exposure and 1% of the total portfolio, as can be seen below.
While Nike is a superior company, this fact is priced into Nike’s shares which are trading at 38x forward earnings estimates. Given today’s market environment, the XRT apparel portfolio offers an attractive alternative to the market-cap-weighted indices. Diversification increases by orders of magnitude in the XRT and is complemented by deeply discounted valuations.
Specialty Stores
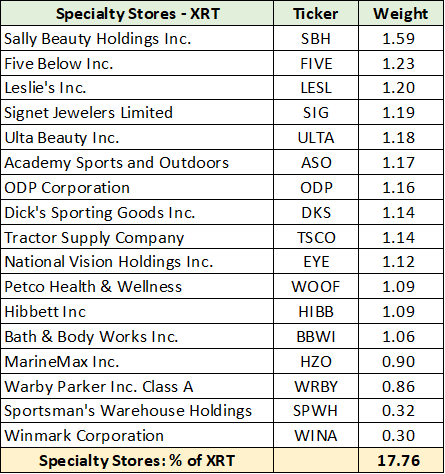
The differences are pronounced when turning to the third largest sub-industry in the XRT, specialty stores. Home Depot accounts for 60% of the specialty store weighting in the XLY, while home improvement stores account for 91% of the total specialty exposure.
Home improvement stores account for an immaterial amount of the XRT specialty store exposure, as can be seen in the following table.
Given the stage of the economic cycle, and the downturn in real estate, minimal exposure to home improvement is a positive attribute of the XRT compared to the XLY over the short to intermediate term.
Internet
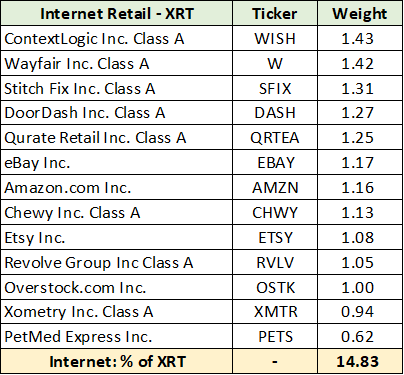
The internet sub-industry of the XRT is decidedly different than that of the XLY. Amazon is the primary difference between the two funds. It accounts for 95% of the internet exposure in the XLY and 23% of the total fund. In contrast, Amazon represents 7% of the internet sub-industry and 1% of the total XRT portfolio. The following table displays the internet holdings in the XRT and the weights of each company.
Of note, the internet industry within the XRT is not terribly attractive. As a result, the diversification benefits of the XRT compared to the market-cap-weighted XLY are diluted.
For those that take a more customized portfolio approach, swapping Amazon for the above companies is a viable alternative to the XRT’s 15% internet exposure. While Amazon faces a uniquely high-risk environment, it is better positioned than the above companies while trading at a similar to lower valuation.
Other
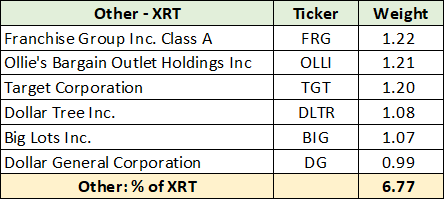
The differences between the XRT and XLY in the other sub-industry category are minimal as the group represents 7% and 5% of each fund, respectively. The following table displays the companies in the other category within the XRT.
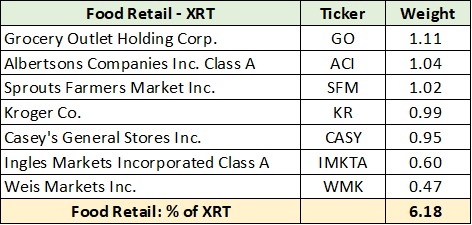
Food
On the other hand, divergence in exposure to the food industry between the XRT and XLY is quite pronounced. Hotels, restaurants, and leisure comprise 19% of the XLY, with McDonalds and Starbucks accounting for 40% of the total sub-industry exposure. In contrast, the XRT offers 6% exposure to the food retail industry and zero exposure to the hotels and leisure companies, as can be seen in the following table.
With McDonalds trading at 34x forward earnings estimates and Starbucks trading at 30x, the XRT is relatively attractive in terms of minimizing the risk of valuation compression. Furthermore, grocery stores are likely to benefit from continued industry consolidation. As a result, the XRT’s food retail exposure is attractive compared to the XLY’s large overweight in two high multiple restaurant stocks.
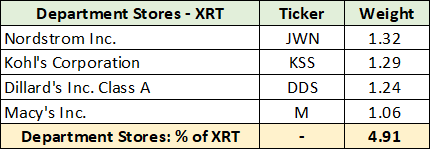
Department Stores
Minimal exposure to the department store sub-industry is a bonus for the XRT. For reference, the XLY has zero exposure to department stores. The following table displays the four members of the XRT.
Each of the above companies look to be a survivor, and, given the discounted valuations offer meaningful upside potential.
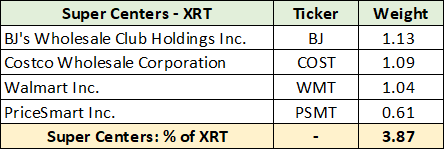
Super Centers
The XRT offers a small 4% exposure to super centers compared to zero for the XLY. While largely immaterial, the diversification benefits are a net positive.
Electronics
While the exposure to electronics is marginal for the XRT at 3.38% of the portfolio, it is three times that provided by the XLY at just under 1% of the portfolio.
Miscellaneous
The final two companies in the XRT fall under miscellaneous and are provided in the table below.
Technicals
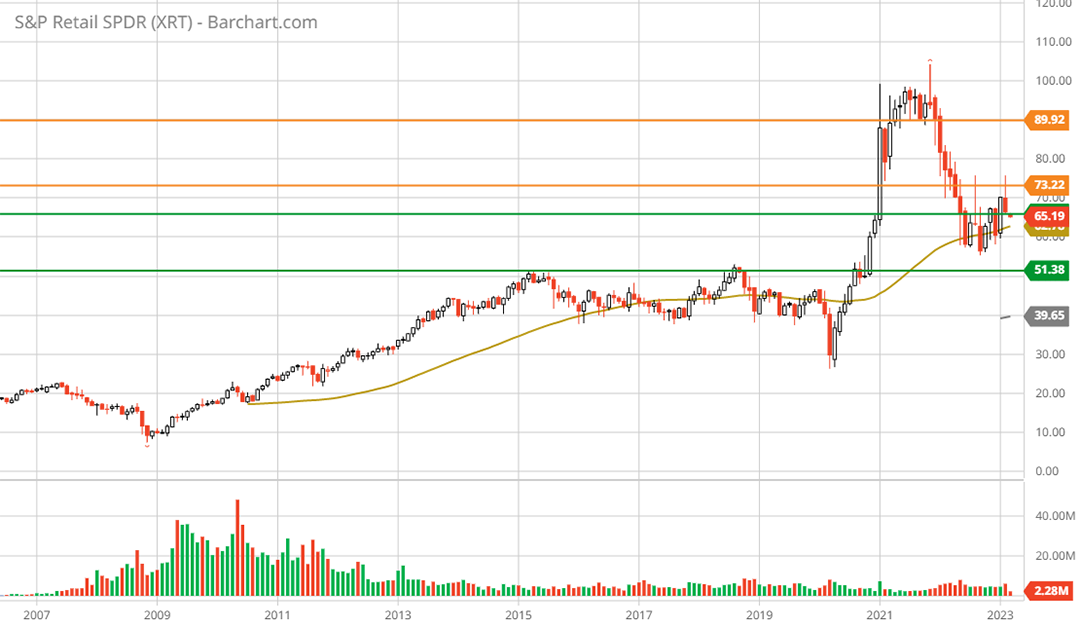
The technical backdrop for the XRT is defined by long-term support which has been carved out over the past decade. In the following monthly chart, the lower green line represents the long-term support level which dates back to early 2015. The support zone is defined by both green lines for which the upper end is currently being tested.
Note that the current test of the upper support level also coincides with the 50-month moving average (the gold line). On the upside, the orange lines represent the primary resistance levels. The following 5-year weekly chart places the long-term price action in the context of recent cycles.
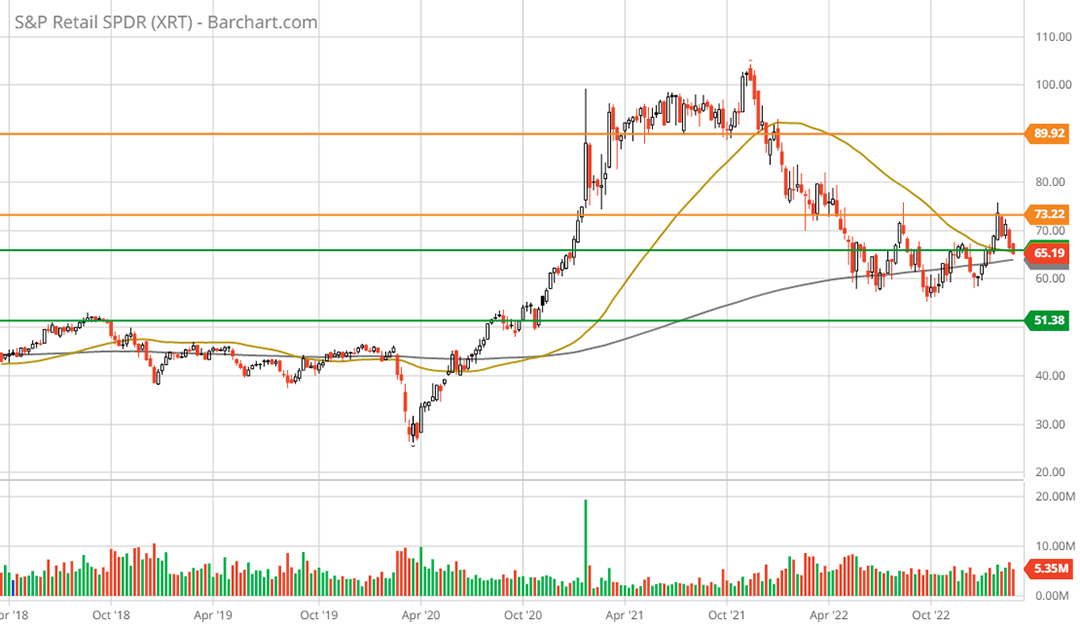
SPDR® S&P® Retail ETF XRT 5-year weekly chart. Created by Brian Kapp using a chart from Barchart.com
Notice that the 50-week moving average (the gold line) is above the 200-week moving average (the grey line), signaling that the long-term uptrend remains intact. The moving averages are now converging following the extreme upside overextension of the shorter-term moving average during the pandemic.
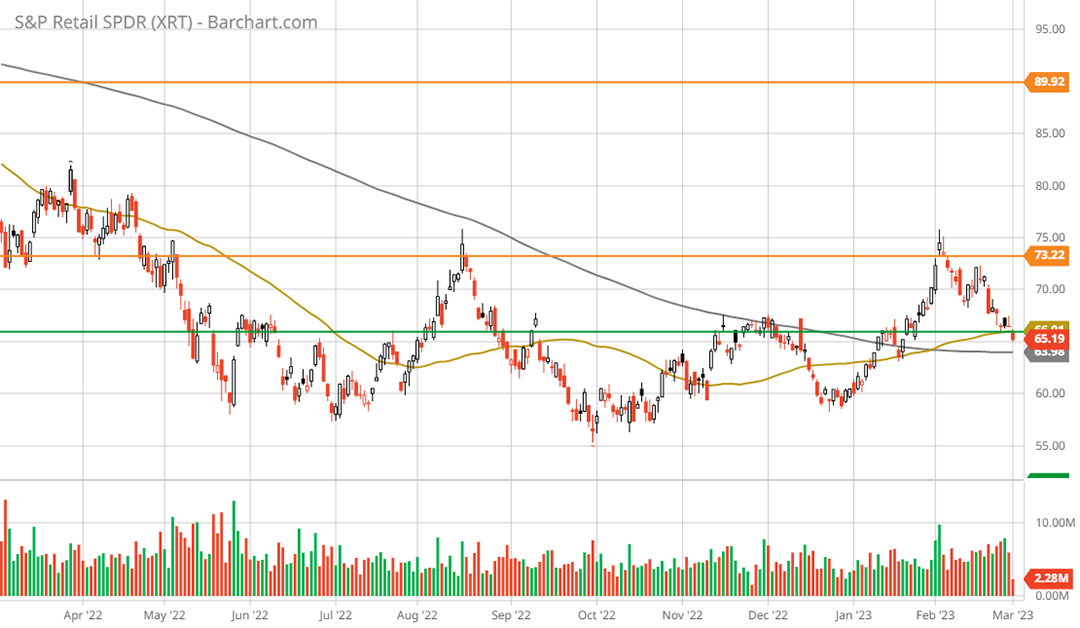
As a result, the retail industry is now sitting atop what should be a strong support zone after having worked off an overbought technical condition that developed in 2020 and 2021. The following 1-year daily chart zooms in on the recent bottoming process.
Notice that the 50-day moving average (the gold line) crossed above the 200-day moving average (the grey line) in early February 2023. Given the year-long bottoming process and the recessionary stage of the economic cycle, this golden cross is a bullish signal for the industry.
The return potential to the upper resistance level is 38%. This represents a realistic target over the nearer term given the discounted valuation, at 12x forward earnings estimates. As the next economic upcycle comes into view, upward earnings revisions could amplify the multiple expansion potential.
Summary
Compared to the 56% weighting of the top five companies in the XLY, the 1% weighting of the same companies in the XRT eliminates the extreme concentration risk. Furthermore, the modified equal weighted portfolio strategy of the XRT provides broad diversification across the consumer sector and its various industries. Finally, the deeply discounted valuation of 12x earnings estimates in comparison to 25x for the XLY minimizes the primary risk in today’s market, multiple contraction.
In summary, from a short-term tactical perspective and an intermediate-term strategic viewpoint, the SPDR® S&P® Retail ETF offers an asymmetric risk/reward opportunity in the consumer sector.


