How many technology-related companies have announced that they will roll out AI products and services in the near future?
Based on Q1 2023 earnings calls and daily market commentary, I would wager that they all have.
How many technology-related companies have received funding during the economic cycle which ended in January 2022?
As discussed in “Technology outlook for 2023,“ the answer is a lot. In fact, by some estimates, the private markets alone continue to house more than 1,200 “unicorns,” or companies valued at over $1 billion each. They are heavily skewed toward technology-related companies and alone account for over $1.2 trillion of perceived market value.
From the perspective of an investor allocating capital with a view to the future, what are the odds of sustainable success in such a crowded and intensely competitive marketplace?
NOV
I open this discussion of NOV Inc. (NYSE:NOV) with the above questions as they illuminate the essence of the NOV investment case into 2030 and beyond. For those that are unfamiliar with the company, NOV is an industry leader in providing equipment, services, and technology to the global energy sector since its founding in 1862.
NOV primarily serves the hydrocarbon energy market though it is increasingly leveraging its strengths to target new growth opportunities resulting from the global energy transition. The following quote from NOV’s 2022 annual report describes the competitive environment in which NOV operates (emphasis added):
The Company’s competition consists primarily of publicly traded oilfield service and equipment companies and smaller independent equipment manufacturers in the oil and gas, industrial, and renewable energy equipment markets.
I covered the oil services industry on October 3, 2022 in “A top sector choice for the coming cycle.“ The following is a quote followed by a table from the report (emphasis added):
An interesting feature of the industry is the lack of investable options for larger institutions. The following table displays the components of the VanEck Oil Services ETF (NYSE:OIH), weighted by market capitalization. I have highlighted in yellow the companies that are large enough to absorb sizeable investment flows.
For all intents and purposes, NOV competes with the top three firms on the list. The contrast with technology-related sectors could not be more glaring. Rather than competing with thousands of well-funded small to medium-sized firms and an assortment of entrenched, colossal corporations, NOV’s real competition can be counted on one hand.
Returning to the question above, what are the odds of sustainable success in a crowded and intensely competitive marketplace such as technology and AI? In short, regarding the probability of sustainable success, the odds are quite low.
From a pure competitive dynamics lens, NOV and the energy services and equipment industry offer a far higher probability of success. As a result, they are relatively attractive compared to the crowded technology-related growth sectors of the last cycle which remain market favorites today.
The most interesting aspect of the outlook for NOV is that the company is creating and deploying incredible technologies. While pure AI and renewable energy companies are all the rage, NOV is quietly creating products and services which address real-world use cases for such technologies.
I covered NOV’s leadership position in the wind market in “A top sector choice for the coming cycle.” Wind is one of many energy transition growth vectors for NOV. The following video provides more color surrounding the breadth of opportunities and depicts one application in the offshore energy market using NOV’s PowerBlade™ Kinetic Energy Recovery System.
The Pendulum
Furthering the investment case for NOV is the fact that the company is well defined by its cyclical nature ─ the pendulum as it were. The energy services and equipment industry suffered through a prolonged recessionary environment during the seven years which ended in 2021. One might even call the conditions depressionary at times, with negative oil prices during the onset of the pandemic.
The long recession in the energy services and equipment industry reached an inflection point in the third quarter of 2021. The passage below is from the December 21, 2021 report “Schlumberger is a top choice for cyclical growth through 2023.“ While it pertains to the industry leader, Schlumberger, the quote captures the stage of the current upcycle in the industry.
The North American market joined Latin America in the growth cycle inflection during Q3 2021… The remainder of the world has yet to reach the growth inflection point… These trends are important because 80% of Schlumberger’s markets had not inflected toward growth as of the end of Q2 2021.
The following quote from Schlumberger’s CEO, Olivier Le Peuch, is from the April 14, 2022 report “Schlumberger is an asymmetric opportunity with supercycle potential“ (emphasis added):
Looking ahead into 2022, the industry macro fundamentals are very favorable, due to the combination of projected steady demand recovery, an increasingly tight supply market… These favorable market conditions are strikingly similar to those experienced during the last industry supercycle, suggesting that resurgent global demand-led capital spending will result in an exceptional multiyear growth cycle.
Finally, the following industry update is from NOV’s 2022 annual report (emphasis added):
Despite a recent pullback in commodity prices… management believes the industry is in the early stages of an extended recovery. Diminished global oil and gas inventories and productive capacity resulting from underinvestment in the industry over the last seven years… should continue to spur increased oilfield activity and demand for the Company’s equipment and technology.
The important thing to keep in mind regarding the recent downturn in oil and gas prices is that recessionary conditions have been in place for several quarters. This is most visible in the shipping and transportation sectors which are experiencing deep volume contractions, as discussed in “Shipping and recession: To be or not to be?“.
The transportation sector is a large energy consumer, as are many other industries which are currently operating in recessionary conditions, such as the chemical and automobile industries. The chemical and automobile industries were discussed in “Eastman’s bull market is nearing full bloom“ and “BorgWarner has the pieces for a bull market.“ As a result, today’s energy prices are reflective of recessionary conditions and are thus likely in a bottoming phase transition.
In summary, the cyclical pendulum of the energy services and equipment industry is now in full swing leaving only the nature and duration of the upcycle in question. What will be the contours carved in the sand as the cyclical pendulum swings?
The long depressionary period and underinvestment in the industry have set the stage for what looks to be a rather stable and persistent upcycle. A supporting factor for a long and prosperous upcycle is the energy transition away from hydrocarbons.
While this may seem counterintuitive, the energy transition is highly likely to deter new entrants, and thus competition for NOV. At the same time, the energy transition is opening new doors to secular growth opportunities such as wind power and carbon capture.
The Moat
The structurally bullish industry dynamics discussed above are further buttressed by NOV’s positioning and global infrastructure. In terms of a competitive moat, it is safe to say that it would be extraordinarily expensive and technically difficult to replicate what NOV has built.
The inflationary backdrop in the industrial sector renders NOV’s equipment and installed base quite valuable. This concept is captured in the Q ratio, or Tobin’s Q, which was a popular valuation metric during more inflationary times. In essence, the Q ratio compares the market value of a firm to the replacement cost to recreate the firm from scratch.
In addition to the cost to recreate NOV’s asset base, there is the issue of replicating NOV’s employee roster and associated intellectual property. Here, the cost would be extraordinary as much of NOV’s workforce is highly skilled in technical trades. The following list was compiled form NOV’s 2022 annual report and offers a glimpse into NOV’s highly skilled and global human capital:
Inventors, designers, scientists, engineers (including mechanical, electrical, chemical, hydraulic, materials, computer, software, data analytics, and other disciplines), Technical sales, training professionals, logistics, warehousing, quality testing professionals, production and service planners, project managers, process design, health safety and environmental professionals, machinists, metal fabricators, welders, assemblers, pipe fitters, riggers, electronics technicians, system integrators, composite material fabricators, paint and industrial coatings specialists, field service engineers, mechanics, technicians, business leaders, managers, human resources, Legal, Compliance, and finance professionals.
As of the end of 2022, NOV had 32,307 employees distributed around the globe across 554 facilities. The regional breakdown of the employee base is as follows: 36% United States, 21% Europe, 15% Latin America, 12% Asia Pacific region, 10% Middle East and Africa, 4% Canada, and 2% in China.
With NOV trading at just under a $6 billion market value, using a back of the napkin approach, I would wager that Tobin’s Q for NOV is well above $6 billion. NOV’s moat is quite large.
Consensus Estimates
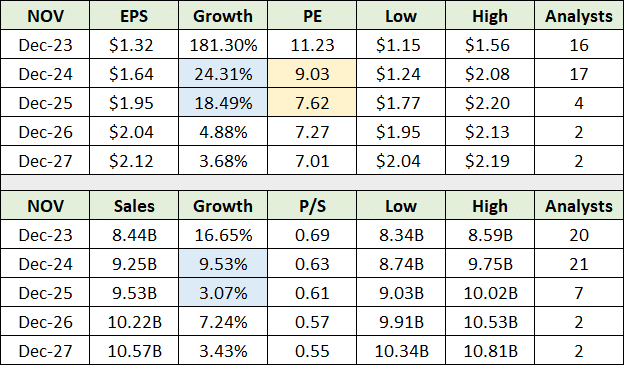
With structurally bullish industry conditions and a wide moat, consensus growth estimates for NOV can be viewed in the proper context. The following table displays consensus earnings (top) and sales estimates (bottom) through mid decade.
I have highlighted in blue the expected earnings and sales growth rates for 2024 and 2025. It is interesting that consensus sales growth estimates are quite moderate compared to the stage of the cyclical upturn in the energy services and equipment industry. As a result, there appears to be substantial upside surprise potential in relation to sales growth expectations.
Earnings growth is expected to be driven by margin expansion. The amount of margin expansion embedded in consensus expectations looks to be reasonable. This is especially the case given the depressed operating and profit environment in recent times and the muted competitive environment looking forward.
Given the likelihood of NOV exceeding sales growth expectations into mid decade, margin expansion could ignite sizeable upside surprises to earnings expectations as the decade unfolds.
Adding further upside potential is NOV’s depressed valuation, which is highlighted in yellow above. One can easily envision a valuation multiple on earnings re-rating to the high teens given consensus earnings growth expectations. Multiple expansion alone could translate into 100% upside potential.
Technicals
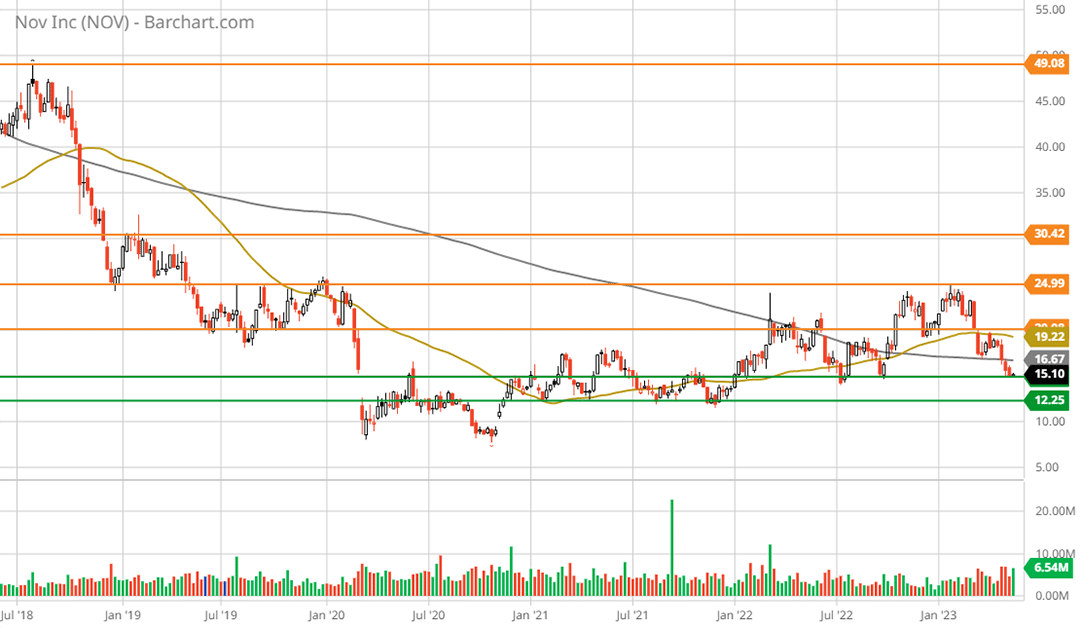
The technical backdrop is in perfect alignment with the fundamental risk/reward asymmetry. NOV is sitting on what should be an incredibly strong support zone. Strong technical support nearby is reinforced by NOV’s single digit PE ratio and exceptional earnings growth potential into mid decade. The following 5-year weekly chart captures the essence of the technical setup.
Note that the green lines encase the primary support zone and that the orange lines represent key resistance levels. Additionally, the grey line represents the 200-period moving average and the gold line represents the 50-period moving average.
NOV is testing levels last seen during the panic period surrounding the onset of the pandemic. Recall that oil prices briefly traded in the negative $40 area. These were depressionary times for the oil and gas industry. Therefore, this support area is highly likely to be strong.
Notice that the 50-week moving average crossed above the 200-week moving average on October 31, 2022. Given that weekly moving averages are slow moving, the technical interpretation is that a long-term trend reversal to the upside is in progress.
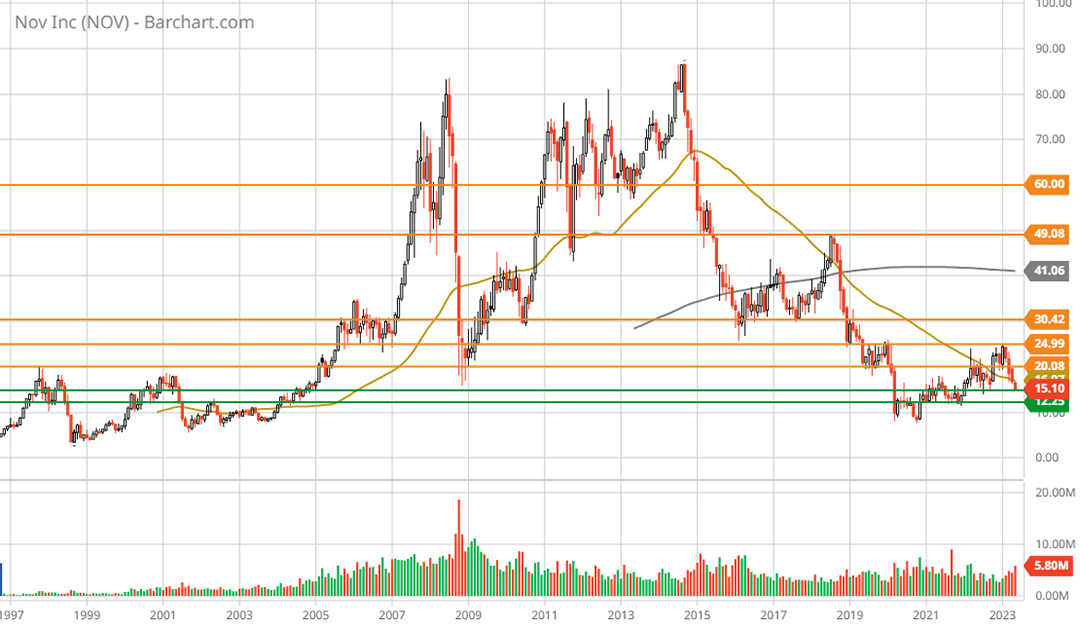
A new bull market is likely at hand. This interpretation is fully supported by the fundamental backdrop discussed above. The following long-term monthly chart provides a bird’s eye view of the technical setup for NOV.
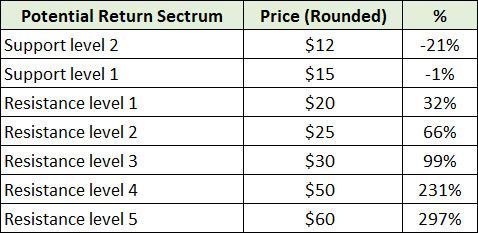
Please note that the support and resistance lines represent technical price targets. The potential return spectrum based on these targets is displayed below.
Summary
With consensus earnings estimates in the $2 per share range in 2025, and material upside surprise potential, the entire technical return spectrum finds fundamental support. As a high-quality industry leader buttressed by structurally bullish industry conditions and a wide competitive moat, the risk/reward asymmetry is decidedly skewed to the upside for NOV.
Price as of this report: $14.69
NOV Inc. Investor Relations website


