
Risk/Reward Rating: Positive
This is a brief update on Eastman Chemical (NYSE:EMN) which was covered in the September 6, 2022 report, “Eastman Chemical is entering a bull market.” Since then, Eastman’s share price has followed the bullish notes exactly as written in the report:
While the current retest of recent lows near $85 may fail to hold given the current bear market in stocks broadly, the downside appears to be well contained… While I expect exceptionally strong support near $80, there is additional technical downside potential to the $70 range.
Technicals
The following 6-month daily chart captures the price action following the September report. Please note that the green lines represent key support levels, and the orange line is the beginning of a resistance zone that spans from $90 to $130 at roughly $10 intervals.
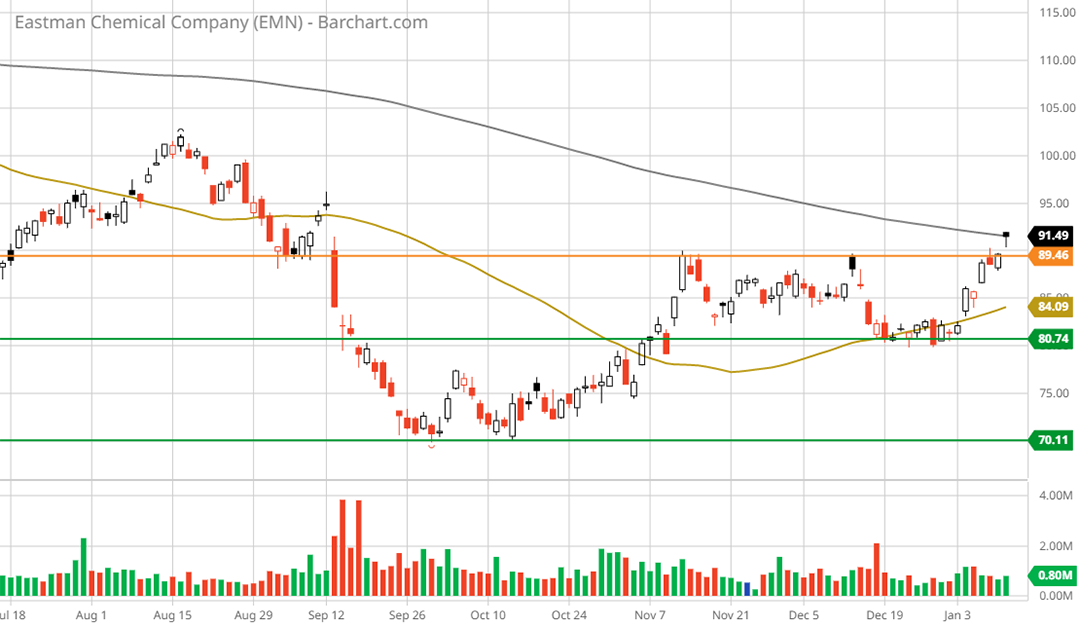
Eastman Chemical 6-month daily chart. Created by Brian Kapp using a chart from Barchart.com
Following the September 6 report, notice that Eastman traded precisely to the lower support level at $70. Importantly, after rallying to $90 in early November, the shares consolidated sideways and found strong support at the $80 upper support level.
This week, Eastman made its first attempt to breakout above the first resistance level near $90 (the orange line). The following 1-year daily chart provides a larger perspective of the cup and handle bottom formation that has formed since September and the initial breakout attempt displayed above.
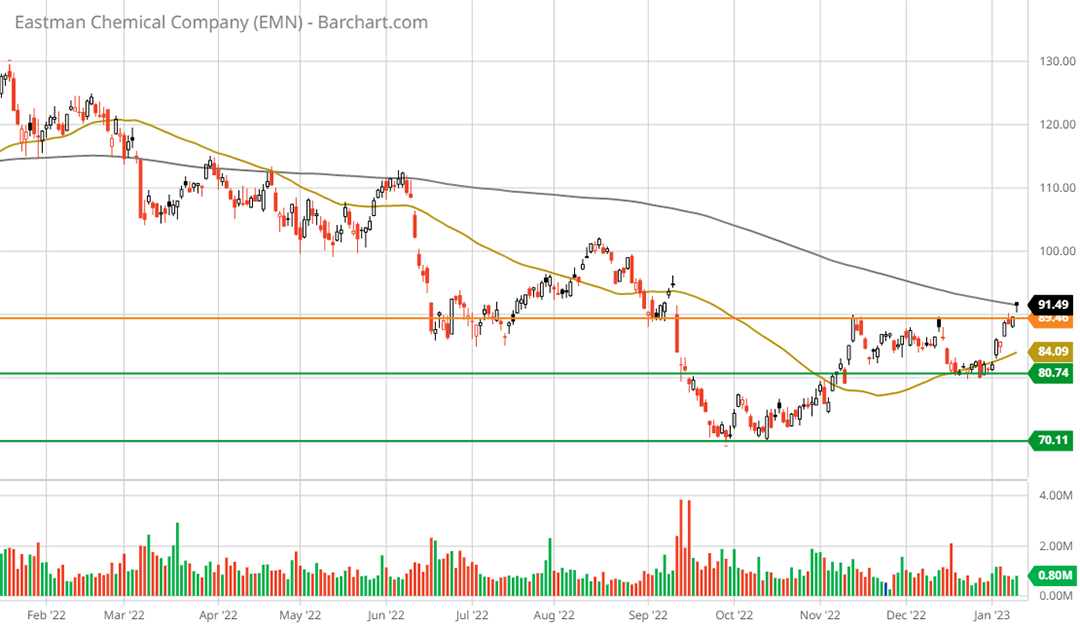
Eastman Chemical 1-year daily chart. Created by Brian Kapp using a chart from Barchart.com
Note that the grey line is the 200-period moving average and the gold line is the 50-period moving average. In the above charts, the period is days. With the shares breaching the 200-day moving average from below, one would expect some resistance to the breakout attempt.
That said, the cup and handle bottom formation is playing the bullish notes as laid out in the September report. The upside breakout attempt this week points to the nascent bull market of the past five months nearing full bloom. The following 5-year weekly and 20-year monthly charts provide a bird’s eye view of the technical setup for Eastman.
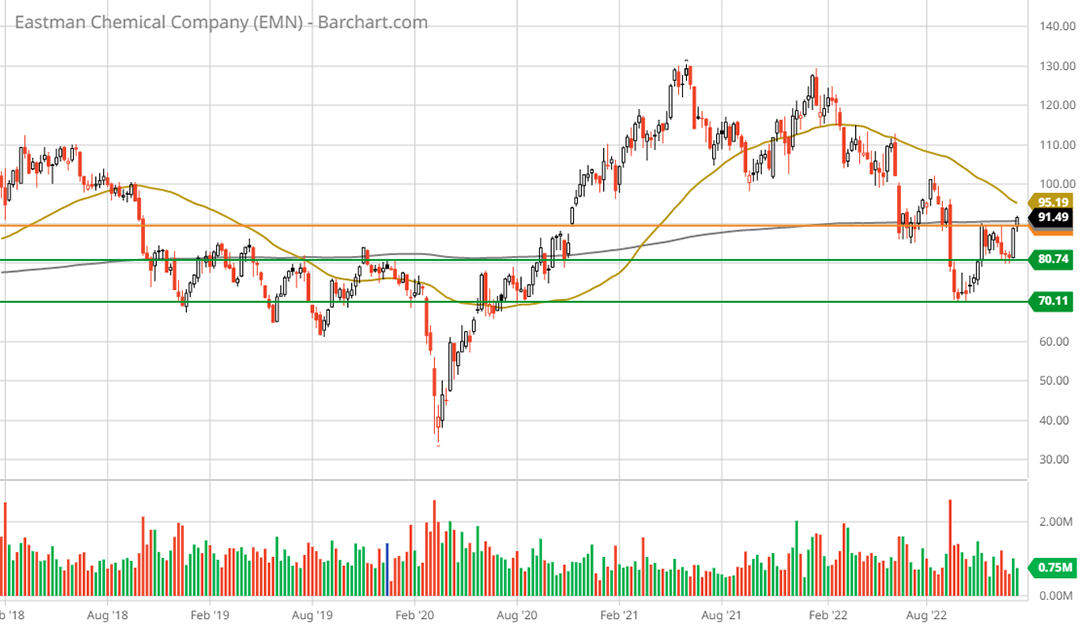
Eastman Chemical 5-year weekly chart. Created by Brian Kapp using a chart from Barchart.com
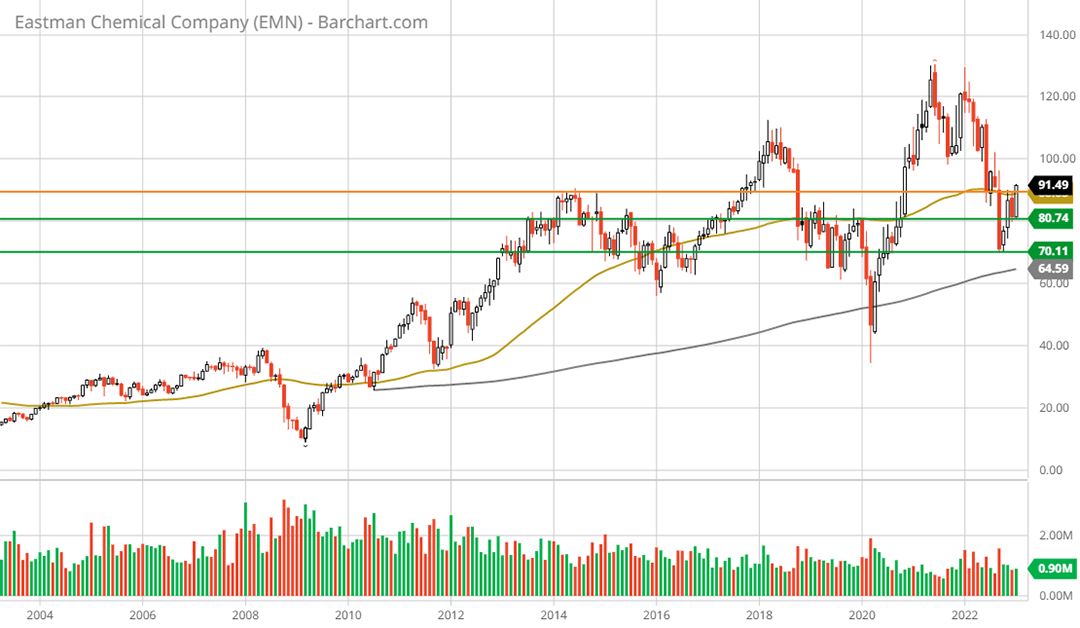
Eastman Chemical 20-year monthly chart. Created by Brian Kapp using a chart from Barchart.com
Eastman has been consolidating sideways for a decade within a longer-term uptrend. The longer-term charts speak to the strength of the support zone between $70 and $80, which stretches back to 2013. Equally important, the 5-year and 20-year charts speak to the likelihood of minimal technical resistance between $90 and all-time highs near $130, as there is little trading history in the $90 to $130 range. From the September report:
First upside resistance is near $102 followed by $122, after which there is no visible resistance. The lack of technical resistance above $122 is fully supportive of Eastman entering a long cycle of outperformance, as was the case from April 2003 through June 2014.
During the last decade-long bull market, Eastman’s annualized rate of return was 18% before dividends. In comparison, the S&P 500 (NYSE:SPY) returned 7% per year over the 11-year Eastman upcycle. Of note, Eastman’s dividend yield is well-above average near 3.5% compared to the S&P 500’s dividend yield of about 1.7%. Eastman also has a substantial and active share buyback plan.
Fundamentals
The technical picture is a mirror image of Eastman’s fundamental setup. Just as a test of lower support was to be expected given the recessionary conditions and bear market, earnings estimates also have come down since the September report. The following table displays consensus earnings estimates as of January 13, 2023 compared to those as of the September 6 report.
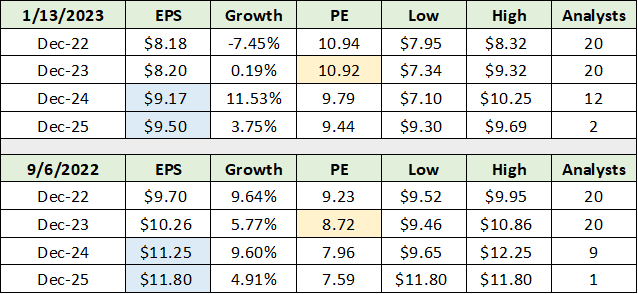
Source: Seeking Alpha. Created by Brian Kapp, stoxdox
I have highlighted in yellow the valuation change since September 2022. Eastman’s valuation is now expanding. Multiple expansion on reduced earnings estimates is part of the bullish playbook as discussed in the following quote from the September 15 report, “The recession is here, filter the noise.” It followed an earnings warning by Eastman Chemical just after my September 6 report.
Eastman was trading at 9x the 2022 consensus earnings estimate, which is roughly half the market-wide multiple. Clearly investors were anticipating Eastman missing the consensus estimate for 2022, which I infer from Eastman’s trading history near a mid-teen earnings multiple.
I have highlighted in blue the change in consensus estimates for 2024 and 2025. Following the earnings warning in September 2022, analysts took down estimates by roughly equal percentage amounts through mid-decade. The percentage changes in consensus estimates are displayed in the following table.
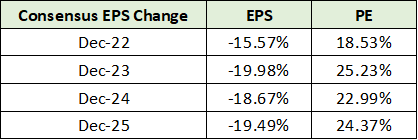
Created by Brian Kapp, stoxdox
Given that recessionary conditions set in for Eastman in Q3 2022, the reduction in estimates for 2024 and 2025 appear too pessimistic. Eastman should be well into an economic upcycle by the mid-decade time period. The mid 20% PE multiple expansion on lowered 2024 and 2025 consensus estimates may be signaling that they are too low.
Multiple Expansion
A primary factor in the bullish Eastman playbook is multiple expansion. In the September report, I introduced DuPont (NYSE:DD) as a high-quality comparable company for Eastman. The companies have similar sales, end markets, margin potential, and credit quality. The following table displays consensus estimates for DuPont compared to Eastman through mid-decade.
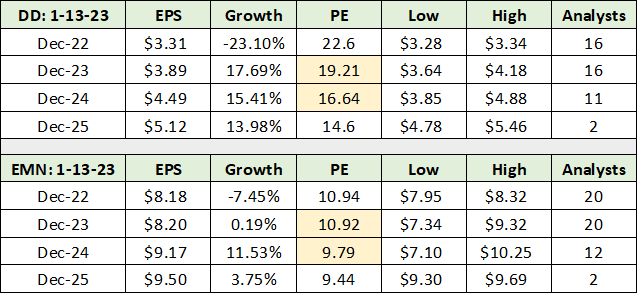
Source: Seeking Alpha. Created by Brian Kapp, stoxdox
I have highlighted in yellow the valuation of each company using consensus estimates for the next two years. Eastman trades at a substantial discount to its blue-chip peer in the materials sector. Given the similarities between the two companies, such a deep discount to DuPont is unwarranted. From the September report:
There is ample historical evidence for Eastman to trade at a mid-teen valuation multiple, similar to DuPont today. This also happens to be a historically normal valuation multiple for stocks broadly. Applying a 16x multiple to the consensus earnings estimates for Eastman into mid-decade results in a price target range of $150 to $190.
While earnings estimates have been reduced into mid-decade since the September report, the reductions for 2024 and 2025 appear overly conservative. As a result, estimates for 2024 and 2025 at the time of the September report may still be achievable. If so, the potential upside price targets would remain unchanged.
Using the lowered estimates into mid-decade, the upside is reduced to the $150 range which represents 65% potential, excluding the dividend. If the prior estimates remain valid, the upside potential is 65% to 109%. Looking at the downside, a retest of the $70 to $80 support zone represents downside potential of -12% to -23%.
Sales Estimates
Comparing consensus sales estimates for DuPont and Eastman illuminates the wide valuation discrepancy between the two companies. The following table displays consensus sales estimates through mid-decade. I have highlighted in yellow the growth rate and in blue the price-to-sales valuation for 2023 and 2024.
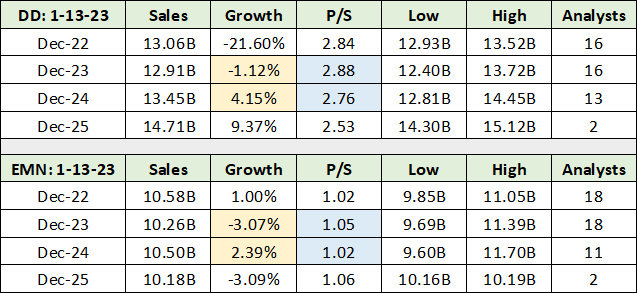
Source: Seeking Alpha. Created by Brian Kapp, stoxdox
Consensus sales growth estimates do not meaningfully diverge until 2025. As a lot can change by then, Dupont’s higher growth estimate for 2025 should be taken with a grain of salt. Also, note that DuPont’s -22% sales growth in 2022 includes divestitures, while also creating a lower starting base from which to grow sales.
If Eastman traded at Dupont’s valuation based on sales, the upside potential would increase to 175%. While such a valuation is highly unlikely to occur, it highlights the depths of Eastman’s steep valuation discount. Furthermore, it fully supports the more moderate upside return potential of 65% to 109% discussed above.
Summary
While there remains near-term risk to earnings given the recessionary backdrop, the downside is well contained both fundamentally and technically. The fundamentals and technicals are in alignment as Eastman’s bull market is nearing full bloom.
Price as of this report: $91.39
Eastman Chemical Investor Relations website