In the recent report, “Is the sun setting on energy stocks?”, I noted that Exxon and Chevron account for 43% of the energy sector as represented by the Energy Select Sector SPDR® Fund (NYSE:XLE). When combined with each company’s premium valuation to the sector, I concluded the following:
Outside of the capitalization-weighted sector fund, there are many asymmetric risk/reward opportunities in the energy space… As a result, a market capitalization-weighted energy portfolio is likely to underperform a more opportunistic approach.
Risk/Reward Rating: Positive
The XLE is trading at 8x next year’s consensus earnings estimates. An excellent representation of the broader energy sector is the SPDR® S&P® Oil & Gas Exploration & Production ETF (NYSE:XOP). State Street reports the PE of the XOP to be 5x next year’s earnings estimates.
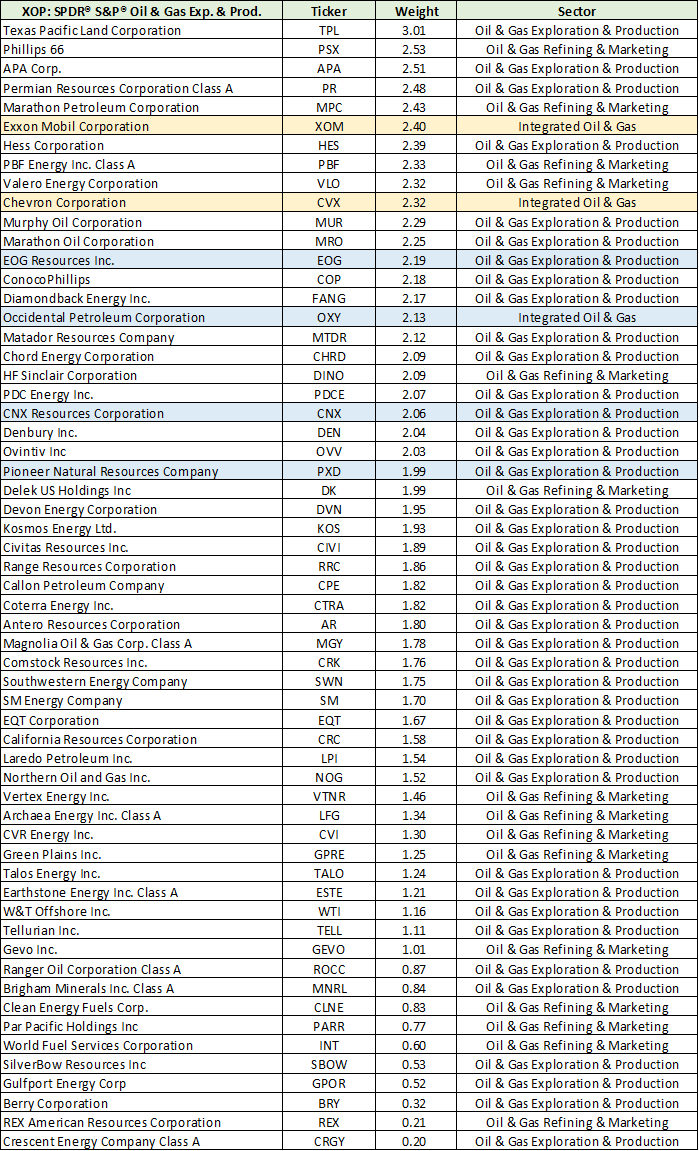
As the six companies highlighted in my last report suggested, valuations across the broader energy sector are deeply discounted compared to the largest firms. Four of the six companies are members of the XOP and are highlighted in blue in the following table. Of note, the XOP does not include energy services and equipment stocks. This is a benefit as the XOP does not overlap with what is “A top sector choice for the coming cycle,” thus enabling greater portfolio control.
A cursory glance at the holdings of the XOP confirms a broad and diversified portfolio in comparison to the XLE (a market cap-weighted portfolio) in which Exxon and Chevron have a 43% weighting. Exxon and Chevron account for just 4.7% of the XOP. The following table displays the XOP companies and their weightings.
For commodity producers, relative valuations are especially relevant given the uniform nature of the product. While premiums are often deserved, they shift throughout the sector across cycles. With the broad sector trading at 5x earnings or a 38% discount to the XLE, equal-weighted approaches such as the XOP offer material upside asymmetry based on multiple expansion alone. From the report, “Is The Sun Setting On Energy Stocks?”:
The energy sector trades at a steep discount to the market, with the S&P 500 trading at 18x 2023 estimates. Conditions remain supportive of continued outperformance with incredible opportunities under the market capitalization-weighted surface.
Of note, compared to the market, the XOP is trading at an extraordinary valuation discount of 72% using 2023 earnings estimates.
Technicals
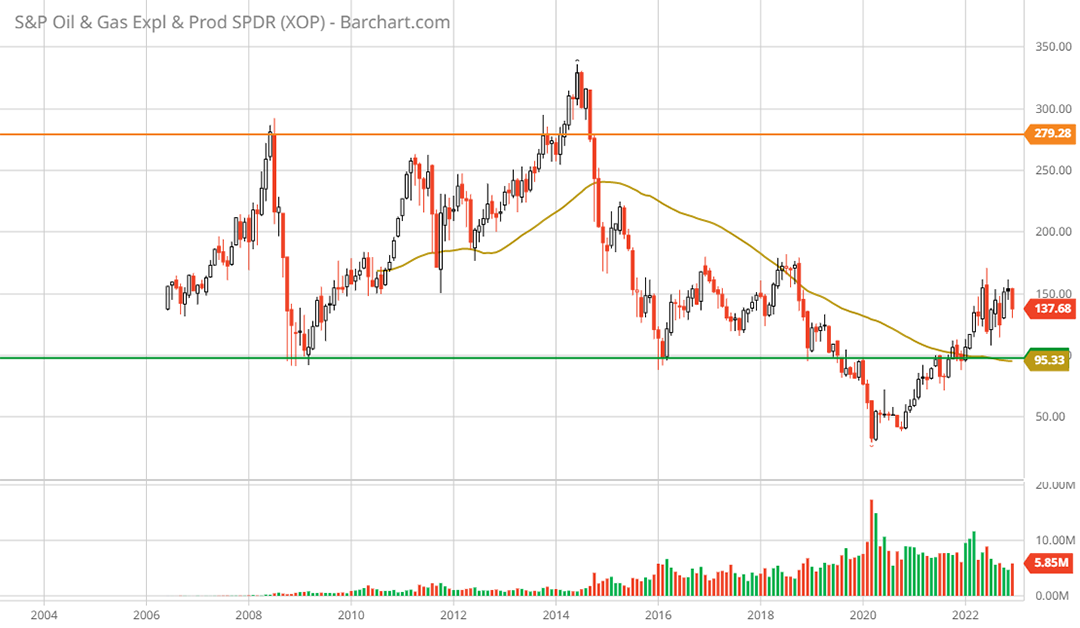
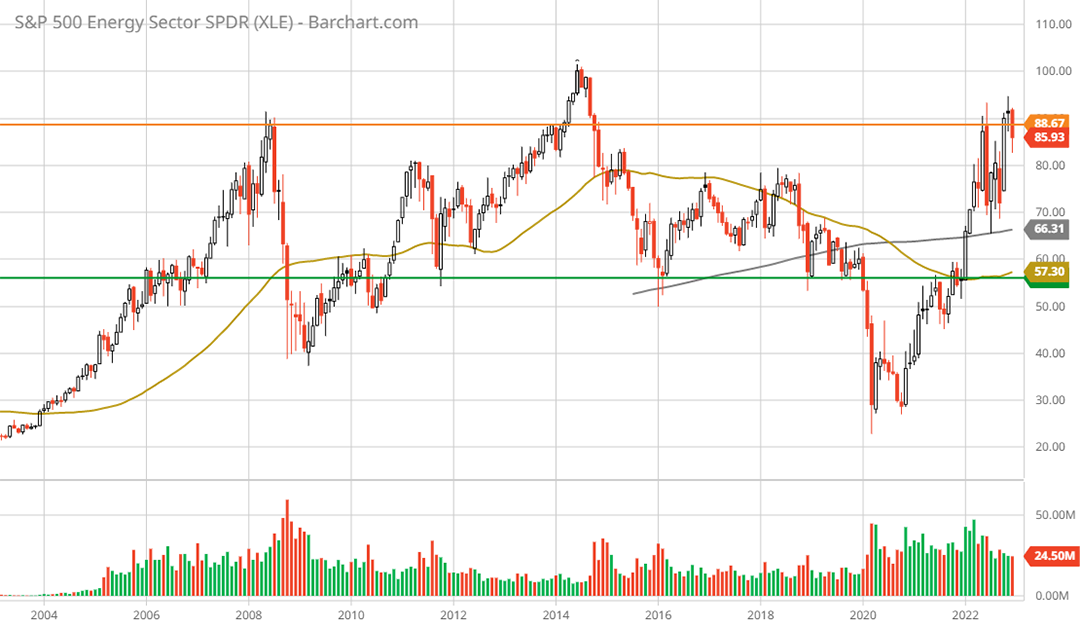
The technical backdrop reflects the valuation asymmetry. A clear view of this can be found in comparing the 20-year monthly chart of the XOP to that of the XLE. The orange line on each chart represents the high reached in 2008. Note that the XOP is 104% away from its high while the XLE is at the high reached in 2008. The first chart is the XOP and the second is the XLE. Additionally, the gold line on each chart is the 50-month moving average.

SPDR® S&P® Oil & Gas Exploration & Production ETF XOP 20-year monthly chart. Created by Brian Kapp using a chart from Barchart.com

Energy Select Sector SPDR® Fund XLE 20-year monthly chart. Created by Brian Kapp using a chart from Barchart.com
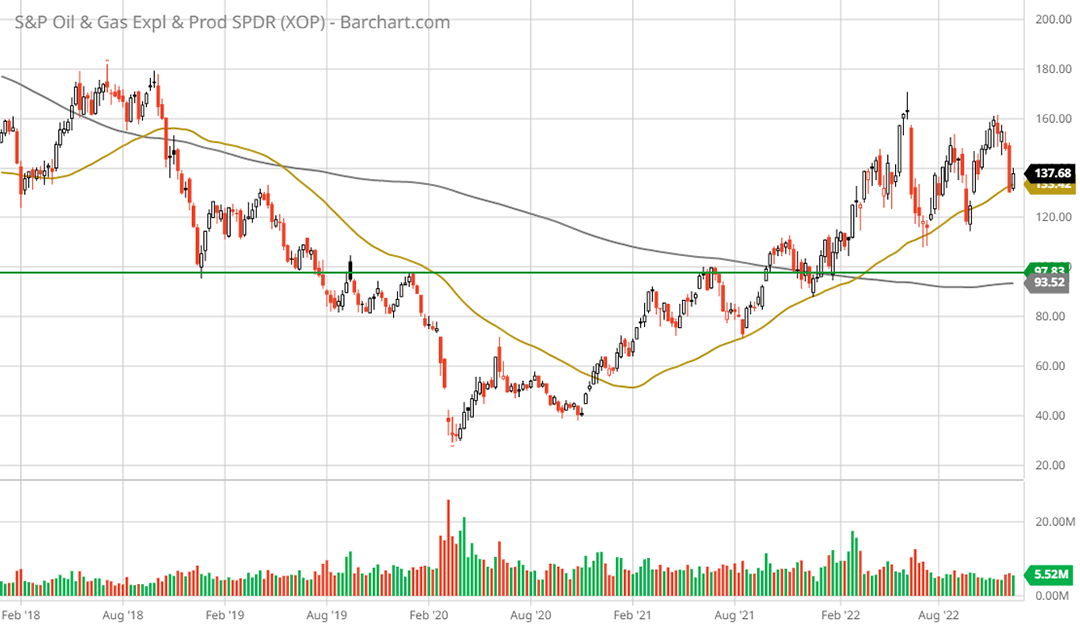
Zooming in to the 5-year weekly chart below, the XOP is in a well-defined uptrend underpinned by the 50-week moving average (the gold line). Interestingly, the XOP remains beneath the levels reached in 2018 while the XLE is solidly above. The XOP is in fact not technically overextended to the upside no matter the timeframe.

SPDR® S&P® Oil & Gas Exploration & Production ETF XOP 5-year weekly chart. Created by Brian Kapp using a chart from Barchart.com
Importantly, notice that the XOP has been trading or basing sideways since Q1 2022. A nine-month consolidation within a bull market trend offers an ideal accumulation opportunity, technically speaking.
Summary
From a technical perspective, the risk/reward asymmetry is decidedly positive for the XOP. With a deeply discounted valuation and a relatively stable to attractive industry outlook, as covered in “Is the sun setting on energy stocks?”, the fundamentals are in alignment. This is especially true relative to the market capitalization-weighted XLE and the broader market as represented by the S&P 500 index. A discount of 38% to 72% combined with a timely technical and sector backdrop offers a uniquely asymmetric and relative oil and gas opportunity for 2023.


