Thank you again for being stoxdox members and for your patience as we work through the contest of the stoxdox brand in front of the US Patent and Trademark Office (USPTO). The most recent call upon our resources to deal with the case consumed much more time than we had projected. That said, the new direction that the case has taken was not unexpected.
It is my hope that we may share with our members the stoxdox, Inc. USPTO case study one day, as it offers many investment lessons which span both time and space. In the meantime, as we remove our legal hats and return our full attention to the investment world, I will ease back in with what I consider to be a no-brainer.
Medtronic
Given the still unfolding recessionary wave rippling through the US and global economy, Medtronic stands out as a high quality, asymmetric risk/reward opportunity. Due to the non-cyclical nature of the company’s sector and industry, Health Care and Health Care Equipment, Medtronic largely dances to its own beat from a macroeconomic perspective.
Technicals
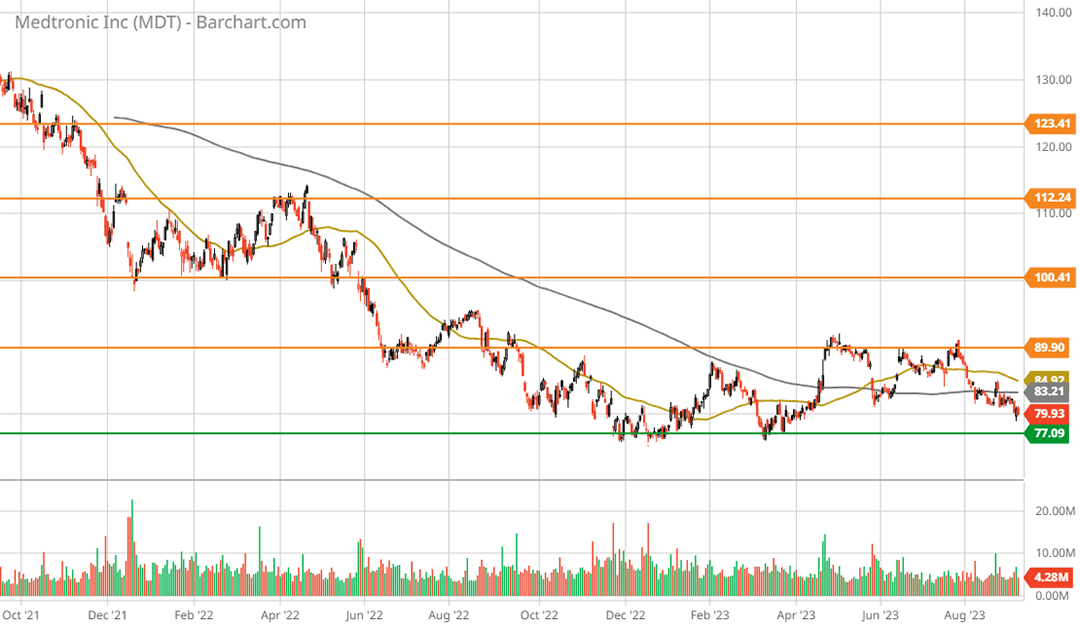
With its blue-chip-like quality, non-cyclical industry backdrop, and consistent execution, taking a technical approach to the Medtronic opportunity is likely to prove the most direct course of action. The following 2-year daily chart best captures the setup for Medtronic. Note that the orange lines denote key resistance levels and the green line denotes the primary support level, which dates back to 2014.
The most glaring feature of the above price action is the yearlong bottoming process that began in September of 2022. To date, Medtronic has carved out a double bottom at the primary support level which it is now retesting.
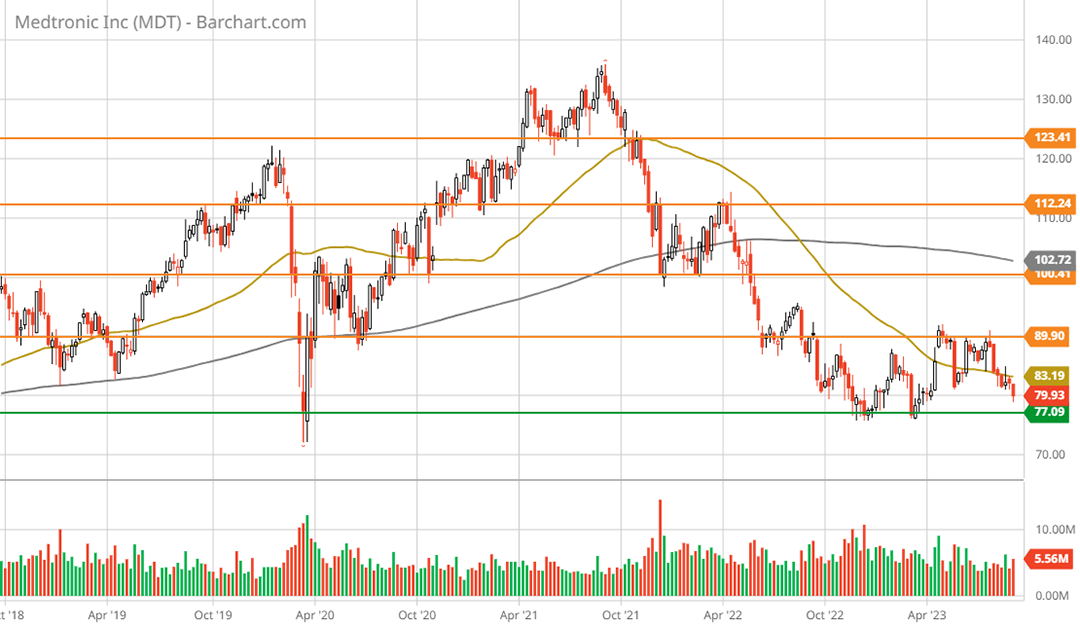
From the perspective of price momentum, importantly, the 50-day moving average (the gold line) crossed above the 200-day moving average (the grey line) on May 22, 2023. Technically speaking, the golden cross points to the likelihood that the bottoming process has nearly run its course. The following 5-year weekly chart places the 2-year daily chart above in a larger context.
Interestingly, Medtronic’s primary support level aligns with the COVID-panic lows of March 2020, which it is now testing. Notice that the 200-week moving average (the grey line) stands near $103, which is 30% higher. Medtronic’s share price is extended well below its longer-term price averages.
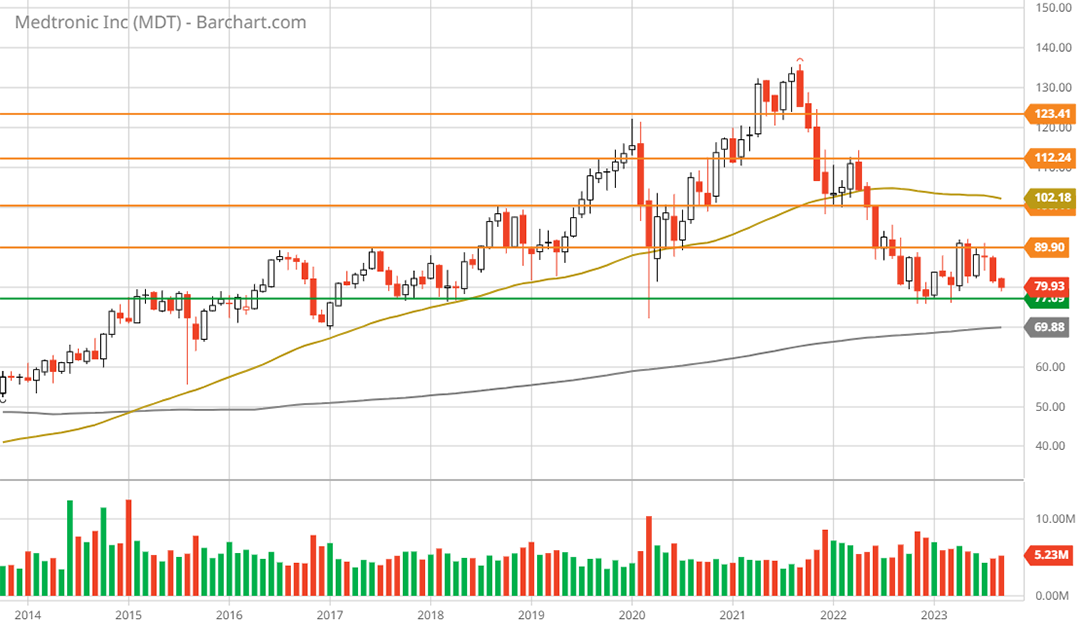
Nearer term, the shares are trading just below the 50-week moving average near $83 (the gold line). The following 10-year monthly chart places the price action in greater context regarding the primary support zone which dates back to 2014.
While support is likely to be quite strong nearby, a lower test of the 200-month moving average near $70 (the grey line) is a distinct possibility. As a result, the 200-month moving average serves as the logical choice as the next lower technical target. The following table displays the potential return spectrum to each of the technical price targets discussed above, including to new all-time highs near $140.
I have highlighted in yellow what I view to be the most likely potential return spectrum looking out two years. Additionally, the return potential to new all-time highs (highlighted in blue) is a distinct possibility. The positive asymmetry on display in the potential return spectrum above finds strong fundamental support.
Consensus Estimates
The strong fundamental support can be seen in the following tables which display consensus earnings and sales estimates through fiscal 2028. In the first table, notice that growth estimates for earnings and sales are incredibly stable, if unexciting, through 2028.
For reference, Medtronic’s 5-year average PE ratio is roughly 21x earnings. The average PE multiple over the past five years aligns with the $123 price target highlighted in yellow in the potential return spectrum above. Keep in mind that I am ignoring Medtronic’s annual dividend in the potential return spectrum, which yields 3.45% per year at the current price.
The next table offers additional color regarding the stability of earnings and sales estimates through mid-decade. Notice the tight range between the low analyst estimate and the high estimate for both earnings and sales through mid-decade.
End Markets
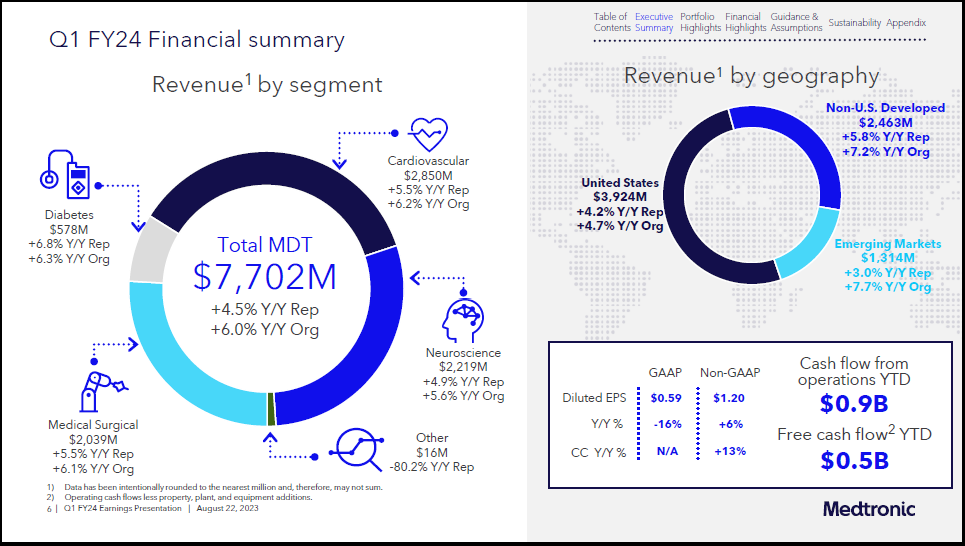
To wrap things up, the following sequence of images from Medtronic’s Q1 2024 earnings presentation provides an overview of Medtronic’s business and end markets. What you will notice in perusing the slides is that Medtronic is well diversified within the Health Care Equipment industry.
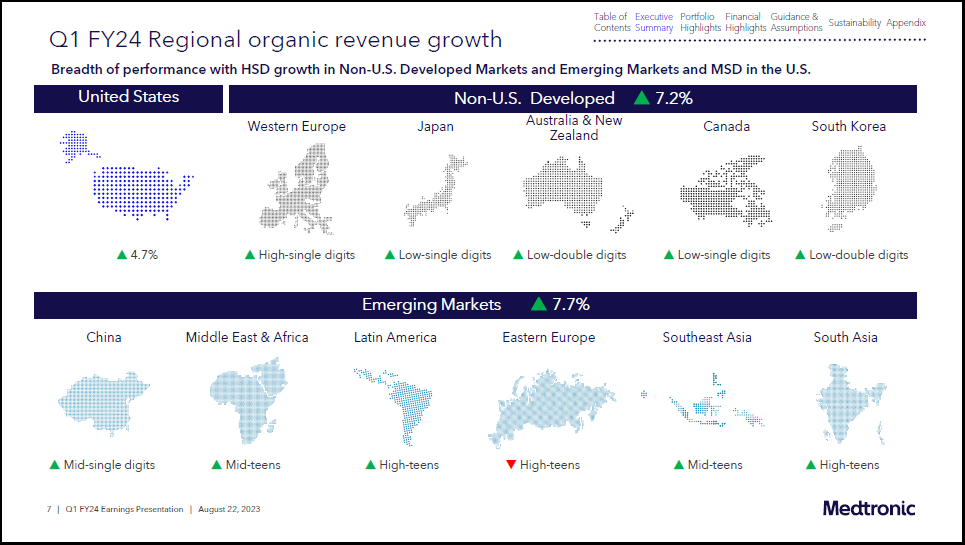
In terms of end markets, as can be seen above, the company is well diversified across cardiovascular, neuroscience, surgical, and to a lesser extent diabetes. Additionally, as can be seen in the next image, Medtronic is well-diversified globally and has excellent growth prospects outside the United States, which accounts for roughly 50% of sales.
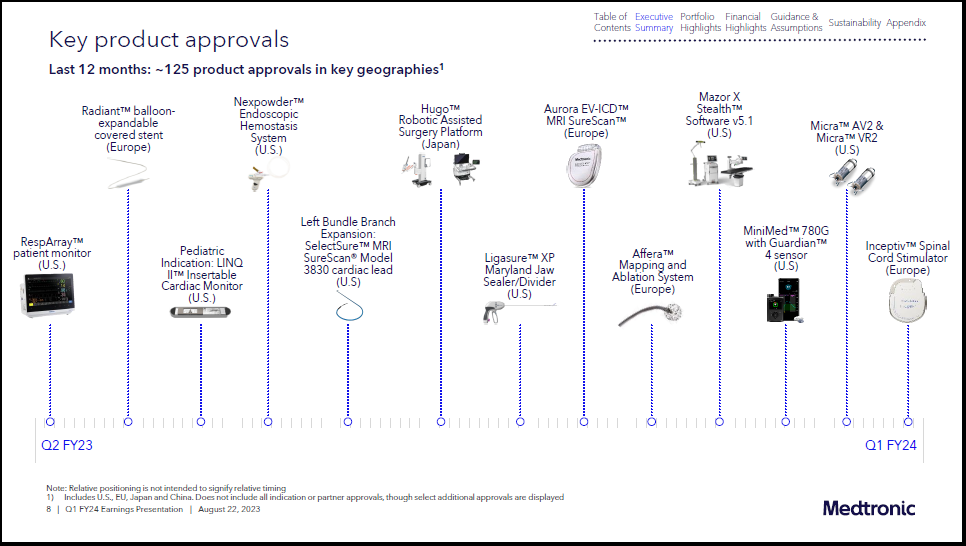
Finally, in the next slide, notice that Medtronic is continually innovating and is executing a high volume of new product releases in the market. The Health Care Equipment industry is highly conducive to innovation thereby introducing upside surprise potential to the potential return asymmetry.
Summary
In summary, if unexciting, Medtronic stands out as a high-quality, asymmetric risk/reward opportunity. The shares are well anchored on the downside, both technically and fundamentally, while the upside potential is substantial and well defined. From a portfolio perspective, Medtronic is a no-brainer for the current market environment.
Price as of this report: $79.55
Medtronic Investor Relations Website


