I am reaffirming a positive risk/reward rating for International Business Machines Corporation (NYSE:IBM) based on the company’s increasingly competitive strategic positioning, it’s growth-focused portfolio, and the resulting higher valuation multiple potential. The risk/reward tradeoff is bolstered by IBM trading near strong long-term technical support levels, its discounted valuation, and a well-above average dividend yield of 4.80%.
Risk/Reward Rating: Positive

Artificial Intelligence
It is safe to say that the US military strives to remain on the cutting edge of technology. In this light, Lockheed Martin’s (NYSE:LMT) press release on October 25, “Lockheed Martin, Red Hat Collaborate To Advance Artificial Intelligence For Military Missions,“ is a positive signal to the markets regarding IBM. The following summary quote from the press release sets the stage for the IBM investment case (emphasis added).
Lockheed Martin and Red Hat, Inc. today announced a collaboration to advance artificial intelligence [AI] innovation at the edge on Lockheed Martin military platforms. Adopting the newly announced Red Hat Device Edge will enable Lockheed Martin to support U.S. national security missions by applying and standardizing AI technologies…
The following is another passage from the press release:
With Red Hat Device Edge, Lockheed Martin is equipping U.S. military platforms… This advanced software enables small platforms to handle large AI workloads…. Lockheed Martin used Red Hat Device Edge on a Stalker UAS… The Stalker used onboard sensors and AI to adapt in real-time to a threat environment.
Lockheed Martin is arguably the leading-edge military contractor. This bolsters the case for IBM establishing a pole position in Artificial Intelligence [AI]. Furthermore, enabling small platforms to handle large AI workloads is the tip of the spear in realizing AI’s full potential as AI interfaces with the real world at the edge.
AI Market Projections
Selecting IBM as a partner in the standardization of AI on Lockheed Martin’s military platforms opens the door to IBM establishing a foundational or platform position within the artificial intelligence ecosystem. The next question becomes: what is the potential size of the AI market?
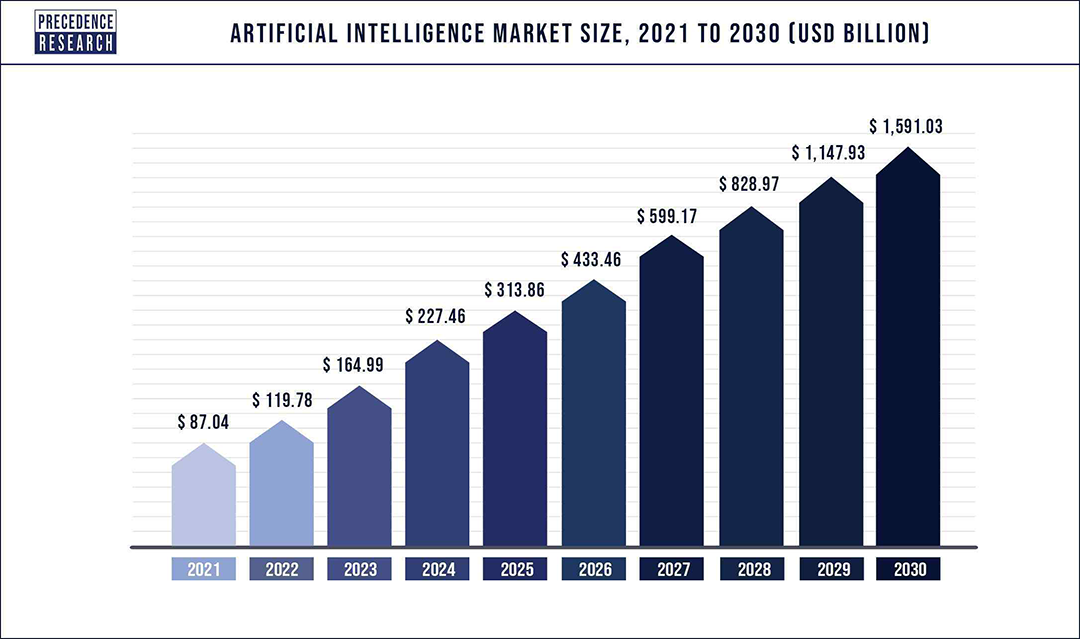
While the ultimate size of the AI market is unknowable, industry estimates gravitate towards an estimated $1.6 trillion annually by the year 2030. From a starting position of approximately $87 billion in 2021, this implies a compound annual growth rate of 38%. The following image from Precedence Research displays their estimate of the market size by year through 2030.
These figures are in line with those of multiple sources as evidenced by Valuates Reports, Grand View Research, Allied Market Research, and Fortune Business Insights™. The AI market offers one of the largest absolute growth opportunities of the current decade at 38% per year. As we are concluding a long technology cycle centered around smartphones, mobility, and multi-media, the growth potential for AI is exceptional from a relative perspective as well.
Furthermore, Accenture (NYSE:ACN) estimates that the AI market will reach a relatively mature state of growth by the year 2030. This is a reasonable expectation on the part of Accenture and suggests that now is the time to invest in AI growth opportunities. We are nearing an inflection point on the AI S-Curve as early adopters give way to mass market adoption. Historically speaking, when new technologies begin the transition to mass market adoption, the risk/reward asymmetry is maximally skewed to the upside.
Quantum Computing
IBM is also a leader in the field of quantum computing. In an IBM research blog post by Jay Gambetta on November 9, “IBM Quantum’s mission is to bring useful quantum computing to the world,” the company states the following:
We said that 2023 would mark a major inflection point in quantum computing… we’re ready to begin realizing the quantum-centric supercomputer, a modular computing architecture which enables scaling, combining quantum communication and computation… while employing hybrid cloud middleware to seamlessly integrate quantum and classical workflows.
While the inflection point that IBM references in the above quote is not a mass adoption phase change, it is an inflection point for early adopters. The significance of quantum computing cannot be understated. Especially when combined with artificial intelligence.
The following passage from the September 2021 IMF article by Tahsin Saadi Sedik, Majid Malaika, Michael Gorbanyov, and José Deodoro, “Quantum computing’s possibilities and perils,” illuminates the extraordinary potential of quantum computing (emphasis added). Please note that the basic unit in quantum computing is called a qubit, whereas in today’s classical computing it is a bit.
Increasing the number of qubits delivers an exponential rise in calculation processing speed… It would take about 18 quadrillion bits of traditional memory to model a quantum computer with just 54 qubits. A 100 qubit quantum computer would require more bits than there are atoms on our planet. And a 280 qubit computer would require more bits than there are atoms in the known universe.
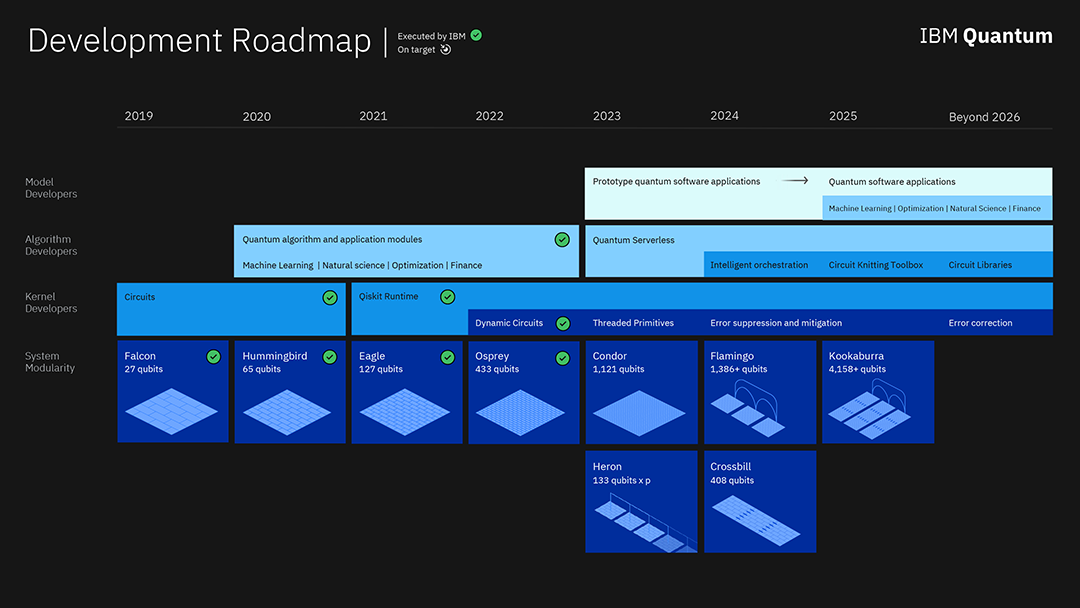
For reference, IBM’s new Osprey is a 433 qubit processor. IBM’s quantum computing roadmap is summarized in the following image. The target for mid-decade is 4,158 cubits.
The following is another passage from the IMF article above:
Quantum computers could crack the cryptography that underpins financial stability… The computing power of these mighty quantum machines could threaten modern cryptography. This has far-reaching implications for financial stability and privacy.
While technical challenges remain, it is clear that the world is entering a new era of computing, which will fundamentally transform our economy and society. The risks and opportunities have never been greater. We are not in Kansas anymore.
Fundamentals
Turning to IBM’s most recent results, the company is executing on its plan. Please note that my prior IBM report on November 9, 2021, serves as a foundation on which this report builds. IBM reported Q3 2022 earnings on October 19, 2022. The results from the Q3 report are summarized below (emphasis added).
- Revenue of $14.1 billion, up 6%, up 15% at constant currency (about 5 points from sales to Kyndryl).
- Software revenue up 7%, up 14% at constant currency (about 8 points from sales to Kyndryl).
- Consulting revenue up 5%, up 16% at constant currency.
- Infrastructure revenue up 15%, up 23% at constant currency (about 9 points from sales to Kyndryl).
- Hybrid cloud revenue (over the last 12 months) of $22.2 billion, up 15%, up 20% at constant currency.
Notice that IBM is generating mid-teens to low-twenties sales growth across its divisions excluding currency effects. This is the purest view of IBM’s business as currency effects are unrelated to business execution. Performance is strong across all segments.
Interestingly, sales to Kyndryl (NYSE:KD) are quite strong. IBM spun off Kyndryl on November 3, 2021. The Kyndryl business unit was a drag on IBM’s growth in recent years as competitors such as AWS, Google, and Microsoft took market share. This was especially the case during Q3 2021, from the November 2021 IBM report:
Customers clearly pulled back from new business commitments with the Kyndryl unit until after the separation.
From a customer perspective, the reacceleration of sales through the Kyndryl channel is a positive signal for IBM, if qualitative in nature. The reasoning is that Kyndryl can now sell non-IBM solutions as a stand-alone company and has since partnered with industry leaders such as AWS, Google, and Microsoft.
Kyndryl is now incentivized to offer its customers the best solutions from the entire tech industry rather than just IBM. The fact that customers are choosing IBM solutions in a purely competitive environment is a strong signal for IBM’s increasing competitiveness. It may be that Kyndryl can more easily sell IBM solutions outside of IBM than within it as it is no longer viewed as having conflicts of interest.
Valuation: Consensus Estimates
In the November 2021 IBM report I estimated IBM’s normalized earnings per share run rate to be near $8.43 excluding Kyndryl. This offers a reference point for current consensus estimates. The following table was compiled from Seeking Alpha and displays consensus estimates into mid-decade.
The consensus estimate is for earnings to grow 14% in 2022. Compared to my normalized estimate of $8.43, the consensus earnings estimate would represent just over 7% growth. This is more in line with growth estimates for 2023 and 2024 which are in the mid-6% range. Given the exceptional sales growth excluding currency effects in the most recent quarter, earnings estimates look to be conservative, thereby opening the door to upside surprises.
What is most interesting is consensus growth estimates for 2025 and 2026. The consensus estimates for these years hint at the growth potential discussed under the artificial intelligence and quantum computing sections.
Recall from above that the AI market is expected to grow by 38% per year through 2030 and that Accenture projects AI to be in a mature growth stage by the end of the decade. I infer that the market may be underestimating IBM’s AI growth potential in the 2023 and 2024 time period.
Additionally, given the truly disruptive potential of quantum computing, the market may be underestimating IBM’s growth potential in the mid-decade time frame as well. The following table was compiled from Seeking Alpha and displays consensus sales estimates for IBM through 2026.
IBM is expected to grow its sales by just 5% annually through 2026. This is a paltry growth rate and confirms that consensus estimates, or the market, envisions little to no growth for IBM. From a qualitative perspective, I can confirm that the vast majority of investors have a negative opinion towards IBM’s stock. In fact, I am personally aware of only one professional that has a positive view of IBM.
This is an ideal setup as the vast majority of investors are still focused on the winners of the last technology cycle, such as Amazon, Google, and Microsoft. The surprise potential embedded in IBM’s share price is decidedly to the upside while consensus growth estimates offer a low hurdle rate.
Relative Valuation
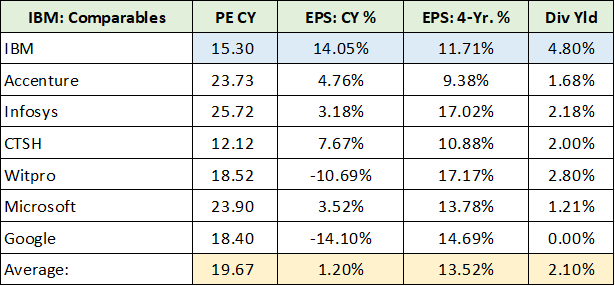
In addition to the low hurdle rate, IBM is relatively attractive compared to its peer group. The following table, compiled from Seeking Alpha, compares IBM to its peer group in addition to Google and Microsoft. Please note that CY stands for current year and 4-Yr. % represents the consensus estimate for annual earnings growth over the next four years from that expected for the current year.
I have highlighted IBM in blue and the average for all companies in yellow. What we can say is that IBM is trading at a 29% discount to the group average on a PE basis and offers an income stream that dwarfs the group at 4.8%. While IBM’s earnings growth per year is expected to be below the group at 11.71%, it is not materially different than the 13.52% average. Additionally, IBM’s earnings growth in the current year is the highest of the group.
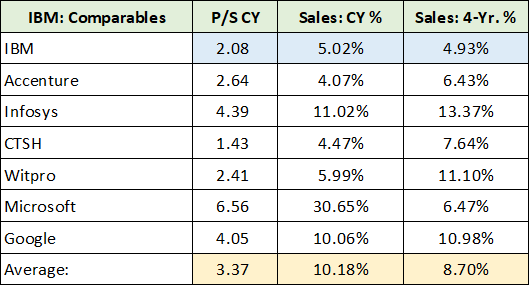
Using sales as the valuation metric, the numbers are more extreme. The following table was compiled from Seeking Alpha and presents consensus sales estimates for the group. I have used the same highlighting scheme. Notice that IBM is valued at a 62% discount to the group average on a P/S or price-to-sales ratio.
The difference in sales growth expectations is equally extreme. IBM is expected to grow sales at roughly half the rate of the group in both the current year and in the following four years. This speaks to the low expectations for IBM in the market. The fact that IBM has a leadership position in two of the largest technology growth opportunities of our time stands in stark contrast to these lowly expectations.
Technicals
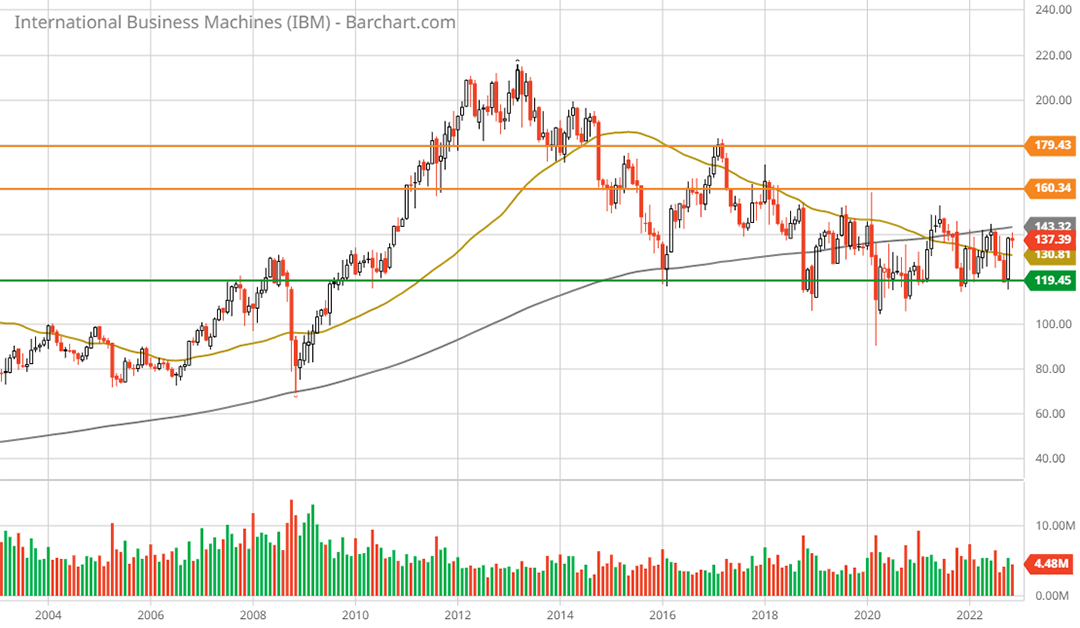
IBM’s low expectations, or low hurdle rates, create upside asymmetry for the stock. This fundamental asymmetry to the upside is mirrored in IBM’s technical backdrop. The following 20-year monthly chart offers a bird’s eye view of the technical setup. Please note that the green horizontal line represents what should be an extraordinarily strong long-term support level. The orange lines depict the key resistance levels.
IBM is sitting just 13% above a decade-long support level. The upside potential to the two resistance levels is 17% and 31% respectively. For further upside targets, please see my November 2021 report.
Recall from earlier that IBM is dramatically outperforming the broad market and technology sector over the past year. IBM has assumed a performance leadership position in the technology sector regardless of whether market participants acknowledge the regime change.
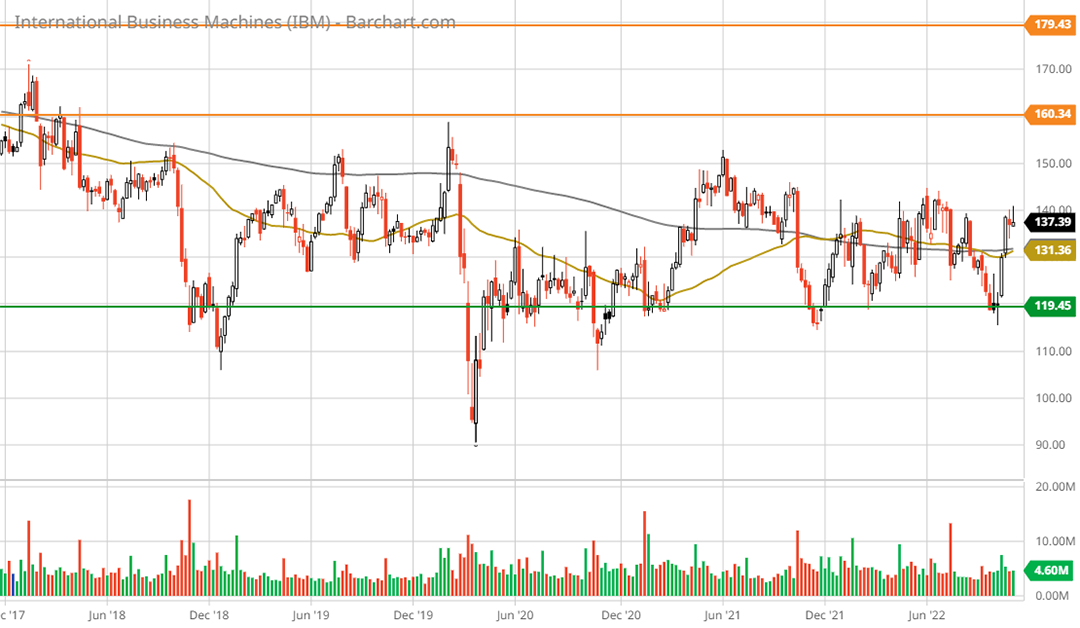
Note that the grey and gold moving averages on the above chart represent the 200-month and 50-month moving averages, respectively. The 50-month moving average has slipped beneath the 200-month moving average for the first time in 20 years. This suggests the shares are quite oversold on a long-term basis. The following 5-year weekly chart offers a closer look.
On the above chart, the moving averages are the 200-week (grey line) and 50-week (gold line) averages. Notice that the 50-week moving average is crossing above the 200-week moving average. This is a bullish technical signal as it points to a longer-term trend change from down to up. All told, from a technical perspective, IBM should have extraordinarily strong support on the downside while the upside remains unbounded.
Summary
The risk/reward asymmetry is decidedly to the upside for IBM. This is the case from a fundamental as well as a technical perspective. The company’s increasingly competitive strategic positioning and its growth-focused portfolio open the door to upside surprises compared to the market’s meager expectations. When combined with IBM’s leadership position in two of the largest growth opportunities of our time, artificial intelligence and quantum computing, IBM stands out as a top choice in the technology sector.
Price as of report date 11-9-21: $137.39
IBM Investor Relations Website: IBM Investor Relations


