I am assigning International Business Machines Corporation (NYSE:IBM) a positive risk/reward rating based on the company’s strategic realignment toward a synergistic, growth-focused business portfolio, the resulting higher valuation multiple potential, and its deeply discounted relative valuation. The risk/reward tradeoff is bolstered by IBM trading near strong long-term technical support levels. Additional downside protection is provided by the company’s 5.3% dividend yield.
Risk/Reward Rating: Positive
IBM lost 15% of its value in the days following its Q3 2021 financial report on October 20, 2021. Investors were primarily disappointed by the company missing the consensus revenue estimate by 1% or roughly $200 million. The cause of the slight revenue disappointment was weakness in the company’s managed infrastructure services unit within its Global Technology Services business segment. IBM finalized the spinoff of this unit into a new company called Kyndryl (NYSE:KD) on November 3, 2021. The corporate reorganization was well telegraphed and was in the works since October 8, 2020. Customers clearly pulled back from new business commitments with the Kyndryl unit until after the separation.
Growth Portfolio
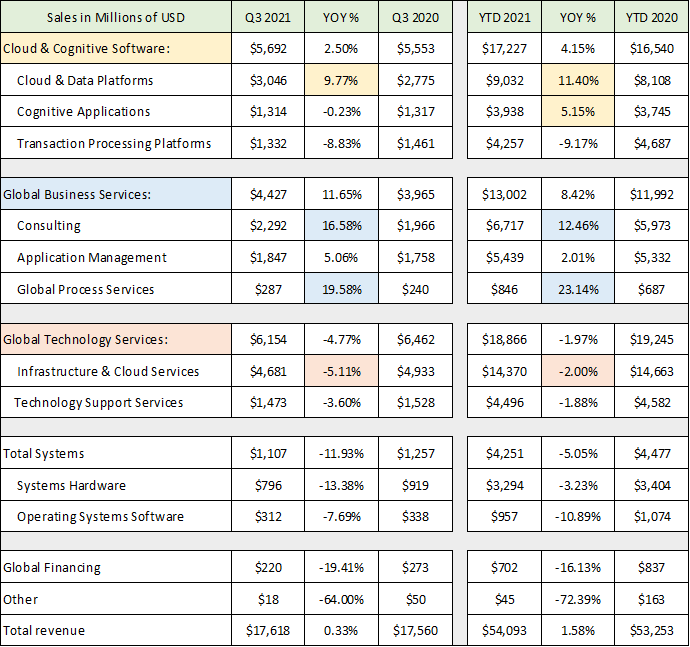
The Q3 revenue miss and resulting 15% decline in IBM’s share price overshadowed many positive structural developments within the business. IBM provided solid guidance for the medium term featuring a renewed confidence in revenue growth and strong free cash flow generation. The transformation to a growth-focused portfolio is evidenced by disaggregating IBM’s results to uncover its business segment trends. The following table was compiled from IBM’s Q3 2021 10-Q filed with the SEC and depicts the revenue performance for each business segment through Q3 2021 (YOY=year-over-year and YTD=year-to-date).
Source: Created by Brian Kapp, stoxdox
I have highlighted the primary business segments. The standout performers through the first three quarters of 2021 are in IBM’s Global Business Services segment and are highlighted in blue. Global Process Services posted 23% growth so far in 2021 off of a relatively small base for IBM. There remains incredible growth potential here as IBM’s consulting, software, and AI offerings are leveraged by customers to automate business processes and optimize workflows. The measurable and sustained return on investment here facilitates shorter sales cycles resulting in higher margins.
Strength in the Consulting unit is evidenced by 17% revenue growth in Q3 and bodes well for future growth across IBM’s entire portfolio. Consulting is best viewed as a leading indicator from a portfolio perspective as implementations generally follow customer consulting engagements. Pointing toward future software growth is IBM’s Red Hat consulting business which reported 180 new customer engagements in Q3. For comparison, in Red Hat’s last quarterly report prior to being acquired, the company reported 90 new customers. This is an indication that IBM’s global reach and customer relationships are deepening Red Hat’s traction and accelerating growth.
The largest upside potential for IBM resides in the Cloud & Cognitive Software segment which is highlighted in yellow. The Cloud & Data Platforms unit is the growth driver with revenue up 11% through Q3 2021. It is led by Red Hat which IBM strategically acquired in 2019. Red Hat offers IBM a solid foundation for growth while differentiating the company’s core hybrid cloud strategy. In the Q3 investor presentation, IBM disclosed that the entire Red Hat business is up 17% in 2021. The OpenShift platform within Red Hat is leading the way with recurring revenue growth of 40% in Q3.
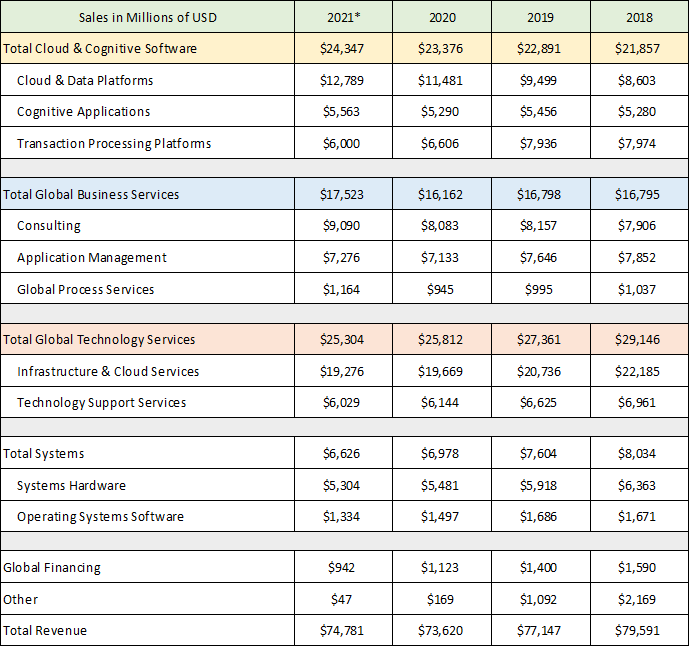
The orange highlighted cells represent the business unit that was just spun off as a separate company, Kyndryl. This unit accounts for approximately 25% of IBM’s total sales and represents a substantial change for IBM’s future business mix. The -5% revenue contraction in Q3 2021 is in line with the annualized contraction of the business over the past three years. With the spinoff complete, IBM has removed the largest drag on its growth rate. The following table provides a view of this drag and places the performance of IBM’s business segments in an annual context. The table was compiled from IBM’s Q3 2021 10-Q, and 2020 10-K filed with the SEC (the 2021* column represents the results through Q3 2021 annualized).
Source: Created by Brian Kapp, stoxdox
The annual trends compared to the results through Q3 2021 discussed above confirm a steady growth trajectory for the Cloud & Cognitive Software segment (the yellow highlighted row). Similarly, a steady decline for the Global Technology Services segment (which housed the Kyndryl spinoff) is confirmed (highlighted in orange). The 2021 performance of the Global Business Services segment is a distinct trend change, from flat results in recent years to exceptional growth in 2021. This will be an important trend to monitor given this segment’s potential for leading to more broad-based growth across IBM’s portfolio.
Global Business Services
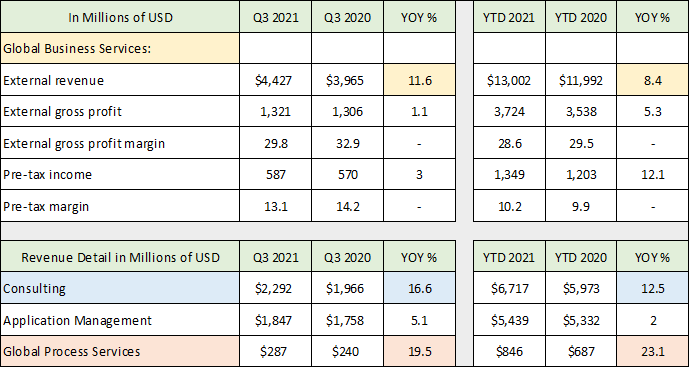
IBM’s Global Business Services segment is a valuable operation in many respects. Internally, the segment can drive business across IBM’s portfolio of solutions. Externally, the group provides IBM a competitive advantage in the marketplace by offering deep expertise and strong customer relationships. If the strong upward trajectory change here can be sustained, this business segment may begin to be valued more in line with its global peers. The following two tables were compiled from the same SEC filings as above and display the economics of the primary segments in more detail (External removes intercompany effects).
Source: Created by Brian Kapp, stoxdox
I have highlighted the pertinent revenue growth cells. One of the challenges in reviewing the IBM investment case is finding comparable companies for a real-time relative valuation comparison. If the excellent growth trends continue for the Global Business Services segment, a blue-chip comparable company like Accenture (NYSE:ACN) could be in order. IBM’s gross profit margins shown in the above table are similar to those of Accenture’s, while pre-tax profit margins are lower. With further efficiency potential within the IBM organization evident, it is likely that IBM has material margin improvement potential given its renewed focus.
Cloud & Cognitive Software
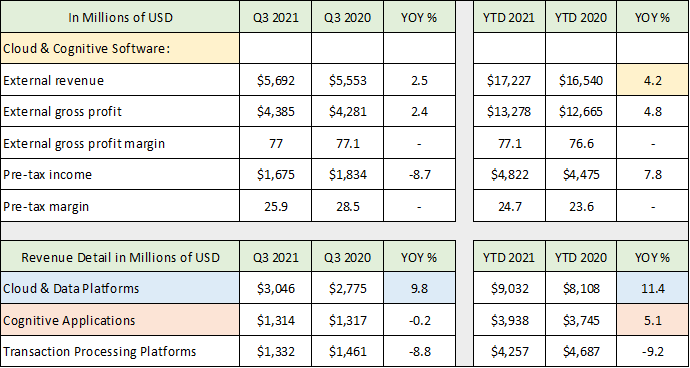
The Cloud & Cognitive Software segment produces excellent profit margins. Similar to the Global Business Services segment, gross margins are on par with those of other blue-chip enterprise technology companies, while pre-tax margins lag. It is highly likely that IBM can expand pre-tax profit margins to bring them in line with its peers. The following table provides greater detail about this segment.
Source: Created by Brian Kapp, stoxdox
Overall growth of 4% in 2021 is in line with the growth rate in recent years and is subdued considering that Red Hat is producing 17% growth in this segment (the yellow highlighted cells). The lackluster growth is due to the Transaction Processing Platforms unit. It is experiencing a transition as customers are preferring to pay in real time rather than through larger upfront expenditures. This is a common trend today and does not appear to be a cause for alarm. Red Hat growth looks to remain robust. Cognitive Applications should offer fertile ground for growth acceleration with AI and automation front and center in the global business community. Given the bright outlook, this segment could begin to be valued more in line with its global peers. Oracle (NYSE:ORCL) may offer an excellent comparable for valuation purposes from a size, quality, and profitability standpoint.
Red Hat
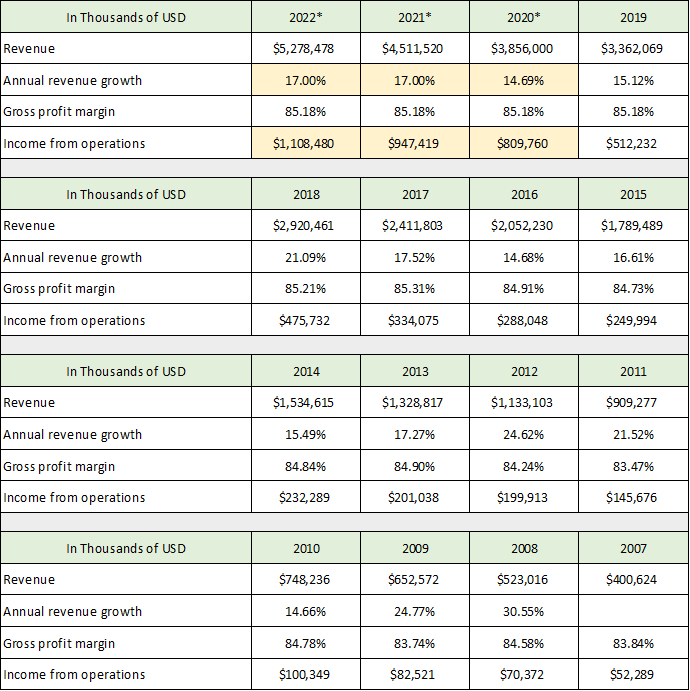
IBM announced the $34 billion acquisition of Red Hat in October 2018 and closed the deal in July of 2019. The purchase was in cash for which IBM incurred a substantial amount of additional debt. The acquisition increasingly looks like a game changer for IBM as Red Hat is driving growth in its primary Cloud & Cognitive Software segment as well as in the Global Business Services segment. The following table was compiled from Red Hat’s 2019 10-K, 2016 10-K, 2013 10-K, and 2011 10-K filed with the SEC. It provides important background information about the Red Hat business and its long-term trends. Please note that the 2020*, 2021*, and 2022* columns are my extrapolations of the Red Hat business using pre-existing trends and IBM’s growth rate disclosure.
Source: Created by Brian Kapp, stoxdox
I have highlighted in yellow a likely trajectory for the Red Hat business under IBM’s ownership. Fiscal year 2022 (2022*) for Red Hat would have ended in February 2022 if it were a stand-alone company. The income from operations data highlighted in yellow represents an adjusted operating income figure that is in common use today. It excludes stock-based compensation and is before taxes. The historical data includes stock-based compensation expense.
The $34 billion acquisition price was at 31x the estimated 2022 adjusted operating income figure and 6x 2022 estimated sales. IBM looks to have purchased Red Hat at a bargain price compared to valuations in the market today for cloud and software companies. Furthermore, IBM’s total company debt service cost (interest expense) in 2020 was $1.3 billion while the company generated $74 billion in revenue. Red Hat alone, with an estimated $5.3 billion of sales and $1.1 billion of adjusted operating income, could be sufficient to service all of IBM’s debt. I mention this because IBM’s debt levels are elevated, and investors must reach a comfort level with the company’s use of leverage if they are considering the IBM investment case.
The notable aspect of the Red Hat business is the incredible consistency of growth throughout time as evidenced by the annual revenue growth rate rows. Red Hat has achieved an annualized revenue growth rate of 18% since 2007, with no indications of slowing. Given the relatively small size of Red Hat at an estimated $5.3 billion revenue run rate, I see no reason why this steady growth cannot continue in the years to come. It is even possible that revenue could accelerate for Red Hat given IBM’s global breadth and depth in the marketplace. The secular trend and business case for companies to pursue a hybrid cloud strategy using open architectures creates an opportunity for acceleration in the Red Hat business under IBM’s leadership.
Cloud
Looking toward the future, the opportunity for continued growth is robust. IBM estimates that the corporate migration to the cloud is only 25% complete. Furthermore, it is highly likely that large corporate clients will choose a long-term hybrid cloud strategy as the optimal path. This choice will play directly into IBM’s core strategy as outlined in its 2020 10-K:
IBM’s focus will be on our open hybrid cloud platform…This platform facilitates the deployment of powerful AI capabilities to enable the power of data, application modernization services and systems…Our approach is platform-centric and differentiated by Red Hat OpenShift, our market-leading open platform, along with a vast software portfolio modernized to run cloud-native and our GBS expertise that drives platform adoption.
There are early signs of success for the execution of IBM’s core hybrid cloud platform strategy. The following table was compiled from IBM’s Q3 2021 10-Q and breaks out cloud-specific revenue in each of IBM’s primary business segments.
Source: Created by Brian Kapp, stoxdox
Notice the incredible growth rates coming out of the Global Business Services segment highlighted in blue. If this segment drives platform adoption and is a leading indicator for the IBM portfolio, 38% growth in Q3 and 35% YTD in 2021 is a powerful signal. The Cloud & Cognitive Software segment saw growth of 28% YTD in 2021. Given the size of these business units, these growth rates are impressive.
Comparable Valuation
With IBM’s reorganization complete, the remaining business segments discussed above operate in industry segments which generally support higher than average valuation multiples. While IBM certainly has work to do, the Cloud & Cognitive Software segment and the Global Business Services segment are performing well and offer excellent competitive positioning looking forward.
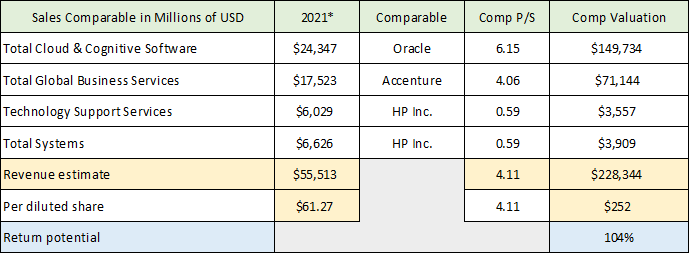
Given IBM’s low valuation and generally bright prospects, the upside return potential can be quantified using a comparable company approach. If sentiment shifts from bearish to bullish for IBM these comparable valuations are likely to be reasonable targets. The following table values IBM’s business segments using price-to-sales values applied to comparable companies (the Comp P/S column) including Oracle, Accenture, and HP Inc. (NYSE:HPQ). Please note that I have estimated 2021 full year sales for IBM (the 2021* column).
Source: Created by Brian Kapp, stoxdox
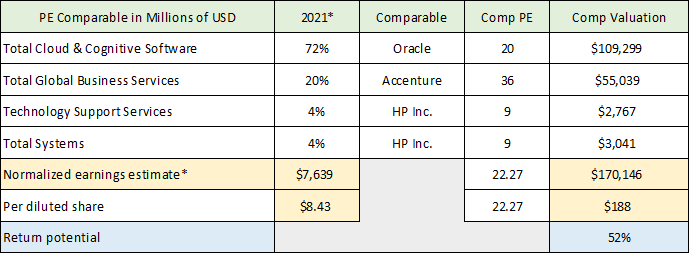
Using a valuation based on sales, IBM offers a potential 104% return at $252 per share. This would require sentiment in the marketplace to shift from bearish to bullish on IBM’s prospects. In the following table I use the same comparable companies and apply their price-to-earnings multiples (the Comp PE column) to each of IBM’s segments. Please note that I have estimated normalized earnings for each of IBM’s segments using recent margin trends and applying a 15% tax rate (the 2021* column).
Source: Created by Brian Kapp, stoxdox
I have estimated normalized earnings per share for IBM at $8.43 per share. The blended PE ratio of the comparable group is 22x the consensus 2021 earnings estimates. This produces a 52% potential return target. My earnings per share figure is likely underestimated offering further credence to the upside potential if investors turn more bullish on IBM.
Guidance
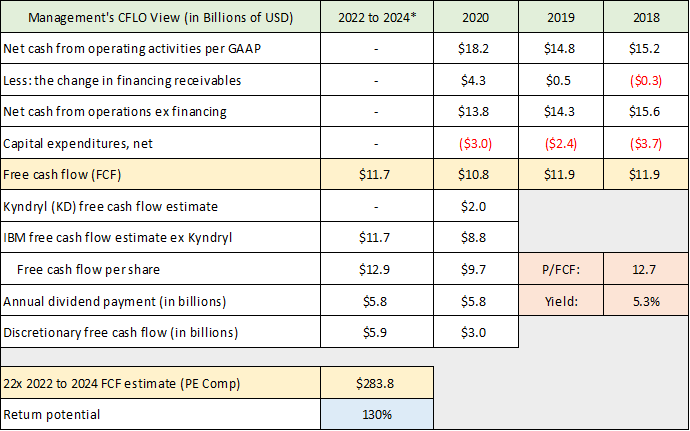
Management provided quantitative medium-term guidance in the Q3 2021 investor presentation. The company expects to generate $35 billion of free cash flow from 2022 through 2024. This works out to an average of $11.7 billion per year. My estimate of IBM’s free cash flow in 2020 (excluding the Kyndryl unit) is $8.8 billion. The free cash flow guidance points toward the pre-tax profit margin improvement potential discussed in the segment detail section. This level of free cash flow is outside the potential expected based purely on the sales growth guidance.
The company guided for annual revenue growth in the mid-single digits over the medium term. Based on the segment performance discussed above, this should be an achievable growth target. Furthermore, this target looks to offer upside surprise potential. The following table was compiled from IBM’s 2020 10-K and the Q3 investor presentation and displays management’s view of IBM’s cash flow. The 2022 to 2024* column includes management’s $11.7 billion average annual free cash flow guidance with the remaining cells containing my estimates.
Source: Created by Brian Kapp, stoxdox
I have highlighted in orange IBM’s current dividend yield and my estimate of the 2020 price-to-free cash flow (P/FCF) multiple excluding Kyndryl. If IBM achieves its $11.7 billion annual free cash flow target alongside a bullish sentiment backdrop, the upside potential is material at 130% (the blue highlighted cell). This upside potential is based on the comparable company PE multiple of 22x from above and applying it to IBM’s free cash flow, which is an excellent earnings proxy.
Technicals
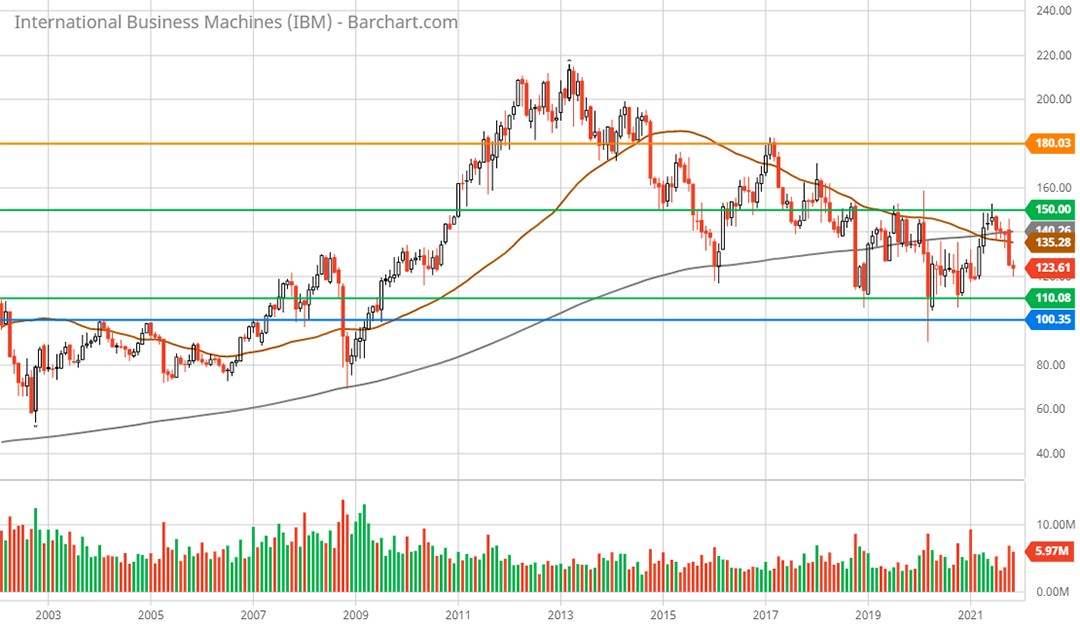
With upside potential ranging from 52% to 130% over the medium term and the downside risk supported by a discounted valuation and large dividend yield, the technical backdrop completes the picture for IBM. The following 20-year monthly chart provides a long-term perspective for IBM’s shares. The horizontal lines represent key long-term support and resistance levels.
IBM 20-year monthly chart. Created by Brian Kapp using a chart from Barchart.com
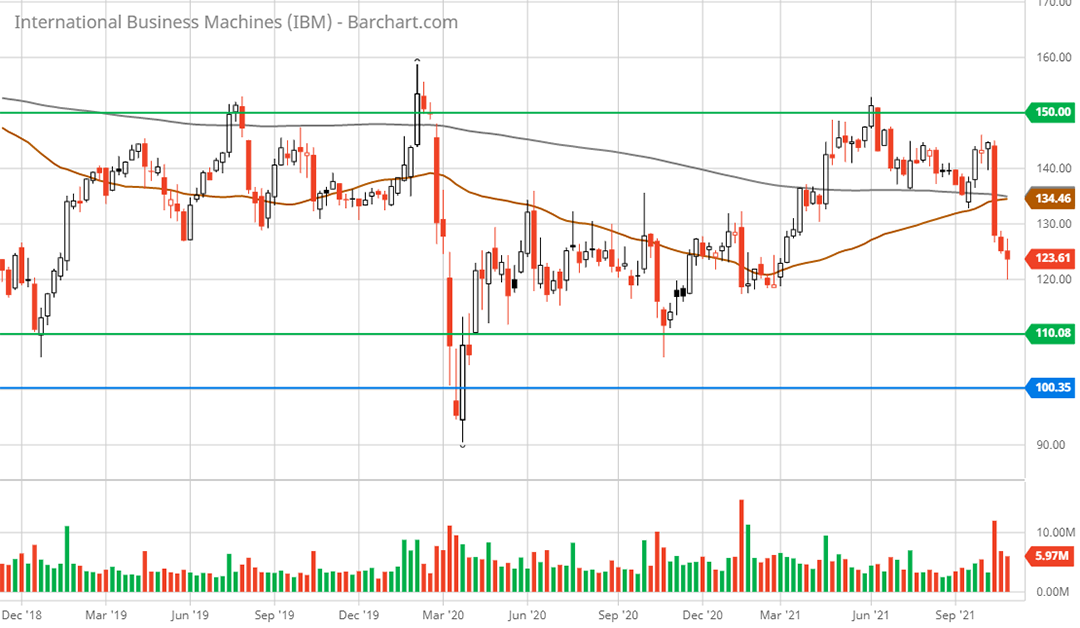
The two green lines bracket the primary trading range for IBM since 2015. The lower green line near $110 has served as the monthly floor price for over a decade and represents 10% downside risk from current levels. This should remain a firm support level and confirms the limited downside risk suggested in the fundamental analysis. The next lower support level is near $100 at the blue line, which is 20% lower, and looks to represent a floor price as things stand. The $100 level was briefly tested on a weekly basis during the COVID crash in March 2020. The 3-year weekly chart below provides a closer look at this near-term range.
IBM 3-year weekly chart. Created by Brian Kapp using a chart from Barchart.com
Resistance has been met near $150 at the upper green line since 2018 and represents 22% upside. This level is the first major hurdle. There is little in the way of technical resistance prior to reaching $150, which opens the door to a relatively frictionless 22% move higher.
If IBM can overcome the $150 zone, the next resistance level stands near $180 at the orange line on the 20-year monthly chart. This is likely to represent stiff technical resistance. It is near the first upside target of 52% or $188 arrived at in the fundamental analysis discussion.
The alignment between the first fundamental resistance level and this second technical resistance level should create a battleground for the IBM bull case. Given the lack of trading above $150 over the past three years as evidenced by the 3-year weekly chart above, the move from $150 to the $180 zone could be rapid if $150 is overcome.
The technical and fundamental backdrop strongly support an expected price range of $110 to $180 for IBM, representing an attractive risk/reward range of -10% to +52% over shorter time periods. Over the medium term, the upper fundamental price target potential of $252 to $284 adds to the risk/reward asymmetry. There should be little technical resistance above $180 given the proximity to all-time highs just above $200 and the lack of trading in this range since 2014. If the $180 level can be overcome, the pathway should be clear to test the higher fundamentally-derived return targets of +102% to +130%. When combined with an estimated downside return potential in the -10% to -20% range, IBM offers an excellent risk/reward proposition.
Summary
IBM offers a rare asymmetric risk/reward opportunity. The shares are unbounded to the upside while the downside is anchored by strengthening fundamentals, an incredibly low valuation, and long-term technical support.
The investment case for future growth at IBM receives strong support from the Red Hat acquisition. Red Hat provides a differentiated growth foundation for IBM’s core hybrid cloud strategy in the enterprise technology space while offering a distinct competitive advantage. When combined with IBM’s AI intellectual property and the breadth and depth of its cognitive software offerings, IBM has arguably assembled one of the most attractive forward-looking enterprise IT portfolios.
IBM’s Global Business Services segment and its consulting practice offer a powerful competitive advantage in delivering IBM’s solutions to the marketplace. The global reach and depth of expertise across industry verticals is unmatched. Consulting is the tip of the spear for IBM’s business. The 2021 trend change towards exceptional growth in this segment is a leading indicator for growth across IBM’s entire portfolio. The inflection point provides early evidence of success for IBM’s transformation and the dawn of a new growth era.
Price as of report date 11-9-21: $123.27
IBM Investor Relations Website: IBM Investor Relations


