When it comes to commodities, the technical setup is especially informative. Price and volume are the main factors, which react to physical supply and demand conditions in the market. In the October 19, 2021 report, “Barrick Gold is on the efficient frontier,” I summarized the technical setup for copper as follows (emphasis added):
While the $4 level is extended to the upside compared to the next two lower support levels, it should offer fairly firm support given the bullish fundamentals. Next lower support near $3.27 should offer strong support if it is retested. It looks to be the floor for the foreseeable future.
Copper Technicals
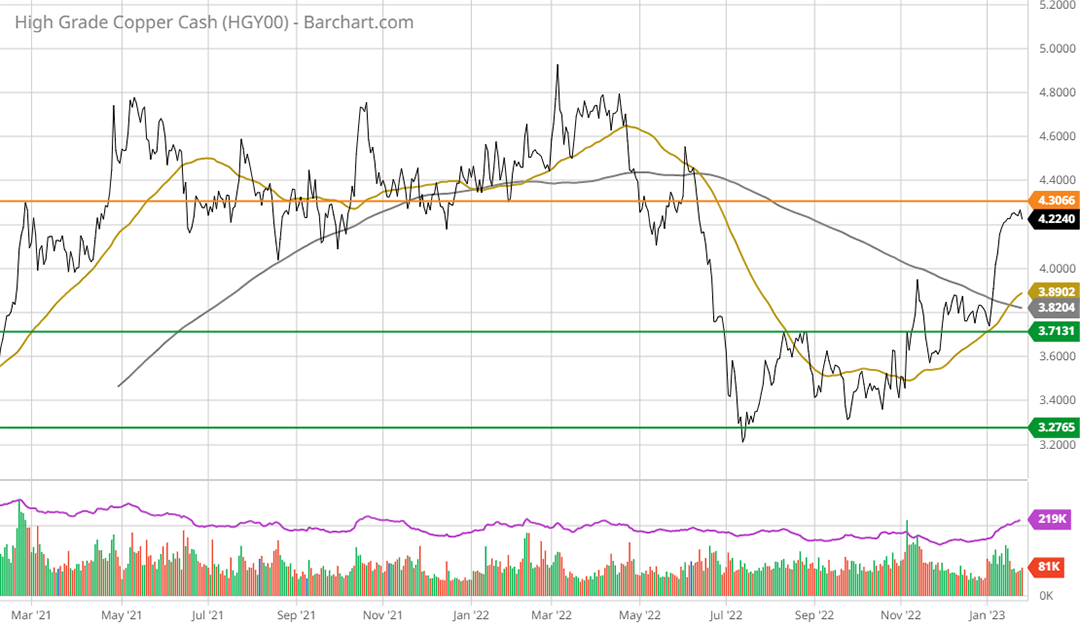
At the time of the Barrick (NYSE:GOLD) report, copper was trading at $4.73 and attempting a breakout to new all-time highs. The following 2-year daily chart displays the price action of copper following the October 2021 report. Notice that copper formed a double bottom near $3.27 between July and September 2022.
While unusual, sometimes technical targets work to the pennies. As a result, copper remains well-defined by its key technical levels. The range bounded by the green lines, between $3.27 and $3.71, represents what should be an exceptionally strong support zone for copper. I view the upper end of that range as the likely intermediate-term floor.
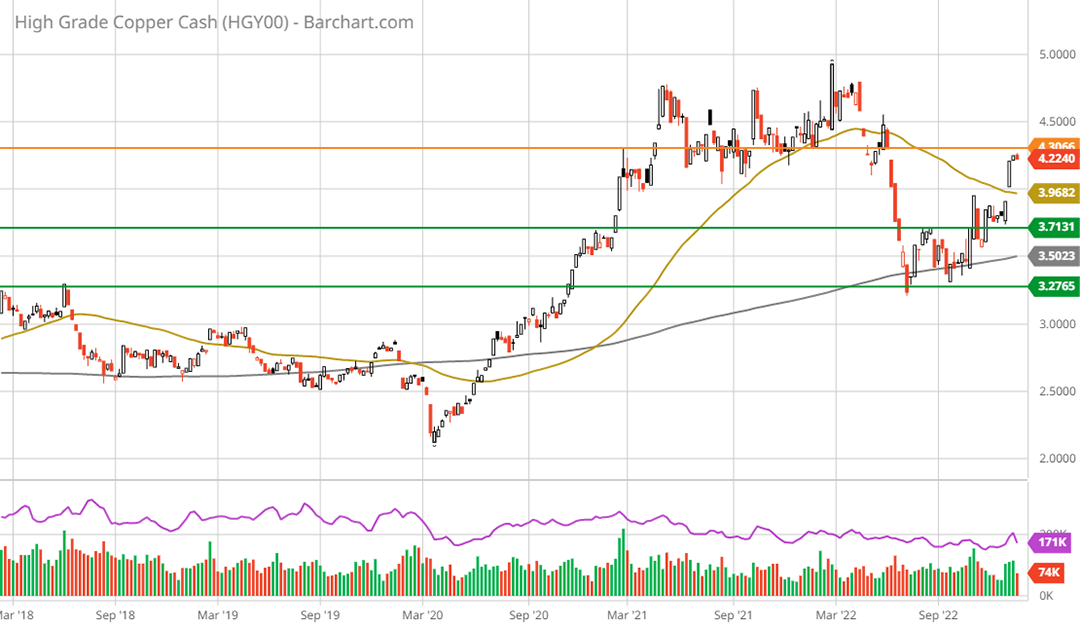
Following the October 2021 report, copper failed at the $4 support level in June 2022. Copper is now testing resistance at this prior support zone in the low $4 range from underneath (the orange horizontal line on the charts). Zooming out to the 5-year weekly chart below displays the nature of copper’s primary resistance level and places it in a longer-term perspective.
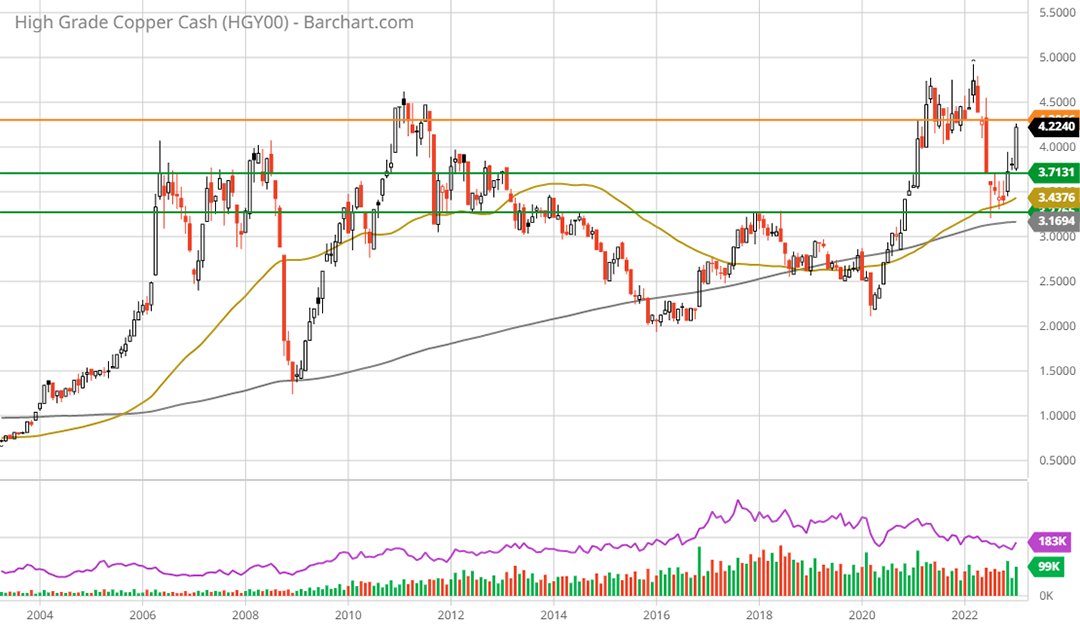
Copper is likely to face resistance in the $4.30 area which is denoted by the orange line. This was support prior to the breakdown in Q3 2022. That said, the time spent trading sideways in 2022 was minimal, which suggests that the resistance should be marginal in the bigger picture. The following 20-year monthly chart places the support and resistance levels in a long-term context.
Technically speaking, using the longer-term perspective on display in the weekly and monthly charts, copper is in a well-defined bull market within a 17-year sideways consolidation. While further testing of the $3.71 support level is likely from a weekly perspective, it is also just as likely that $4 holds as support this time around. Either way, an eventual breakout to new all-time highs appears highly likely over the intermediate term. A new bull market is also well supported by the fundamental backdrop.
Fundamentals
The following summary of the fundamental backdrop for copper is from “Top commodities for the energy transition.” It continues to capture the essence of the bull market case for copper.
Copper is likely to have a secular tailwind into the 2030s. The thesis is quite simple, electrification requires copper. If society is broadly transitioning to electrification and away from hydrocarbons, copper is the “new oil” as they say.
With respect to the above quote and the outlook for copper, China ultimately determines the demand side of the equation as it accounts for 50% of global consumption. The primary demand-side fear that led to a test of lower support at $3.27 emanates from China’s real estate correction, which has been material and is ongoing.
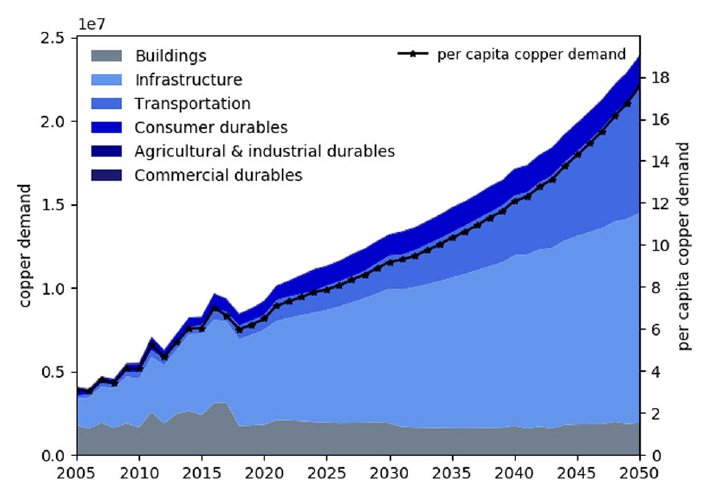
Interestingly, real estate is projected to account for only 5-10% of China’s copper demand over the coming decades. A forecast of Chinese copper demand by economic sector is displayed below with real estate shaded in grey. The chart, from a study published by Wiley in the Journal of Industrial Ecology, was featured in “Freeport McMoRan, Doctor Copper makes a house call.”
Infrastructure is by far the largest source of forecasted copper demand, followed by transportation and consumer durables. Per capita copper demand is forecasted to roughly triple through 2050. This represents an annual growth rate of only 4% for Chinese copper demand and appears to be a reasonable estimation.
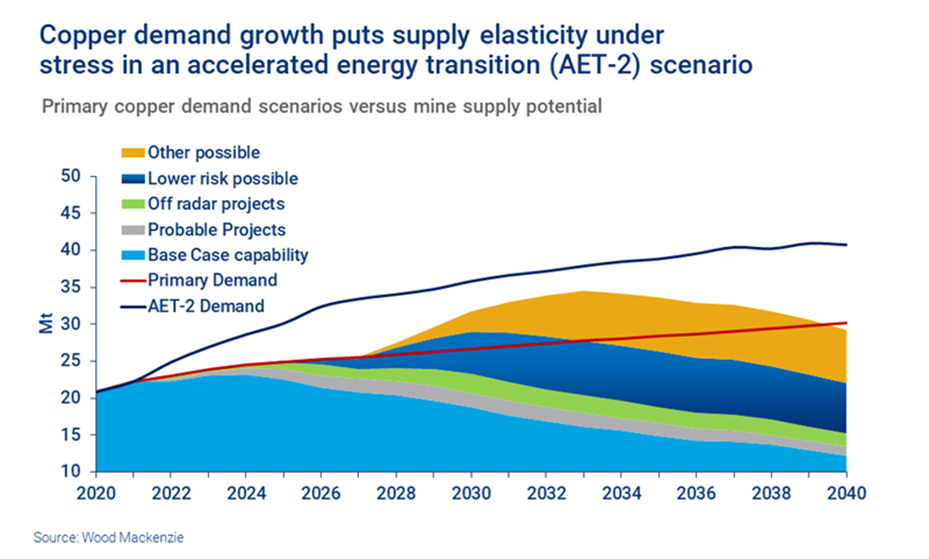
While China is the largest consumer, copper demand is forecasted to grow above trend globally into 2040 as a result of decarbonization efforts. The following Wood Mackenzie chart from a Kitco article is also featured in the Freeport McMoRan (NYSE:FCX) report and displays the projected copper shortfall under the preferred global decarbonization plans in place. The red line represents base demand, and the upper blue line includes the forecasted demand spike due to decarbonization.
With supply shortfalls forecasted for mid-decade onward as the energy transition progresses, copper prices should remain well supported at generally higher price levels than has been the case in recent times. When the difficulty of bringing new copper mines online is combined with the forecasted step change in demand, the door is open to potential supply shortfalls as the current decade unfolds.
Recent market forecasts place expected copper prices in the $4 to $5 range over the coming decade, with the high end estimated to be above $6. Importantly, the upper end of the price forecast does not require a shortfall in copper supply. Rather, the $6 area requires a tight supply and demand balance, which introduces the risk of supply shortfalls as mines can be knocked offline by events such as natural disasters and labor strikes. The $4 to $6 price forecasts are well supported fundamentally and technically.
Summary
The fundamentals and technicals are in alignment and support a new bull market for copper. While new all-time highs are highly likely, a pullback to the $3.70 to $4 range is to be expected in the short term. Nonetheless, given the precarious nature of supply and the visible increase in future demand, the asymmetry in copper is to the upside.
I will review and update three copper opportunities that are positively rated in the next report with a focus on tactical portfolio considerations given recent share price action. They include:
- Freeport McMoRan: Reviewed positively in “Freeport McMoRan, Doctor Copper makes a house call” on July 7, 2022, within a week of the $3.27 copper bottom. The stock is now up 64% and trading at $44.82 compared to $27.38 at the time of the report.
- Rio Tinto (NYSE: RIO): Reviewed positively in “The dogs of stoxdox: Top 5 income stocks” on November 17, 2022. The stock is up 22% at $79.44 compared to $65.28 at the time of the report.
- Barrick Gold: Reviewed positively in “Gold is on the efficient frontier” on October 14, 2022. The stock is up 38% and trading at $19.58 compared to $14.16 at the time of the report.


