I am assigning Meta Platforms, Inc. (NASDAQ:FB) a positive risk/reward rating based on the depth and breadth of its global network penetration, its leadership position on the edge of innovation at a critical inflection point, and its deeply discounted valuation and strong technical support.
Risk/Reward Rating: Positive
The Meta Platforms investment case revolves around the sheer size of its installed user base. At nearly 3.6 billion Monthly Active People, or MAP, across its Family of Apps, Meta has penetrated an incredible percentage of the world’s population. This number is even more impressive when considering that Meta’s primary apps (Facebook, Instagram, and What’s App) are banned in China, which is itself a large percentage of the global population at over 1.4 billion people.
User Metrics and Geographic Trends
With such a large share of the global population on its platforms, it is important to review Meta’s key user metrics and relative geographic performance in order to frame the company’s future growth potential. The following table was compiled from Meta’s Q4 2021 earnings presentation and displays the company’s summary user metrics. DAUs stands for Daily Active Users, MAP stands for Monthly Active Person, and DAP stands for Daily Active Person.

Source: Meta’s Q4 2021 earnings presentation. Created by Brian Kapp, stoxdox
I have highlighted the key data points. A large percentage of the 3.6 billion monthly active users are also daily active users. Daily active users are far more valuable customers than monthly. At over 2.8 billion, Meta has an extraordinarily large community of daily active users. This level of engagement should offer an excellent on-ramp for the rollout of future metaverse products from Meta’s Reality Labs segment.
It is important to note that the degree of global penetration and massive customer base will necessarily slow future user growth. I have highlighted in yellow the number of new monthly active users in 2021 and 2020. The 9% growth in 2021 equates to 290 million new monthly users. For reference, in 2021 alone Meta added 137% of Twitter’s (NYSE:TWTR) total monetizable daily active user base or mDAUs. In 2020, Meta added 410 million new monthly active users or roughly two Twitters. While the comparison to Twitter’s key user metric is not perfect, it highlights the sheer size of Meta’s global user network.
Geographic Trends
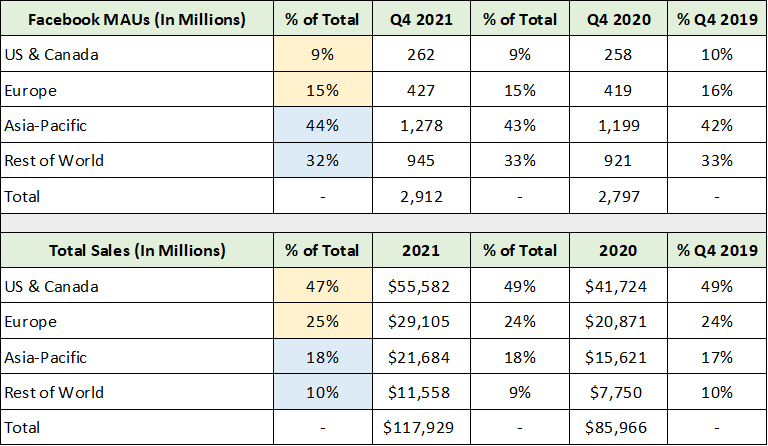
Turning to the geographic breakdown of Meta’s user base in relation to Meta’s financial performance in each region brings to light the global growth opportunities. The following table was compiled from the same presentation as above and displays the geographic mix of Meta’s user base followed by that of its sales. I have color coded the comparable cells in each table for ease of contrast.
Source: Meta’s Q4 2021 earnings presentation. Created by Brian Kapp, stoxdox
Notice that the US, Canada, and Europe account for 24% of Meta’s user base while contributing 72% of total sales (highlighted in yellow). The Asia-Pacific region and Rest of World represent 76% of the user base while contributing only 28% of total sales (highlighted in blue). The vast majority of Meta’s user base continues to offer incredible sales growth upside as these geographic sales-to-user ratios become more proportional.
Additionally, Meta’s strategic shift to the metaverse should lead to increasing direct-to-consumer sales of hardware, software, and services. This shift should further amplify the geographic sales mix normalization. The 76% of users in regions that are under monetized by the traditional advertising businesses will now become a large growth opportunity as direct consumers of Meta’s products and services, while continuing to offer a large advertising growth opportunity.
User Monetization Trends
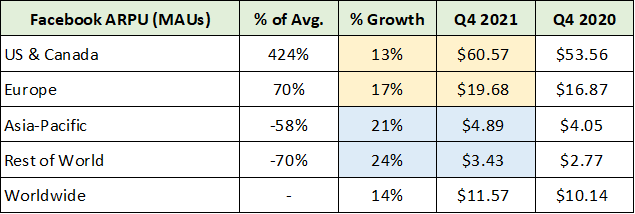
Furthermore, metaverse products and services are likely to feature more subscription-like economics which materially expands the global growth opportunity set. The following table was compiled from the same presentation used thus far and displays the Average Revenue Per User, or ARPU, in each quarter. The disparity in Average Revenue Per User across geographies is striking.
Source: Meta’s Q4 2021 earnings presentation. Created by Brian Kapp, stoxdox
The US & Canada ARPU at $61 reflects Meta’s advertising monetization potential across its historic Family of Apps. There appears to be substantial advertising upside potential in the European market and incredible upside potential remaining in the Asia-Pacific and Rest of World. In fact, ARPU in the Asia-Pacific and Rest of World regions is growing rapidly at 21% and 24%, respectively. Growth in European ARPU remains impressive at 17% (highlighted in yellow), and is only one-third of the ARPU in the US & Canada market.
Importantly, the metaverse opportunity is additive to the base advertising business, or the Family of Apps, while offering vast opportunities for enhanced advertising growth through platform integration and expanded functionality. The Gaming and entertainment spaces are likely to be the nearest-term consumer growth opportunities from metaverse applications. Gaming and entertainment use cases are an excellent fit and a natural first step for the current state of VR/AR hardware (which remains on the clunky side). As hardware form factors shrink toward that of normal eyewear, the use cases will expand rapidly.
Segment Performance
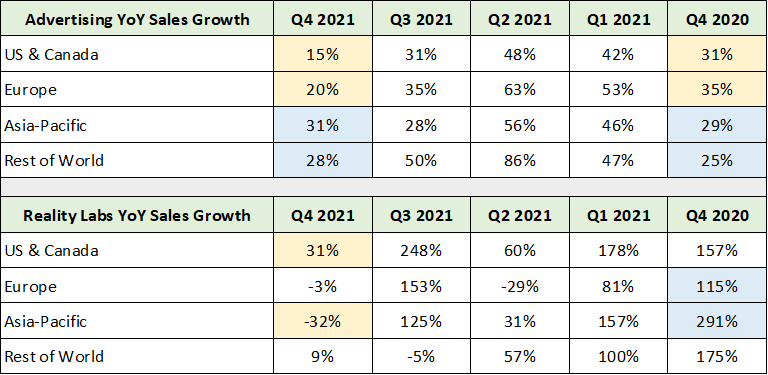
With the pivot to the metaverse to drive long-term growth, Meta began breaking out its results into two reportable business segments in Q4 2021: Family of Apps and Reality Labs. In the following tables, Advertising represents the Family of Apps segment while Reality Labs represents the metaverse offerings.
Source: Meta’s Q4 2021 earnings presentation. Created by Brian Kapp, stoxdox
In the upper portion of the table, notice that advertising growth from the Family of Apps continued to accelerate in Q4 2021 compared to Q4 2020 outside of the US, Canada, and Europe (highlighted in blue). This is in line with the global growth opportunity discussed above and the normalization of sales to be more proportional to the underlying user base. The US, Canada, and Europe experienced a substantial sales slowdown in Q4 2021, with Europe materially outperforming the US & Canada (highlighted in yellow in the upper table). This reaffirms the relative global growth opportunities for Meta.
The first three quarters of 2021 saw incredible advertising growth rates across all regions. This was due to an unusually robust online advertising market in 2021 combined with weak comparisons to the COVID shock in the first three quarters of 2020. The unusual year-over-year growth during the first three quarters of 2021 has set Meta up for an exceedingly difficult 2022 in terms of annual growth comparisons as growth reverts back to the underlying growth trends pre-COVID.
The Reality Labs segment is following a similar slowdown trajectory (the slowdown range is highlighted in yellow in the lower table) following extraordinary growth rates in recent quarters (the growth range is highlighted in blue). The recent growth rates in the 100% to 300% range across all of the regions hints at the initial growth spurts one would expect to see in the early stages of an unfolding market adoption S-curve.
Given the incredible growth rates in recent quarters, much of 2022 is set up to be a challenging year for annual growth comparisons in the Reality Labs segment. That said, the metaverse product and service offerings are likely to experience step change-like growth patterns as completely new and even revolutionary products and services are brought to market. These types of growth patterns and the initial stages of a secular growth S-curve are by their nature difficult to accurately forecast. As a result, it is best to maintain a view of the forest rather than getting bogged down in the trees.
Reality Labs: Growth Opportunity
In this spirit, I ran a few oversimplified scenarios to illustrate the scale of the growth opportunity for Meta’s Reality Labs. A cursory glance shows that Meta is retailing its Oculus VR hardware in the range of $300 to $400. In its 2021 10-K filed with the SEC, Meta offers the following detail in regard to its sales in the Reality Labs segment (emphasis added):
RL revenue increased $1.14 billion, or 100%, from 2020 to 2021, and $638 million, or 127%, from 2019 to 2020. The increases in both periods were mostly driven by increases in the volume of our consumer hardware products sold.
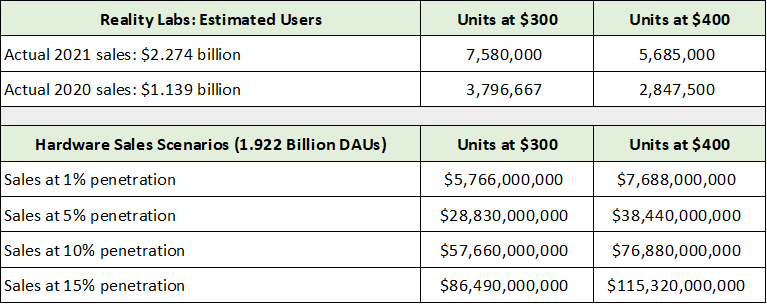
If we assume that hardware sales account for all of Reality Labs’ sales in 2021 and 2022, and that the revenue per unit was $300 and $400, the upper portion of the following table displays the implied Reality Labs user base currently. In the lower section of the table, I assume various levels of VR/AR hardware penetration and the associated total sales at that level of market adoption using the same unit price scenarios of $300 and $400.
Created by Brian Kapp, stoxdox
The 2020 and 2021 sales in the Reality Labs segment suggest that the current penetration of the Facebook daily active users is under 0.5% using the 1.922 billion DAUs as the total addressable market. This is a more conservative approach as opposed to using the total DAUs for the Family of Apps of 2.82 billion daily users. At a 15% market penetration, Meta’s estimated VR/AR hardware sales could reach $115 billion, which would roughly equal Meta’s total sales in 2021.
With the incredible growth opportunity in VR/AR hardware, the economics of the unfolding Meta business model begin to look similar to that of Apple’s (NASDAQ:AAPL). Keep in mind that the true opportunity lies in subscription-like product and service offerings in VR/AR, which should dwarf hardware sales as the market opportunity unfolds. Additionally, there are a plethora of hardware sales opportunities across the VR/AR industry outside of headsets.
Growth Trajectory
While Meta’s Reality Labs’ opportunity set offers some of the largest growth prospects in the innovation space for the coming decade, these opportunities must be placed in the context of Meta’s current growth trajectory. The following table was compiled from Meta’s 2021 10-K and Q4 2021 8-K filed with the SEC. It displays the recent annual sales growth performance in each of Meta’s two business segments. I make the following comparisons: Q4 2021 to Q4 2020, the first three quarters of 2021 to those in 2020 (3Qs columns), and the full year of 2021 to 2020 and 2020 to 2019.
Created by Brian Kapp, stoxdox
As alluded to above using the geographic sales breakdown, revenue growth slowed substantially in Q4, to roughly 20% for both segments (highlighted in yellow). The Family of Apps segment (advertising) saw growth peak in the first three quarters of 2021 at 44% (highlighted in blue). Growth in the Reality Labs segment was superb at 231% through the first three quarters of 2021, bringing full year 2021 sales growth to 100% following 127% growth in 2020 (highlighted in blue).
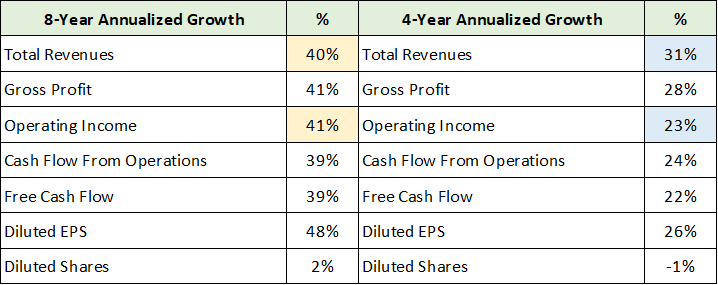
With sales growth decelerating rapidly in the short term, it is important to place the recent sales performance in the context of historical trends and the underlying growth trajectory. The following table was compiled from Meta’s income and cash flow statements provided by Seeking Alpha. I have condensed the statements into key line items and calculated the annualized growth rates for each variable over the 8-year period since Meta’s IPO and the most recent 4-year period ending in 2021. I have highlighted the two variables that best represent the 8-year growth trajectory in yellow and the 4-year growth trajectory in blue.
Source: Seeking Alpha. Created by Brian Kapp, stoxdox
Meta is in a well-defined sales growth deceleration from 40% over the full 8-year period to 31% in the recent 4-year period. Recall from above that sales growth was recently well above the 31% 4-year trend, registering 44% for the first three quarters of 2021 and 36% for the full year. Additionally, we must consider that the slowing growth trajectory of 40% to 31% implies that the natural sales growth tendency over the coming four years is likely in the 20% area at best for the Family of Apps advertising business. Please note that operating income growth is slowing much more rapidly than sales (41% to 23%) which I will review following the sales discussion.
Consensus Growth Estimates
With the sales growth trajectory in hand, we can place consensus sales growth estimates for the coming five years in context. The following table was compiled from Seeking Alpha and displays consensus sales growth estimates through 2026. The most striking aspect of Meta’s expected growth profile is the central tendency toward 12% sales growth over the coming five years. This is well below what one would expect based on the trailing 8-year and 4-year growth rates of 40% and 31%, respectively.
Source: Seeking Alpha. Created by Brian Kapp, stoxdox
While not shown in the above table, annual sales growth for Q1 and Q2 of 2022 is expected to be in the mid-single digit range, and in the mid-teens range for Q3 and Q4 of 2022. Mid-single digit sales growth appears reasonable given the extraordinarily difficult growth comparisons from Q1 and Q2 of 2021. Mid-teens growth in the second half of 2022 also appears reasonable with downside surprise potential through Q3.
Consensus sales growth estimates are well below what one would expect by projecting Meta’s existing sales growth slowdown trajectory. The recent trends toward increased privacy and less ability to track users is a material risk for advertising sales and is likely the primary factor leading to the much lower-than-expected sales growth estimates. That being said, the central tendency toward 12% annual sales growth embedded in consensus estimates through 2026 appears to leave considerable room for upside surprises from Meta’s Family of Apps businesses alone.
As a result, one can also infer that consensus sales estimates do not factor in a material sales contribution from the Reality Labs segment through 2026. All told, consensus sales estimates look quite conservative through mid-decade. Please keep in mind that the short-term reversion to the underlying growth trajectory combined with the new privacy and tracking challenges could continue to offer negative surprises through much of 2022.
Profitability
As mentioned in the growth trajectory section, Meta’s operating income growth has slowed much more rapidly than sales growth, from 41% over the 8-year period to 23% over the past 4-year period. The primary driver of this outsized profitability slowdown is the Reality Labs segment. Additionally, similar to the recent outsized sales growth, operating income grew at an incredible pace in 2020 and the first three quarters of 2022. As a result, a reversion to the underlying profitability growth trend is a major short-term risk factor. The following table summarizes the recent profitability trends and was compiled from the 2021 10-K and the Q4 2021 8-K filed with the SEC.
Created by Brian Kapp, stoxdox
I have highlighted in blue the well-above trend operating income growth rates over the past two years. This performance is well above the 4-year growth trajectory of 23% annually. The reversion back to this underlying trend is evident in the massive profitability slowdown in Q4 2021 (highlighted in yellow) at just 7% for the Family of Apps and -1% overall. Meta is now in a short-term contractionary period for profitability. This is to be expected in light of the incredible operating income growth of 43% and 36% in 2021 and 2020, respectively.
Notice the increasing operating losses in the Reality Labs segment at -$3.3 billion in Q4 2021 alone, and -$10.2 billion for the full year of 2021. Meta plans to continue ramping its investments in the Reality Labs segment in 2022 via research and development and employees. Additionally, the company plans to invest aggressively in artificial intelligence and machine learning to support its Family of Apps, with implications for the future of Reality Labs. The investment plan and its profitability impact is summarized in the following passage from the 2021 10-K filed with the SEC:
We expect 2022 capital expenditures to be in the range of $29-34 billion and total expenses to be in the range of $90-95 billion… we also expect that our year-over-year total expense growth rates may significantly exceed our year-over-year revenue growth rates, which would adversely affect our operating margin and profitability.
To place these numbers in context, the following table displays key operating income line items and was compiled from the income statement provided by Seeking Alpha.
Source: Seeking Alpha. Created by Brian Kapp, stoxdox
At $29 to $34 billion, the 2022 capital expenditure plan is massive and represents 70% growth compared to 2021. The capital expenditures will materially expand Meta’s computing infrastructure and capabilities. Additionally, operating expense growth is projected to be in the 31% range as Meta intends to hire and invest aggressively, while continuing its aggressive research and development investment program. This expansion follows a nearly $25 billion investment in research and development in 2021 alone. Meta’s aggressive investment plans are a clear sign that it is going all in on growth.
My simplified hardware sales scenario for the Reality Labs segment above points toward this segment offering a much larger sales opportunity than the extraordinary advertising success to date across the Family of Apps segment. Additionally, based on the sales in the Reality Labs segment in 2020 and 2021, Meta appears to have penetrated materially less than 0.5% of its user base.
In other words, Meta has barely scratched the Reality Labs surface while penetrating enough early adopters to gain confidence in its product and service roadmaps as evidenced by its aggressive investment plans. The aggressive investment plans for 2022 at the beginning of a secular growth S-curve in the VR/AR industry makes perfect sense from a long-term shareholder perspective. That said, the short-term profitability trend will experience a materially negative impact as a result.
Consensus Earnings Estimates and Valuation
With the investment plans and profitability trends in place, we can begin to place consensus earnings estimates into context. The following table was compiled from Seeking Alpha and displays the consensus earnings growth estimates through 2026. I have highlighted in yellow the estimates which I view as being at a material risk of disappointment. The blue highlighted cells represent what I view as high probability outcomes.
Source: Seeking Alpha. Created by Brian Kapp, stoxdox
Operating income growth already has turned negative as of Q4 2021, and Meta faces extraordinarily difficult profitability comparisons through the first three quarters of 2022 (71% operating income growth in the first three quarters of 2021). In this light, the -10% earnings contraction estimated for the full year of 2022 appears to be too optimistic. This is especially the case given the 30%+ expense growth planned for 2022.
Using Meta’s total expense guidance for 2022 of $91 to $95 billion, and considering the range of consensus sales estimates as well as the near-term trend toward mid-single digit sales growth, earnings appear likely to fall in the mid-$8 to high $13 EPS range in 2022. As a result, the low analyst estimate of $10.80 for 2022 appears to be quite likely. This likelihood may be in the process of being priced into Meta’s shares given that they are trading at only 15x the consensus earnings estimate for 2022.
2022 earnings uncertainty aside, estimates for 2023 appear achievable while 2024 looks to be highly likely as the operating losses in the Reality Labs segment begin to reverse in conjunction with rapidly expanding sales. In this light, the 11x valuation on the 2024 consensus earnings estimate points toward substantial upside opportunity for Meta’s shares.
Valuation
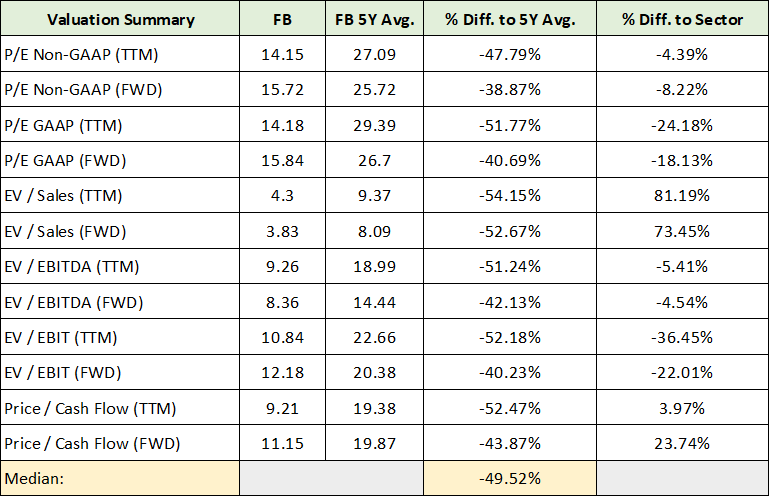
In fact, Meta’s valuation has reached an extraordinarily low absolute and relative level. With a PE multiple in the low teens to mid-single digits through 2026, the absolute valuation is exceptionally low by any standards. This is especially true when compared to the mid-teens EPS growth trajectory through 2026. The following table was compiled from Seeking Alpha and displays various valuation measures relative to Meta’s 5-year averages as well as the communication services sector averages. I have highlighted the summary valuation measure relative to Meta’s 5-year median valuation levels.
Source: Seeking Alpha. Created by Brian Kapp, stoxdox
Meta is being valued at a 50% discount to its historical median valuation. This affirms the opportunity for substantial upside return in addition to the likelihood that the market is pricing in material earnings growth misses over the course of 2022.
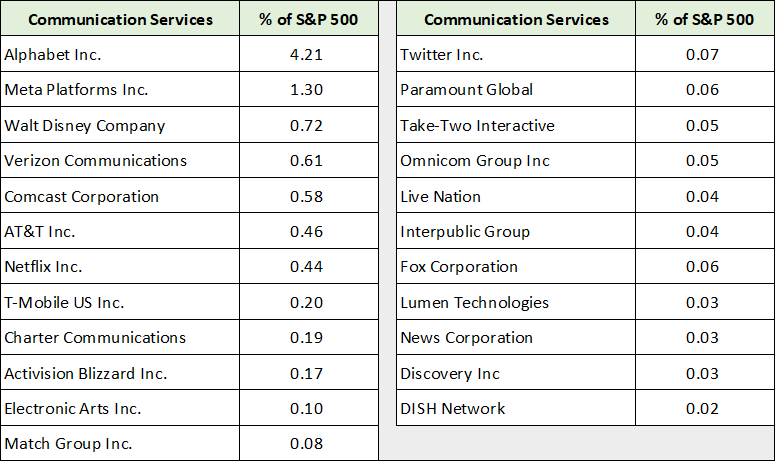
In terms of Meta’s valuation relative to its sector peers, the company is valued at a material discount on most measures; it has historically been valued a material premium to the group. The one area in which Meta still receives a premium valuation is in relation to sales which is a less meaningful valuation measure given the diversity of its peer’s business models. The following table displays the communication services sector peer group in the S&P 500 index.
Source: State Street. Created by Brian Kapp, stoxdox
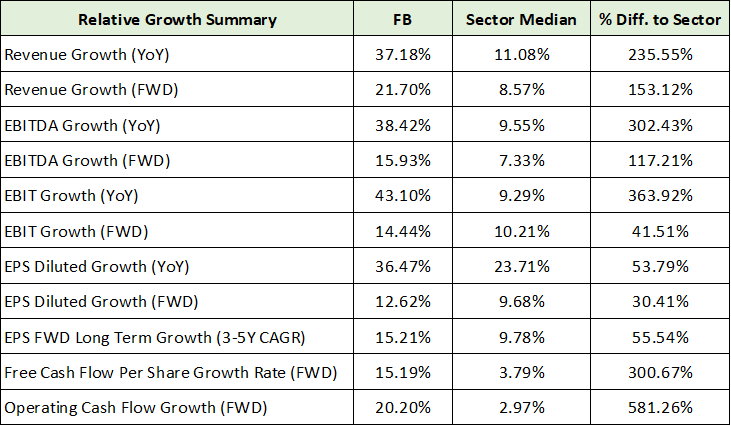
I have included the sector list to shed light on the dispersion of Meta’s valuation measures in relation to its peer group. There are a variety of types of business in the group with various margin norms and stages of maturity. Interestingly, Meta trades at a material discount to the group overall while having much higher growth rates across all metrics. The following table compiled from Seeking Alpha displays Meta’s growth in relation to the peer group.
Source: Seeking Alpha. Created by Brian Kapp, stoxdox
Across all growth measures, Meta offers far superior historic and prospective growth rates. The extreme valuation discount certainly suggests substantial upside return potential for Meta Platforms.
Potential Return Spectrum
To estimate Meta’s return potential, I have chosen to compare its valuation to the highest quality subset of its peer group that are the most similar to Meta. For this I have chosen Alphabet (NASDAQ: GOOG), Netflix (NASDAQ: NFLX), Walt Disney (NYSE: DIS), and Twitter (NYSE: TWTR). The following table was compiled from Seeking Alpha and compares the valuation of each company on consensus earnings estimates through 2026. The % High column and % Low column reflect Meta’s return potential if it were to trade at the high peer valuation and low peer valuation, respectively.
Source: Seeking Alpha. Created by Brian Kapp, stoxdox
I have highlighted in yellow the low return estimate and in blue the high return estimate. An upside return spectrum of 48% to 170% appears quite reasonable over the coming five years. I view the 70% to 99% potential return spectrum, using the 2025 estimates, to be highly probable.
Technicals
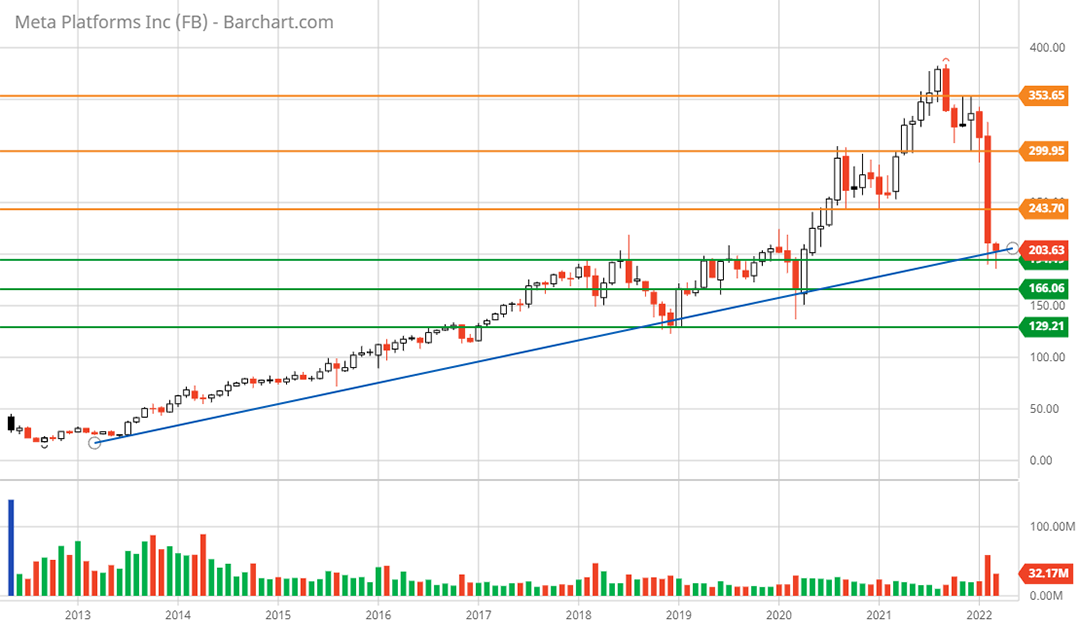
In fact, the 70% to 99% upside return potential is perfectly aligned with key technical resistance levels. I have highlighted the major resistance levels with orange lines on the 10-year monthly chart below. This chart captures Meta’s entire history as a public company. The blue uptrend line represents the monthly uptrend line that has served as the bottom since the IPO.
Meta Platforms 10-year monthly chart. Created by Brian Kapp using a chart from Barchart.com
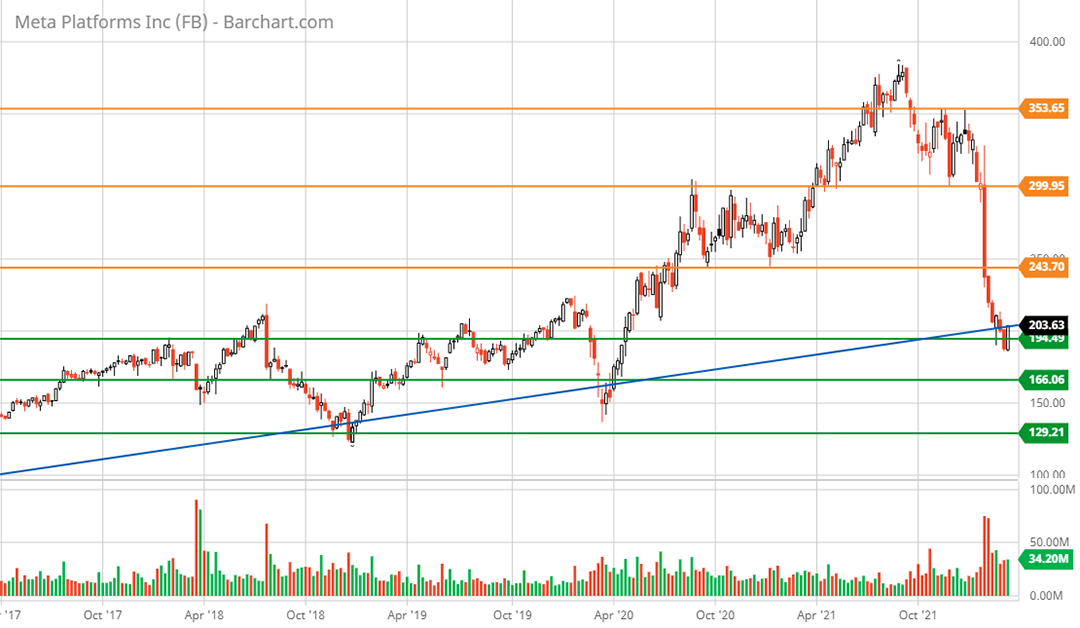
The green lines represent an incredibly strong long-term support base that was carved out between 2016 and 2020. The shares are currently testing the top of this support zone which happens to coincide with the long-term uptrend line. The combination of the two should offer a low-risk accumulation zone for Meta shares. The following 5-year weekly chart provides a closer look at the technical price targets.
Meta Platforms 5-year weekly chart. Created by Brian Kapp using a chart from Barchart.com
The upside return potential to each of the three orange resistance lines is 23%, 51%, and 78%. New all-time highs above the 78% upper price target would equate to the 70% to 99% return spectrum arrived at in the relative valuation calculation above.
The downside return to each of the three green support lines is -3%, -17%, and -35%. Given the solid fundamental support surrounding the current valuation level, I find a test of the -35% price target to be unlikely. Additionally, this was the panic low during the COVID crash which was during an extraordinarily negative economic backdrop. The -17% price level could certainly be tested if Meta badly misses 2022 growth and earnings estimates.
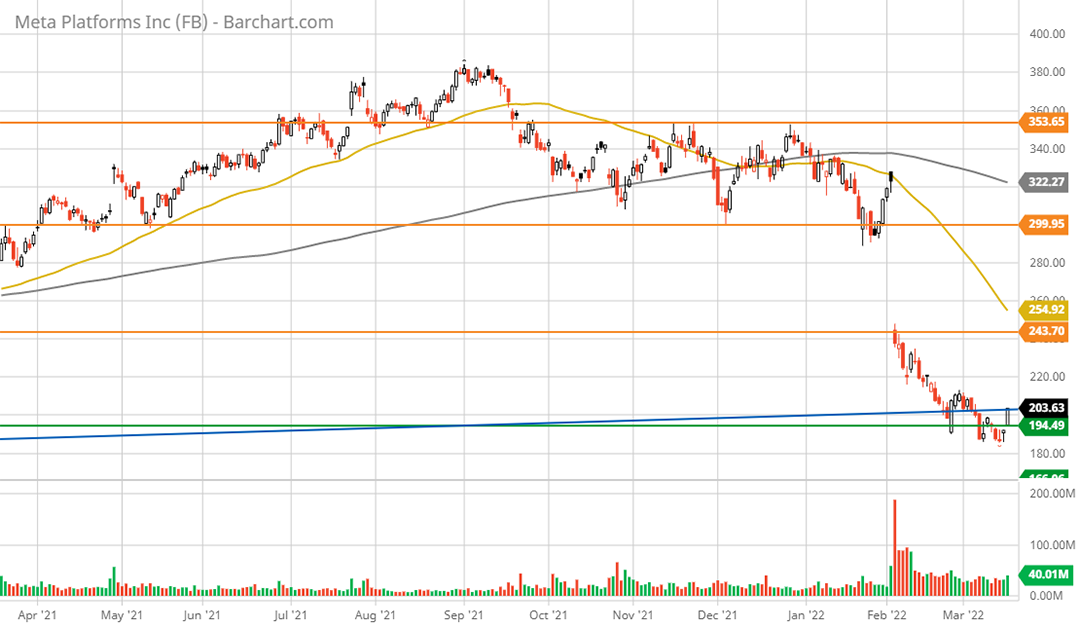
The following 1-year daily chart provides a closer look at the short-term overextension to the downside, technically speaking. Being on top of the major support zone as well as the long-term uptrend line combined with the technical downside overextension fully supports the current levels being an asymmetric risk/reward entry point.
Meta Platforms 1-year daily chart. Created by Brian Kapp using a chart from Barchart.com
Summary
The strong technical backdrop combined with Meta’s deeply discounted valuation and superior growth prospects creates an asymmetric risk/reward opportunity in a blue-chip growth stock. Meta is operating one of the world’s most valuable networks. The company’s depth and breadth of global market penetration combined with its leadership position on the edge of innovation form the foundation for a dynamic global growth opportunity.
Price as of this report: $203.40
Investor Relations Website: https://investor.fb.com/home/default.aspx


