I am assigning Warby Parker (NYSE: WRBY) a negative risk/reward rating based on its elevated valuation, declining customer unit economics, special risk factors, and industry-wide e-commerce friction. Negative rating aside, I believe Warby Parker has the potential to be a secular growth stock with substantial upside potential once the above concerns are rectified. In this article I breakdown Warby Parker’s performance across its financial statements and key business metrics in order to formulate an investment strategy for the shares.
Risk/Reward Rating: Negative
Warby Parker shares opened 35% higher than the IPO reference price on its first day of trading September 29, 2021. The initial pop is likely due to the lack of available shares in the marketplace given the direct listing from selling shareholders without underwriters or a new capital raise. In fact, in the first half hour of trading, a mere 6.4 million shares traded and under 14 million traded on the day.
Profitability and Scale
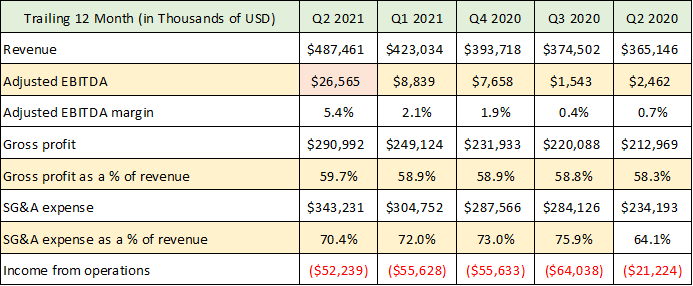
It is interesting that Warby Parker chose not to raise new capital as part of its IPO as additional growth capital could likely be productively deployed. In reading the S-1 filed with the SEC, I was quite surprised on a number of fronts. The two most surprising aspects of the business are its current scale and its dependence on physical store sales for the majority of its revenue. I will begin my analysis with these surprises. The following table was compiled from Warby Parker’s S-1 filed with the SEC.
Source: Created by Brian Kapp, stoxdox
This table speaks to the scale of Warby Parker’s current operations with the essential information highlighted. Please note that the data represents trailing twelve-month results as of the end of each quarter. Given that Warby Parker was founded in February 2010, I expected to see much higher adjusted EBITDA profitability (first highlighted row) as well as materially higher sales. Keep in mind these are trailing twelve-month figures.
While Q2 2021 showed a material uptick in adjusted EBITDA to $26.5 million for the trailing year, the preceding quarters reflect meager results and little operating leverage in the business. The lack of operating leverage is evident in the stagnant gross profit margin (second highlighted row) and the stubbornly elevated selling general and administrative expenses (third highlighted row). It is unclear if the bump in adjusted EBITDA for Q2 2021 is the start of an upward profitability trend or a one-off quarterly boost in preparation for the IPO. I will walk through several performance indicators shortly to help answer this question.
Sales Mix
While $487 million of sales for the year ended Q2 2021 is material, I was expecting Warby to be a much more successful e-commerce brand. The company was founded in 2010 and has operated in the greatest digital commerce bull market ever.
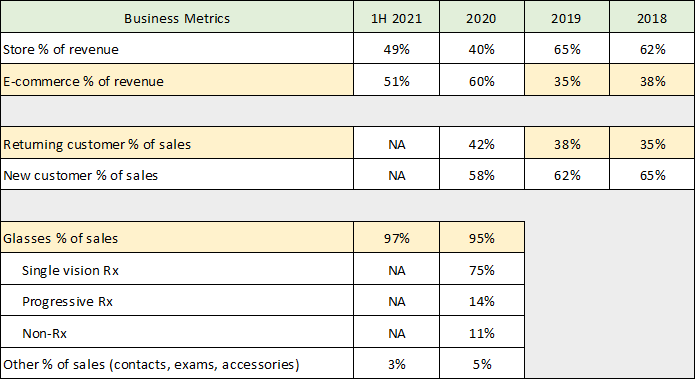
Warby Parker was founded on the premise of selling eyewear directly to consumers primarily over the internet, thereby being able to fulfill its mission of offering quality vision without a premium price. E-commerce profit margins are much greater than physical store margins, which enables more aggressive pricing while maintaining healthy profit margins. This is the most natural sales channel for the company’s mission. It is Warby Parker’s e-commerce sales which were the greatest surprise. The following table was compiled from the S-1 and highlights several key business metrics including the sales breakdown by segment and product.
Source: Created by Brian Kapp, stoxdox
The first highlighted row is the percentage of Warby Parker’s sales from e-commerce. I highlighted 2018 and 2019 as they are the most appropriate base years given the store closures during COVID which artificially shifted the sales mix to e-commerce. The company generated roughly 35% of its sales digitally and 65% in physical stores during those years. Sales through the first half of 2021 look to be trending back to this historical mix as post-COVID normalcy returns in force.
It is striking that glasses still produce nearly all of the company’s revenue at 97% of sales. This could be good news as contact lenses and eye exams offer material upside potential. Vision is also a top candidate for technological innovation which would offer a pathway to exciting new product lines and services. The following graphic was provided in the S-1 and speaks to the growth opportunity available to Warby Parker if it can execute on providing a full suite of vision products and services.
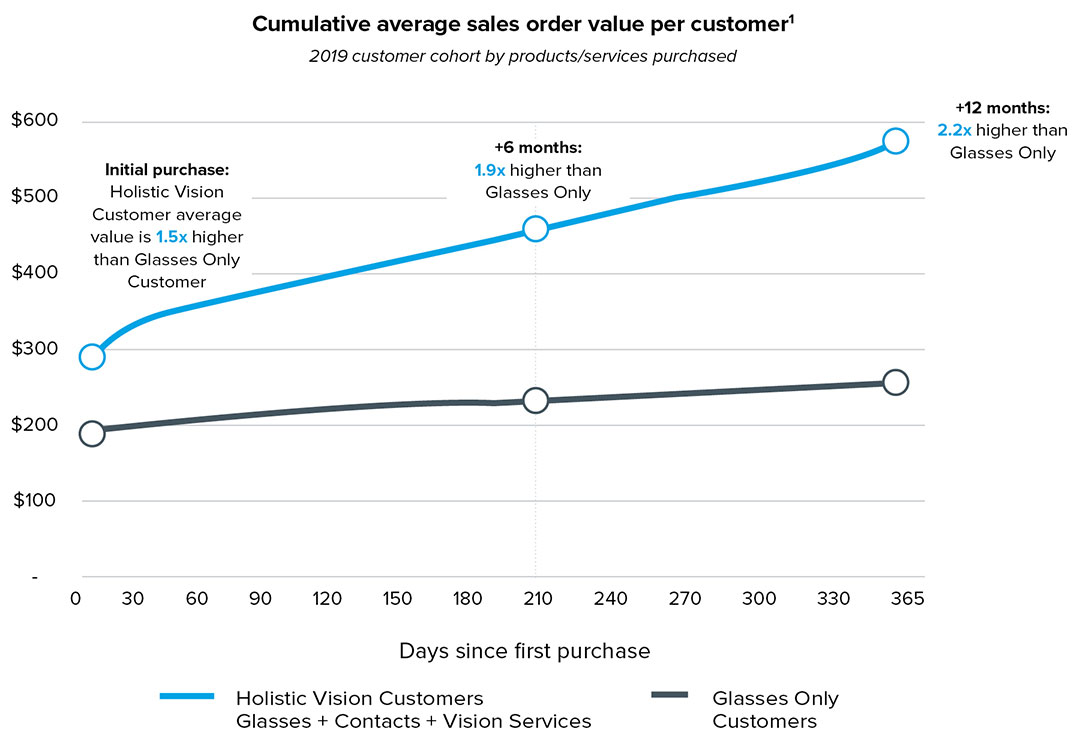
Source: Warby Parker S-1 filed with the SEC
(1)Source: Company data. Average value per customer represents sales including refunds; equal to cumulative customer sales order value divided by total unique customers in each product and service grouping.
When customers purchase contacts and vision services in addition to eyeglasses, the total customer value increases by 2.2x over the first twelve months. There remains tremendous operational leverage potential in each client relationship that the company has yet to capitalize on as evidenced by eyeglasses still contributing 97% of total sales.
Brand Loyalty
If Warby Parker could successfully cross-sell other products and services it would remedy the current weak profit margins while leveraging Warby Parker’s competitive advantage, brand loyalty. The following table was compiled from the S-1.
Source: Created by Brian Kapp, stoxdox
The company provides data on repeat purchases. In the yellow highlighted column, we can see that 98% of customers that have been with the company for four years have continued to purchase their eyeglasses from Warby Parker. After three years (orange column), 75% of customers continued to buy from Warby Parker. These numbers tell me that the majority of customers are loyal to Warby Parker for their eyeglasses and would likely be open to other products.
The loyal customer base also shifts repeat purchases to the higher margin e-commerce channel. I say this because returning customer sales as a percentage of total sales has historically been remarkably similar to the percentage of sales in the e-commerce channel (see the 2018 and 2019 highlighted rows in the prior table). While this could be a coincidence, it does make sense that customers prefer to buy in person from Warby Parker the first time. Only 8% of total industry sales are in the e-commerce channel.
Profit Margins
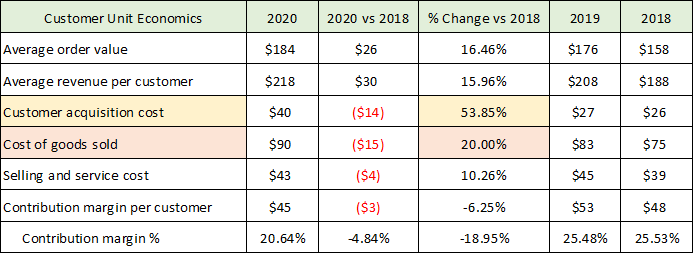
The loyal customer base combined with the cross-selling opportunity suggests Warby Parker has the potential for materially higher margins in the future. This will be needed as the current margin trend has been in the other direction. The following table is compiled from Warby Parker’s S-1.
Source: Created by Brian Kapp, stoxdox
This is a breakdown of the average economics per customer. I have highlighted the sources of margin contraction. Customer acquisition costs have spiked 54% since 2018. Cost of goods sold is also rising at an elevated rate of 20%. Each of these cost categories looks likely to continue to increase at an above average clip.
Fundamental Summary
Warby Parker has not demonstrated the explosive e-commerce growth over the past decade that one would have expected. There are many entrenched industry groups that have been able to maintain friction in the prescription eyewear market. This friction does create growth risks for Warby Parker due to the heavily regulated nature of the eyecare industry. For example, the company is awaiting an FDA decision regarding the use of telehealth issued prescriptions made possible by increased technological capabilities (the following image highlights the mobile eye exam opportunity). If the door opens to these opportunities, Warby Parker could ignite more rapid growth and expand profit margins considerably.
The regulated healthcare aspect of the business suggests that the business model requires a sizeable physical footprint to ignite and sustain growth. Warby Parker’s physical store presence appears to be the most logical introduction of the brand to new customers based on industry trends (92% of industry sales are in-person). Once in the door, customer loyalty translates into higher margin repeat purchases via the e-commerce channel. In addition, there is substantial untapped upside opportunity from cross-selling other vision products and services.
This is good news for growth as can be seen in the following table compiled from Warby Parker’s S-1 (1H = first half).
Source: Created by Brian Kapp, stoxdox
The company has only 145 stores (yellow highlighted cells) and projects that it could have 900+ total in the US and Canada. Store growth slowed during COVID but looks set to reaccelerate in the direction of the 35% growth posted in 2019. On the store count, Warby Parker still has 85% of its growth potential in front of it, before considering upside opportunities like international expansion and new product and service introductions.
Additionally, with only 2.08 million customers as of the first half of 2021 (orange highlighted cells), Warby Parker has barely scratched the surface. The company estimates it has 1% market penetration in the US. This leaves a multi-decade growth runway in the US market alone if the company can execute an aggressive yet methodical market penetration plan.
Valuation
Given the bright outlook, no pun intended, it is time to turn to the valuation and begin thinking about accumulation strategies. On the valuation front, Warby Parker has reported private share sales leading up to the IPO. The following table was compiled from its S-1.
Source: Created by Brian Kapp, stoxdox
The prices of these transactions offer an excellent reference point for a valuation which is less affected by limited supply, as was the case with the IPO. The yellow shaded rows show a flat valuation trend for the past year (VWAP = volume weighted average price). This follows a 26% price increase from the prior range (highlighted in orange). The $54 IPO price is a 120% increase from the last private valuation price in Q2 2021. The 120% price increase appears excessive in comparison to the current business trends. A summary of the key valuation multiples is in the following table compiled from Warby Parker’s S-1.
Source: Created by Brian Kapp, stoxdox
The current valuation multiples are extreme by historical market standards and relative to the current averages which trade between 22x and 32x 2021 expected earnings (S&P 500: 22x, Nasdaq 100: 29x, Russell 2000: 32x). There are several risk factors near term regarding Warby Parker’s shares which place added emphasis on being compensated for the risk level of the investment.
Special Risk Factors: Concentrated Ownership
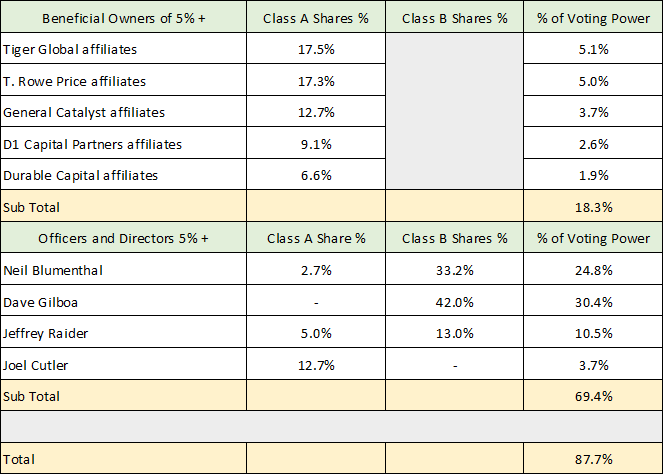
The selling shareholders of Warby Parker stock represent overhead supply. Additionally, 69% of the voting power rests in the hands of the founders and executives. For all intents and purposes this places full control of corporate decisions in the founders’ hands. This presents a fundamental control risk to prospective investors. The following table displays all 5% or greater shareholders.
Source: Created by Brian Kapp, stoxdox
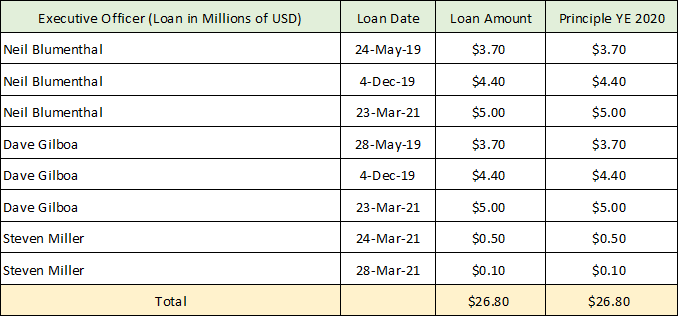
The concentrated ownership and control risk for prospective investors is highlighted by the company engaging in related party transactions. Warby Parker has loaned its key executives money as outlined in the following table from the S-1 (YE = year end).
Source: Created by Brian Kapp, stoxdox
This type of related party transaction has been a red flag for companies in the past and should raise the risk premium (lower the valuation price) for prospective investors.
Internal Control Over Financial Reporting
Another special risk factor is the company’s disclosure of a material weakness in its control over financial reporting. The weakness was disclosed in the S-1 by Warby Parker’s management rather than its auditor. The specific material weaknesses identified relate to:
(i) information technology general controls, in the areas of user access and program change management, over our key accounting, reporting, and proprietary systems and
(ii) certain process and application controls within our financial reporting processes to enforce segregation of duties, prevent and detect errors, support timely reconciliation and analysis of certain key accounts, and enable the review of manual journal entries.
The company attributes the weakness as follows: “we did not have the necessary business processes, systems, personnel, and related internal controls necessary to satisfy the accounting and financial reporting requirements of a public company.”
Material weaknesses in control over financial reporting is a serious risk for prospective investors that should be compensated by a higher risk premium (lower valuation). Remedying the weakness is likely to require a significant increase in information technology investment as well as skilled labor. This risk factor opens the door to systemic risk within the company and should be monitored closely.
Summary
There were several negative surprises accompanying Warby Parker’s IPO. Following the greatest decade of digital commerce growth ever, the company receives surprisingly little of its revenue from the e-commerce channel. As a result, the current scale and profitability of the Warby Parker business model is well beneath its full potential. These operational realities are likely to place downward pressure on the current valuation potential of the company’s shares. When combined with the special risk factors facing prospective shareholders, a negative risk/reward rating at the current valuation is in order.
That being said, Warby Parker has the potential to be a secular growth stock with substantial upside potential once the concerns outlined here are addressed. The deficiencies in scale and e-commerce volume to date leave most of Warby Parker’s growth runway in the future. When this potential is combined with a systemic market penetration strategy spearheaded by a rapidly increasing physical store footprint, the growth trajectory could re-rate materially higher. The enhanced growth trajectory would be amplified if the company can leverage its brand loyalty by cross-selling a full suite of eyecare products and services.
Based on the current elevated public market valuation and the recent private market transactions, the $35 area looks to be the beginning of an attractive accumulation zone for the stock. This is not far removed from the original IPO price target of $40. Finally, this price level would provide a more reasonable liquidity premium of 43% over the Q2 2021 private share sales at $24.53 rather than the current 120% premium.
Price as of this report 9-30-21: $53.23
Warby Parker Investor Relations Website: Warby Parker Investor Relations


