As the real estate and credit markets are facing contraction due to higher interest rates, this is an opportune moment to review Williams-Sonoma (NYSE: WSM). The company is arguably the highest quality home furnishing retailer in the US, with peer-leading profitability and business execution.
The Eye of The Storm
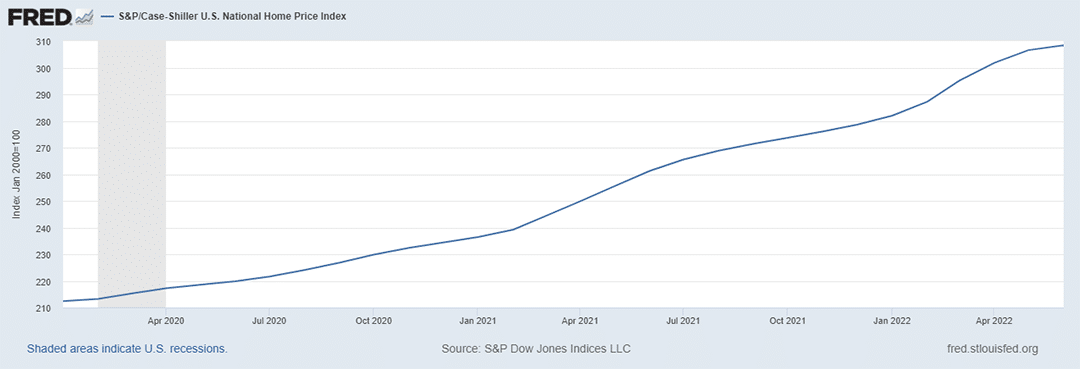
One of the great ironies of the Covid-induced economic shutdown is that the loose fiscal and monetary response was funneled directly into asset prices, thereby fueling hyperinflationary price effects. For example, the S&P/Case-Shiller U.S. National Home Price Index spiked by 45% from January 2020 through June 2022. The following chart, courtesy of the St. Louis Federal Reserve, displays the index over that period.
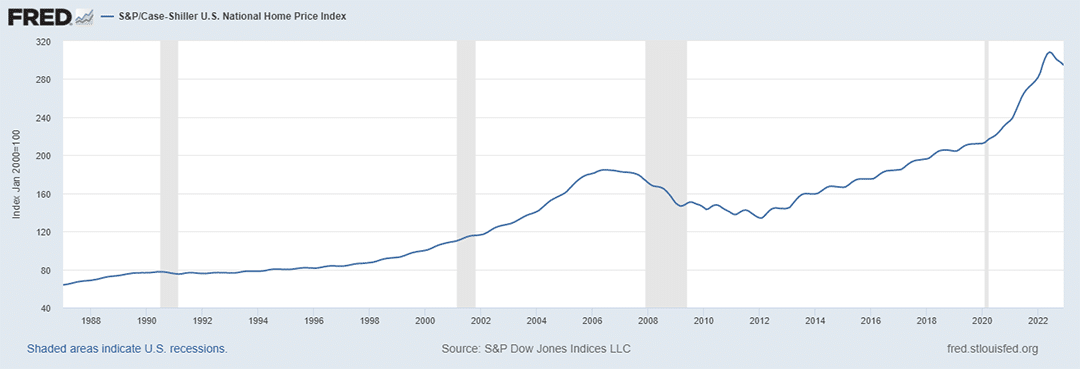
In comparison, the final two years of the previous housing bubble (June 2004 through June 2006) saw the Case Shiller index rise by 23%. The three years leading into the June 2006 peak witnessed a 39% increase. The Covid housing price bubble materially surpassed the 2006 peak in magnitude and velocity.
As much of the economy was shut down in response to Covid, the US housing market was not being driven by economic fundamentals. The US had entered a pure price bubble phase resulting from excessive liquidity and too easy credit conditions. The following chart displays the full history of the Case Shiller National Home Price Index. Notice the phase change to a hyperinflationary price trajectory beginning in 2020.
With recent bank failures making front page news, it is fair to say that excess liquidity and too easy credit conditions are no longer present. In fact, the exact opposite conditions now prevail as the markets exit the calm waters of the eye of the economic hurricane.
The key question for the Williams-Sonoma investment case is what does the other side of the eyewall look like?
Expectations
The extreme economic distortions on display in the housing price charts above render the near future highly uncertain. This is especially the case for home furnishing retailers such as Williams-Sonoma. As can be seen in the following table, the company’s sales growth spiked during Covid in lock step with home prices (highlighted in yellow).
While correlation is not causation, the two fundamentally overlap, and they reacted similarly to the fiscal and monetary conditions of the period. As these conditions have reversed, Williams-Sonoma is likely to face a more challenging demand environment over the nearer term.
Consensus Estimates
In fact, consensus sales growth estimates into mid-decade are forecasting a stagnant demand environment. The following table displays consensus estimates. I have highlighted in yellow the expected annual growth rates over the next three years.
From the prior table, excluding the two Covid years, William Sonoma’s sales growth rate averaged 5% per year. The consensus estimates look reasonable in this light, as they incorporate a degree of mean reversion. It should be noted that management has guided sales growth to be in the range of -3% to +3% for the current year.
There is likely downside risk to the current year consensus estimate of -3% sales growth. A mean reversion toward 5% annually suggests that a larger contraction is quite possible. Supporting this heightened risk, the housing market contraction and tightening credit conditions point to a rather difficult operating environment.
On the earnings front, the forecasted trend is similar to sales, although more amplified. The following table displays consensus earnings estimates through mid-decade. I have highlighted in yellow the PE multiple on the current year’s estimate.
The following table displays several valuation metrics and compares the current valuation to the sector median and to William’s Sonoma’s 5-year average.
Trading at 8.5x estimates, the market is clearly pricing in a sizeable miss to earnings estimates for 2023. This is made clear in the comparison to both the sector median and Williams-Sonoma’s 5-year average multiple.
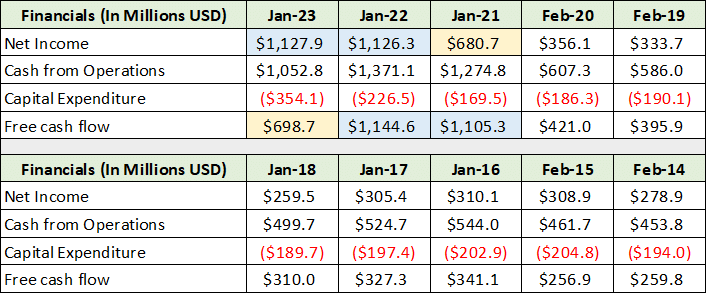
The following table displays Williams-Sonoma’s historical earnings and cash flow performance. I have highlighted in blue the positive Covid-era effects and in yellow the reversion that could be in play for earnings.
For reference, the consensus earnings estimate for the current year translates into $920 million on the current share count. This compares to roughly $700 million per year as seen in the yellow highlighted cells. If Williams-Sonoma were to earn closer to $700 million, it would translate into $10.41 per share versus the consensus estimate of $13.69.
I view the current share price near $116 as largely pricing in this type of disappointment. That said, such a miss would likely result in a violent price reaction which would open the door to an asymmetric risk/reward opportunity.
Technicals
Importantly, Williams-Sonoma has an active share repurchase program which amounts to 13% of the current market capitalization. This will lend sizeable support to the company’s earnings per share and share price going forward. As the highest quality name in the home furnishings industry, and trading at a deep discount, the technical picture offers a tactical perspective for accumulation.
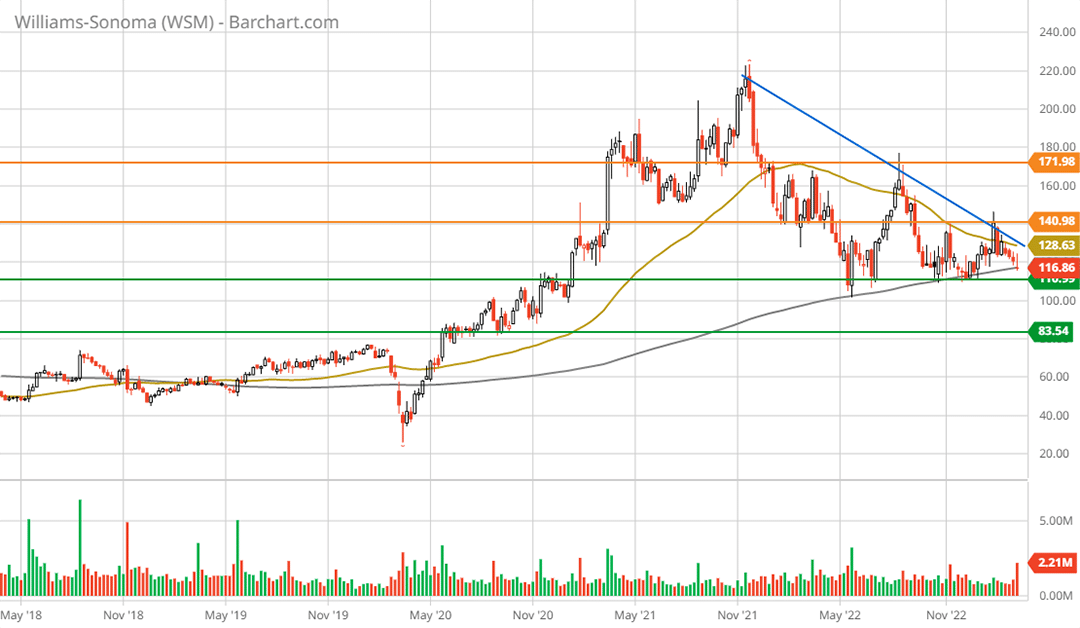
Beginning with a bird’s eye view, the following long-term monthly chart sets the stage. On the following charts, the orange lines represent key resistance levels while the green lines represent the primary support zones.
The post-Covid explosion of Williams-Sonoma’s sales and the spike in home prices are reflected in the vertical price move shown above. Note that the blue line is the current downtrend which is more visible on the following 5-year weekly chart.
The defining technical feature near term is visible in the relationship between the top green line and the blue trend line. The price pattern is referred to as a descending triangle. Technically speaking, a bearish price trend is in place as the interpretation is a likely breakdown below the nearby support level around $110.
If so, the second support level is in the low $80 range and represents 28% downside potential ($116 to $83). The following 1-year daily chart provides a closer look.
Notice that the 50-day moving average (the gold line) is beneath the 200-day moving average (the grey line). This lends support to the bearish interpretation of the descending triangle price behavior. The upside potential to the two resistance levels (the orange lines) is 22% and 48%, respectively.
Summary
The bearish technicals align with the challenging demand conditions facing Williams-Sonoma. With the shares trading at 8.5x earnings estimates against a historical average in the mid-teens, the market has priced in a material miss to consensus earnings estimates.
Given the bearish conditions, material share price weakness near term could open the door to an exceptional risk/reward opportunity in Williams-Sonoma. A retest of the low $80’s support zone would expand the upside potential to between 70% and 107%, using the two resistance levels as the price targets. Fundamentally, these price targets in the mid-decade time frame are well supported.
Such an opportunity, if it develops, is likely to be short-lived. The company is the industry leader and is currently trading at a significant discount to the sector and its historical norms. Due to this, the shares are likely to be in high demand on a lower price test. The downside protection is further supported by the 3% dividend and large share repurchase program.
Williams-Sonoma should be placed on the accumulation radar of stock investors as an increasingly asymmetric risk/reward opportunity is unfolding as it transitions from the eye of the storm.
Price as of this report: $116.86


