I am assigning PayPal Holdings, Inc. (NASDAQ:PYPL) a positive risk/reward rating based on its consistent peer-leading growth combined with a deeply discounted valuation and a leading market position. PayPal’s industry leading position places it at the forefront of the fintech space at an important inflection point, opening the door to an immense opportunity set.
Risk/Reward Rating: Positive
Incredibly, PayPal’s sales are expected to surpass Visa’s (NYSE:V) in 2022. Visa was founded in 1958, while PayPal was launched in 1998. This highlights the accelerated growth opportunities in the fintech space. The growth potential is on full display when comparing PayPal to each of the industry leaders, Visa and Mastercard (NYSE:MA).
Peer Comparison: Sales Growth
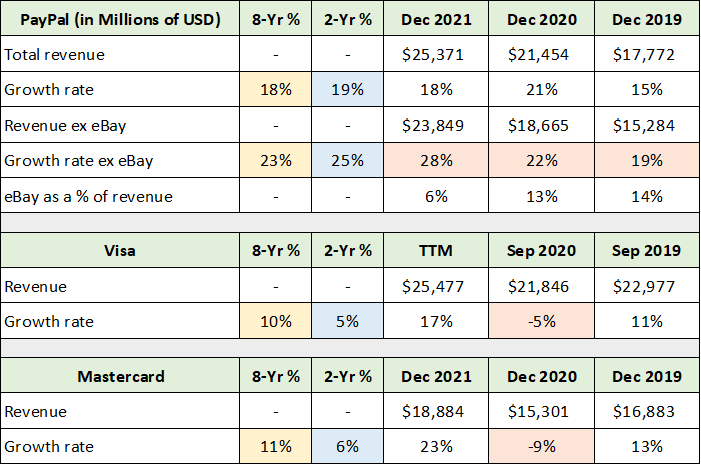
PayPal has consistently achieved a substantially higher growth rate than Visa and Mastercard over the past eight years. The following table was compiled from Seeking Alpha and displays data from the income statements of PayPal, Visa and Mastercard. PayPal’s eBay-related data was compiled from PayPal’s 2021 10-K, 2018 10-K, and 2015 10-K filed with the SEC. The comparable data for each company has been color coded for ease of contrast. Please note that PayPal and eBay Inc. (NASDAQ:EBAY) are winding down their relationship rendering the ex-eBay sales the most relevant. PayPal was spun out of eBay in 2015. eBay represented fully one-third of PayPal’s sales as recently as 2013 (the base year for the period analyzed here).
Source: Seeking Alpha. Created by Brian Kapp, stoxdox
I have highlighted in yellow the growth rate over the 8-year period from 2013 through 2021. This period represents an accurate picture of the relative performance of the three firms. Notice that PayPal’s 23% annualized sales growth over this time is more than double that of Visa and Mastercard at 10% and 11%, respectively. The growth rates over the 2-year period from 2019 through 2021 are highlighted in blue and capture the effects of the COVID shutdowns.
From a business model perspective, it is important to note that both Visa and Mastercard were heavily impacted by COVID, and the resulting decline in physical movement and related spending. On the other hand, PayPal received a material boost from the migration to online spending. I have highlighted these trends in orange. Notice that PayPal’s growth accelerated from 2019 through 2021. This contrasts with Visa and Mastercard, which were growing near their historical average growth rates in 2019 before experiencing a contraction in 2020, followed by a snap back in 2021.
The COVID impacts are important to keep in mind during 2022 as a reversion to the mean in the growth rates for the three companies looks likely. In essence, Visa and Mastercard should continue to post relatively strong sales in 2022 compared to PayPal, as they return to the 10% to 11% annualized sales growth experienced over the past eight years. PayPal’s growth in 2022 is likely to be historically weak as the 28% growth posted in 2021 (excluding eBay) experiences a reversion toward the 23% growth rate achieved over the prior eight years.
PayPal’s reversion to the mean may also entail a return to the 18% growth rate in total sales experienced since 2013 (including eBay). It would not be surprising for PayPal’s growth rate, excluding eBay, to begin to slow toward the high teens as its revenue base becomes larger making growth more difficult.
Consensus Sales Estimates
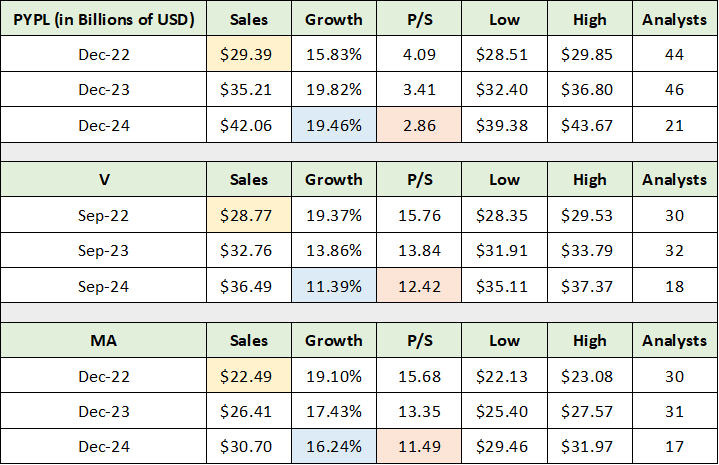
With the sales trends and growth rates in hand, we can begin to place consensus growth expectations into context to understand what the market is pricing into the shares of the three companies. The following table was compiled from Seeking Alpha and displays the consensus sales and growth expectations for PayPal, Visa, and Mastercard. I have color coded the relevant data for ease of comparison.
Source: Seeking Alpha. Created by Brian Kapp, stoxdox
I have highlighted in yellow the total sales expectations for each company in 2022. 2022 is on pace to be the first year that PayPal surpasses both of its industry-leading peers. Sales growth expectations for 2024 are highlighted in blue. This year is important as a reversion to the mean following the COVID distortions will be fully in the rearview mirror by 2024, if not 2023.
The 19% and 11% sales growth expectations for PayPal and Visa in 2024 are in line with the historical growth rates since 2013. Analysts are clearly expecting PayPal’s growth to slow from 23% (excluding eBay) to 19%, which appears quite reasonable and not overly optimistic. The 11% expectation for Visa is remarkably close to its historical growth rate of 10%. Estimates for 2023 for both companies look to be realistic, while leaving the door open to the possibility of surprises; PayPal could outperform the 20% growth expectation for 2023 and Visa could underperform the 14% growth expectation in 2023. This is especially true if the reversion to the mean is completed by the end of 2022 rather than 2023.
Growth expectations for Mastercard in 2023 and 2024 at 17% and 16% are well outside of the historical growth average. Recall that Mastercard achieved annual sales growth of 11% from 2013 through 2021. As a result, consensus growth expectations for Mastercard appear to be aggressive and are therefore at an elevated risk of disappointment looking out to 2023 and 2024.
I have highlighted in orange the price-to-sales valuation for each company based on 2024 sales estimates. Notice the incredible valuation difference between PayPal and its two largest peers. PayPal is being valued at under 3x expected 2024 sales, while Visa and Mastercard are each valued near 12x expected 2024 sales.
Historical Revenue Volatility
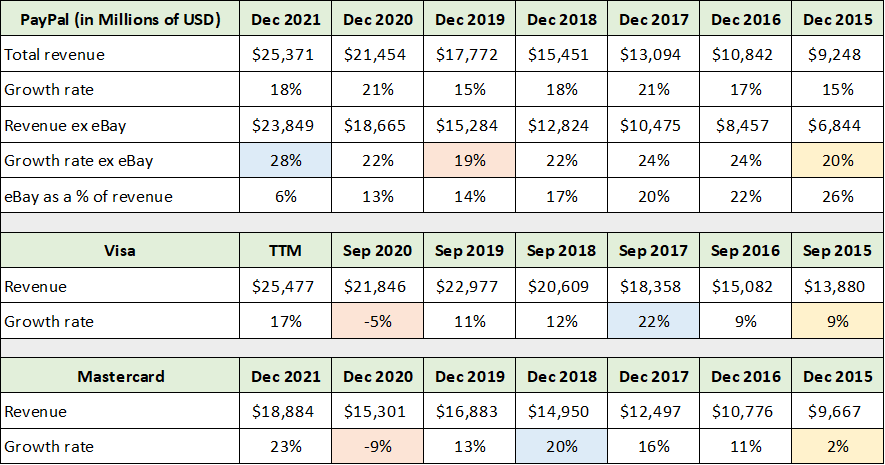
To gain a better understanding of the sales patterns for the three companies, the following table displays the high and low annual sales growth rates for each company since 2013. The high growth rate for each company is highlighted in blue while the low growth rate for each is highlighted in yellow. 2013 and 2014 are excluded from the table as they were in the middle of the growth range.
I have highlighted in yellow important growth rates that are between the high and low of the historical range. They are informative in regard to the growth trajectory of each company. The table was compiled from the income statements provided by Seeking Alpha. PayPal’s eBay-related data was compiled from PayPal’s 2021 10-K, 2018 10-K, and 2015 10-K filed with the SEC.
Source: Seeking Alpha. Created by Brian Kapp, stoxdox
Looking at the low historical growth rates highlighted in orange, PayPal’s low growth year came in at an impressive 19% compared to contracting numbers for both Visa and Mastercard. Keeping in mind that the contractions for Visa and Mastercard were caused by COVID, the yellow highlighted cells provide added context as they represent the next lowest growth rate for each company since 2013. Visa actually posted 8% growth in 2014 which was similar to 2015. It is interesting that all three experienced slower growth simultaneously in 2015, pointing toward common macroeconomic factors affecting each company.
It is clear that PayPal’s growth rate under slower macroeconomic conditions remained more than double its top peers, which is in line with the average annual growth differential of 23% compared to 10% and 11% discussed above. Interestingly, Visa and Mastercard’s best growth years (highlighted in blue) are on par with PayPal’s average growth rate. Importantly, from a casual glance at the annual growth rates for each company, PayPal’s annual sales growth has been extraordinarily consistent compared to that of Visa and Mastercard.
Peer Comparison: Earnings Growth
Turning to earnings, the operating income performance of the three companies is incredibly consistent with the sales growth trends discussed above. The following table was compiled from Seeking Alpha using the income statements for each company. I have highlighted the annualized operating income growth for each company over the past eight years.
Source: Seeking Alpha. Created by Brian Kapp, stoxdox
PayPal’s operating income growth is in line with the 18% annualized growth in total sales (including eBay). Similarly, the 11% annual operating income growth posted by both Visa and Mastercard is nearly identical to each company’s sales growth of 10% and 11%, respectively. The variability of operating income for the three companies is identical to the revenue variability discussed above. Given that operating income has closely tracked the sales growth trend for each company, we can now place consensus earnings growth estimates into context.
Consensus Earnings Growth
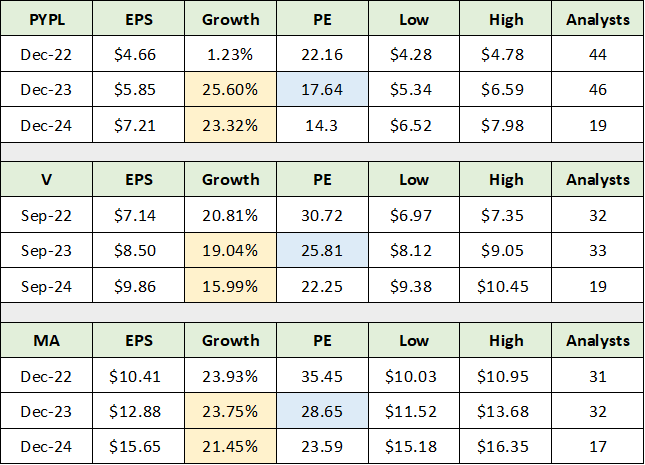
The consensus earnings estimates are best viewed from 2023 onward given that 2022 will feature a reversion to the mean from the COVID disruptions as discussed above. The following table was compiled from the consensus growth estimates provided by Seeking Alpha. I have colored coded the key data points for ease of comparison.
Source: Seeking Alpha. Created by Brian Kapp, stoxdox
The most striking feature of the consensus earnings growth estimates is that they are well outside of the historical growth rates for Visa and Mastercard (highlighted in yellow). Recall that each company has grown its operating income at 11% annually over the past eight years. Mastercard’s earnings estimates look to be exceptionally aggressive at well over double its historic growth rate. Visa’s estimates also appear to be optimistic compared to its historical trends.
As a result, there is a heightened risk of earnings disappointment for both Visa and Mastercard in 2023 and 2024. Additionally, the earnings estimates for each are materially more elevated than the sales estimates (covered previously) in relation to historical trends.
PayPal’s earnings estimates for 2023 and 2024 are also high relative to its historical 18% operating income growth rate. The difference for PayPal is that earnings are expected to grow just 1% in 2022 due to an unusually low tax rate combined with the elevated sales growth achieved in 2021. As a result, PayPal’s earnings growth estimates for 2023 and 2024 would be very much in line with its historical 18% operating income growth rate, if not for the unusually low growth expected for 2022.
I have highlighted in blue the valuation of each company on expected earnings for 2023. Notice that PayPal is valued at a 31% discount to Visa and a 38% discount to Mastercard using consensus earnings estimates for 2023. These are massive discounts for PayPal given that the company has consistently grown at nearly twice the rate over the past eight years. That said, the discounted valuation on earnings pales in comparison to the discounted valuation on sales at under 3x 2023 sales. This is compared to 14x and 13x 2023 sales estimates for Visa and Mastercard, respectively.
Consensus Expectations Summary
What we can say upon reviewing the historical growth trajectories and future expectations for the three companies is that expectations for Visa and Mastercard are well above their respective trends. This opens the door to significant disappointment in 2023 and 2024. In the case of PayPal, given its large valuation discount alongside growth estimates being in line with historical trends, it is clear that the current share price is discounting future disappointment.
The following table confirms these observations and was compiled from Seeking Alpha. It displays the trailing 12-month PE for PayPal, Visa, and Mastercard in relation to each of their average PEs over the past five years.
Source: Seeking Alpha. Created by Brian Kapp, stoxdox
PayPal is the only company of the three that is trading at a material discount to its average valuation over the past five years (highlighted in blue). I have highlighted in yellow the 5-year average PE for each company to call attention to the fact that PayPal has traded in line with the group historically. In fact, PayPal has historically traded at a 22% premium to Visa and a 10% premium to Mastercard.
Given that PayPal is currently trading at a 31% and 38% discount to Visa and Mastercard respectively, barring a material dislocation from historical trends, there appears to be an exceptional risk/reward opportunity in the shares of PayPal in relation to its peer group.
Peer Comparison: Profit Margin Detail
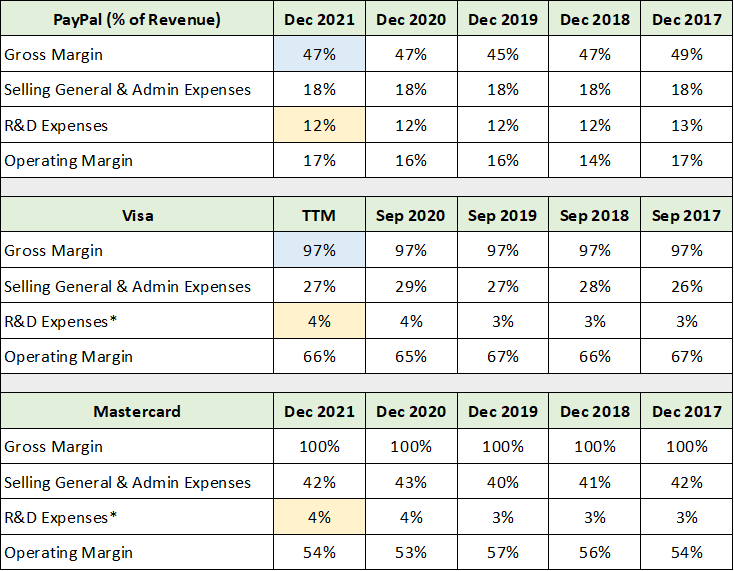
While we can say that the valuation of PayPal compared to Visa and Mastercard is at a historic discount, the correct relative valuation remains an open question. The primary difference in the business models of PayPal and its two leading peers becomes evident when examining the margin structure of each company. The following table was compiled from the income statements on Seeking Alpha for each company. I have color coded the comparable data for ease of use.
Source: Seeking Alpha. Created by Brian Kapp, stoxdox
Gross margin is the key differentiator between PayPal and its peers. Visa and Mastercard each have nearly 100% gross margins for all intents and purposes given their long-standing position at the core of the global payment ecosystem. This unusually high gross margin is somewhat compensated for by much higher selling, general, and administrative expenses compared to PayPal.
Importantly, PayPal invests four times as much in research and development as a percentage of sales as does Visa and Mastercard. In fact, PayPal invested over $3 billion into research and development in 2021 compared to $1.7 billion by Visa and Mastercard combined. While spending does not guarantee success on the innovation front, it is generally a prerequisite. As a result, PayPal should be well-positioned to maintain its historic growth rate advantage over Visa and Mastercard.
That said, given the extraordinary gross profit margin advantage on display in Visa and Mastercard’s business models, it is likely that PayPal will not trade at a substantial valuation premium to Visa and Mastercard in the future. I suspect the 5-year historical valuation premium of 22% to Visa and 10% to Mastercard represents a relative valuation upper limit for PayPal going forward. As a reminder, the current relative valuation of PayPal is at a substantial discount of 31% to Visa and 38% to Mastercard.
PayPal: Margin Expansion Potential
While I don’t expect PayPal to be able to expand gross margins materially for the foreseeable future, there is meaningful margin expansion opportunity in its operating costs. The following table was compiled from Seeking Alpha (employee count), and the most recent 10-K filed with the SEC by PayPal, Visa, and Mastercard.
Source: Seeking Alpha. Created by Brian Kapp, stoxdox
I have highlighted the total number of employees for each company. PayPal has 44% more employees than Visa and 29% more than Mastercard. It appears that PayPal has considerable ability to improve productivity and expand profit margins by better aligning its labor costs with its peers.
In addition, PayPal spends nearly twice as much as Visa and Mastercard combined on research and development. This appears to be quite high and should offer material margin improvement potential if better aligned with its top peers.
Finally, on the Q4 earnings call PayPal management stated that they will be ratcheting back on marginal and lower return sales and marketing expenses. All told, PayPal has substantial room to move its operating income margin from 17% toward the incredible 66% and 54% of Visa and Mastercard, respectively. While PayPal will never get close to those operating margins, there is substantial improvement potential from just 17%.
Note on Block (Square)
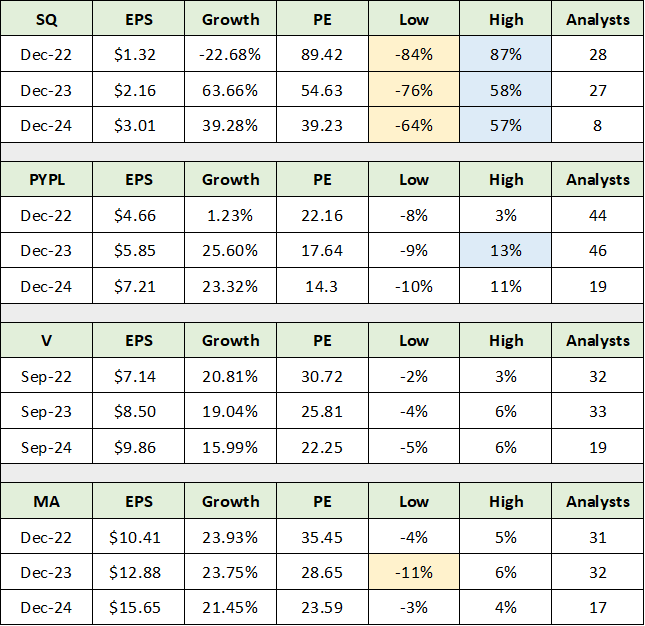
Before wrapping things up, it is important to mention Block Inc. (NYSE:SQ) as it is a top competitor of PayPal’s. I decided to exclude Block from this comparable analysis as its operations are extraordinarily volatile in relation to PayPal, Visa, and Mastercard. The following table was compiled from Seeking Alpha and displays consensus earnings estimates including those for Block. I have highlighted in blue the high and in yellow the low earnings estimates for Block. I have done the same for PayPal, Visa, and Mastercard combined.
Source: Seeking Alpha. Created by Brian Kapp, stoxdox
Please note that the high and low columns represent the high and low analyst earnings estimates for each year as a percentage of the consensus earnings estimate each year. Analyst estimates for Block are incredibly dispersed ranging from -84% to +87% compared to the consensus estimate. This range is well outside of the maximum dispersion of -11% to +13% for the entire peer group.
In essence, the expected growth and earnings trajectory for Block is simply not comparable to the high confidence estimates on display by the low dispersion of estimates for PayPal, Visa, and Mastercard. Additionally, Block is heavily focused on Bitcoin which renders its vision of the future distinctly different from the peer group which view Bitcoin as a small product within the larger fintech space. For those interested in greater detail on Block, I recently reviewed the investment case for Block and hope to update it shortly given the substantial price correction.
Technicals
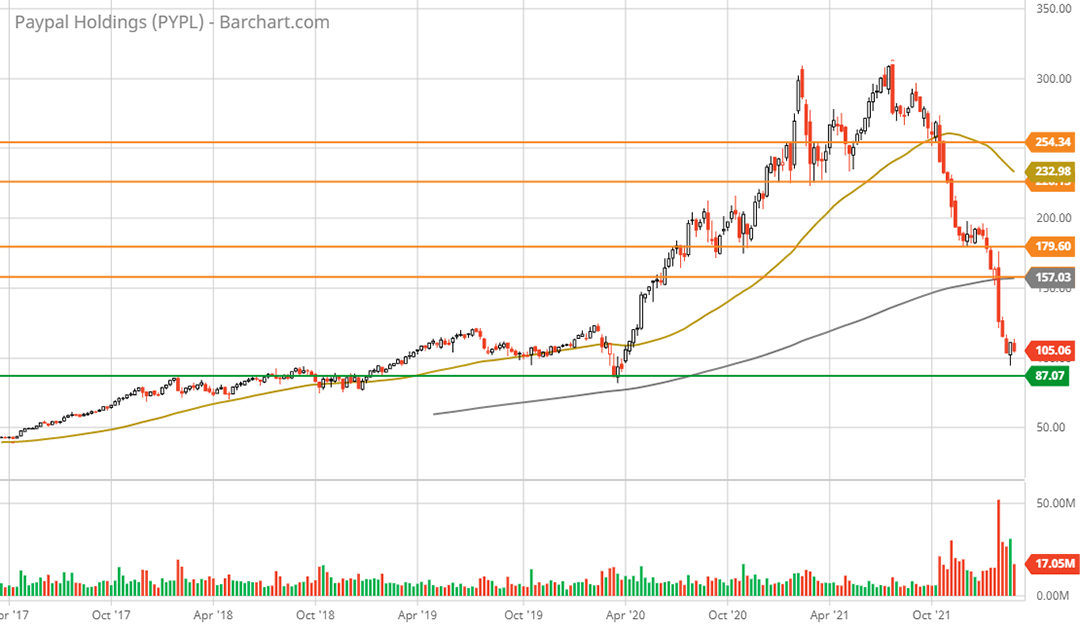
From a fundamental and relative valuation perspective, PayPal certainly appears to offer an asymmetric risk/reward opportunity. In fact, the technical backdrop fully supports this upside return asymmetry. The 5-year weekly chart below encapsulates the technical backdrop for PayPal. I have highlighted key resistance levels with the orange horizontal lines and the primary support zone is represented by the green line.
PayPal 5-year weekly chart. Created by Brian Kapp using a chart from Barchart.com
The $87 area should represent incredibly strong support as it represents key resistance from 2017 and 2018. It proved to be a strong support level by serving as the bottom during the COVID market crash. This support area is now being tested. While a full test of this area could be in progress, this looks to be an excellent accumulation zone.
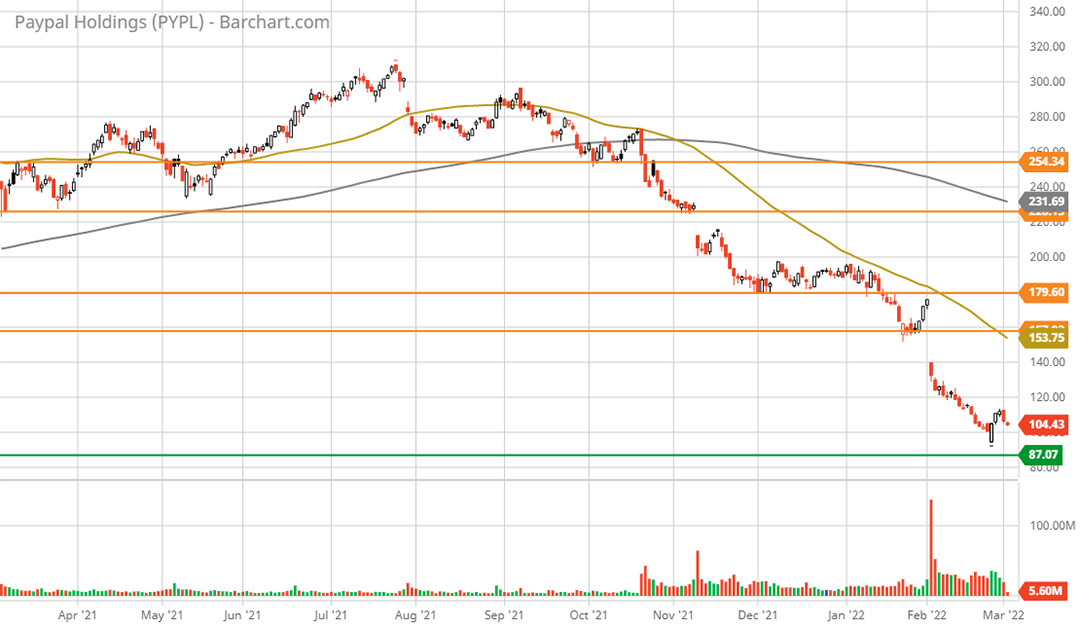
With the shares peaking near $310 in July of 2021, the current price near $102 represents a 67% valuation correction in just seven months. The speed of the descent has left resistance levels well above the current price. First meaningful resistance should be in the $158 area which represents 49% technical upside potential. The following 1-year daily chart provides a closer look at the technical overextension to the downside.
PayPal 1-year daily chart. Created by Brian Kapp using a chart from Barchart.com
The second technical resistance zone is not reached until the $180 area. This would represent 70% technical upside potential.
As discussed above in the fundamental analysis, PayPal is going to experience a reversion to the mean in 2022. The full extent of the slowdown remains uncertain. As a result, the snap back to these technical levels is unlikely to be rapid, while further base building may be necessary. Regardless, the technical risk/reward asymmetry is extraordinarily positive.
Potential Return Spectrum
Given the fundamental and technical support for PayPal’s shares, quantifying potential return scenarios is in order. The upper portion of the following table displays the return potential to each of the technical resistance lines (the orange lines) in the above charts. The lower section of the table applies a comparable PE multiple to several of PayPal’s consensus earnings estimates. The PE assumption and the year of the earnings estimate define the header row. The source of the comparable PE used to value PayPal is in the final row.
Source: Created by Brian Kapp, stoxdox
I have highlighted the potential return spectrum. The yellow highlighted cells represent what I believe to be a reasonable baseline expectation over the coming 1-3 years, while the blue cells represent a reasonable expectation over a 3–5-year time frame. The orange highlighted cells remain likely to be tested in the near term. None of this relies upon the assumption that extraordinarily bullish sentiment returns for secular growth stocks. If bullish sentiment returns to the space, returns could materialize more rapidly given the technical overextension.
Summary
All told, PayPal offers a rare asymmetric growth opportunity. The shares are unbounded to the upside while the downside is anchored by peer-leading growth, a deeply discounted valuation, and incredibly strong long-term technical support. When combined with PayPal’s leading market position and the vast opportunity set in the fintech industry, PayPal is indeed well-positioned to deliver alpha.
Price as of report: $100.23
PayPal Holdings Investor Relations Website: PayPal Investor Relations


