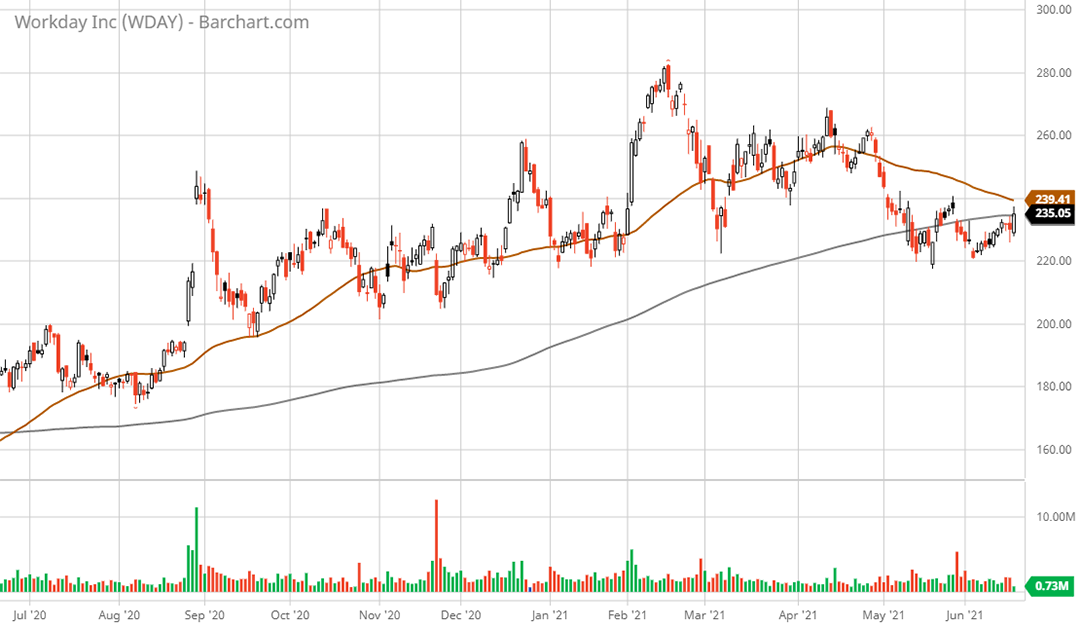
Risk/Reward Rating: Negative
Workday, which is a leading software provider of enterprise cloud applications for finance and human resources, faces stiff competition as evidenced by its expected sales growth falling to 15% for the current year. This is versus 19% the prior year which followed a year of 28% growth. Workday has exited its hypergrowth phase, yet its current valuation multiple is consistent with that of a hypergrowth company creating downside risk for the stock price.
Valuation: 81x expected non-GAAP earnings estimates for the current year and 13x expected sales. The company is not profitable under GAAP. Non-GAAP profitability largely results from ignoring the share-based compensation expense incurred on a regular basis, while the GAAP loss accounts for this expense.
The stock valuation is extreme by historical stock market standards especially when compared to the rapidly declining growth rate. The valuation compression should limit upward price momentum going forward and is likely to amplify downward stock price pressure.
The technical backdrop looks like a clear topping pattern and the stock is currently trying to retake the 200-day moving average. A head and shoulders type pattern was formed in February and March of 2021 with the head and an upward sloping neckline at the $250 level.
Technical resistance: $235 at the 200-day moving average with heavy resistance up to $250
Technical support: $200 area then the $150 area
Price as of report date 6-17-21: $235.54
Workday Investor Relations Website: Workday Investor Relations


