
Risk/Reward Rating: Negative
Twitter (TWTR) has had easy comparisons in 2021 versus depressed sales last year due to the COVID pandemic. For the second quarter of 2021, the company reported 74% revenue growth compared to last year. A more meaningful base year for comparison is 2019. In this case, total revenue for the first half of 2021 is up 37% compared to 2019’s first half, registering an average annual growth rate of 18%. Twitter’s primary revenue source is advertising which accounts for 88% of revenue.
The company reported daily active user growth over last year of 11% to 209 million users. This is an important metric for advertisers in judging the attractiveness of the Twitter platform for ad dollars. While the revenue and user growth rates are respectable, they would not be considered dynamic growth rates given the increased advertising spend online and on social media platforms in particular.
This is especially true over the past six months as advertisers spent heavily on online platforms to reach customers during the later stages of the COVID lockdowns. For example, Snap (SNAP) grew revenue 147% in the first half of 2021 compared to the first half of 2019, versus Twitter’s 37% sales growth. For further comparison, Facebook (FB) grew revenue 74% in Q1 2021 over the same period in 2019. Given the lackluster growth versus its competitors, Twitter’s valuation takes on added importance.
Twitter is trading at 134x 2021 non-GAAP (generally accepted accounting principles) earnings estimates and 63x 2022 non-GAAP earnings estimates. The non-GAAP numbers exclude stock-based compensation expense which is a material expense for Twitter. For example, the company estimates that stock-based compensation will total $600 million in 2021. Ignoring this expense accounts for much of the non-GAAP profitability. Regardless, these non-GAAP multiples are extreme from a historical market perspective.
The platform nature of Twitter’s business model does call for a premium valuation compared to run-of-the-mill companies, so it is worthwhile to view other valuation metrics. The below table reflects common business metrics used in valuation. The 2021 est.* is two times the first six months results in 2021 and is in line with the company’s guidance. It should be noted that all three metrics are in declining or stagnating trends since 2018, even when excluding the COVID year of 2020.
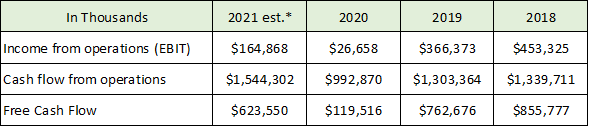
Valuation multiples based on the above metrics using the diluted share count at the end of Q2 2021:
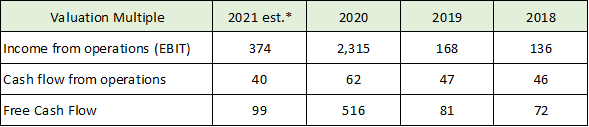
The valuation multiple remains historically extreme on each count. Finally, looking at the 2021 sales run rate, the price to sales ratio is about 13 which is also extreme in a historical context. Given the high valuation and relatively weak growth rate, there is more downside risk in the current share price leaving room for a more attractive entry point on a substantial price correction.
Technical backdrop: Twitter’s stock remains below the price achieved in its second month as a public company in December 2013. Since the IPO, the stock has been carving out a large sideways base.

Twitter 10-year monthly chart
After bottoming in the $13 area in 2016 and 2017, the stock staged a strong rally and met heavy resistance in both 2018 and 2019 in the $40 to $45 area. This $40 to $45 area was finally overcome in 2020 and should serve as future support. This was evidenced in May of 2021 with successful support just beneath $50.
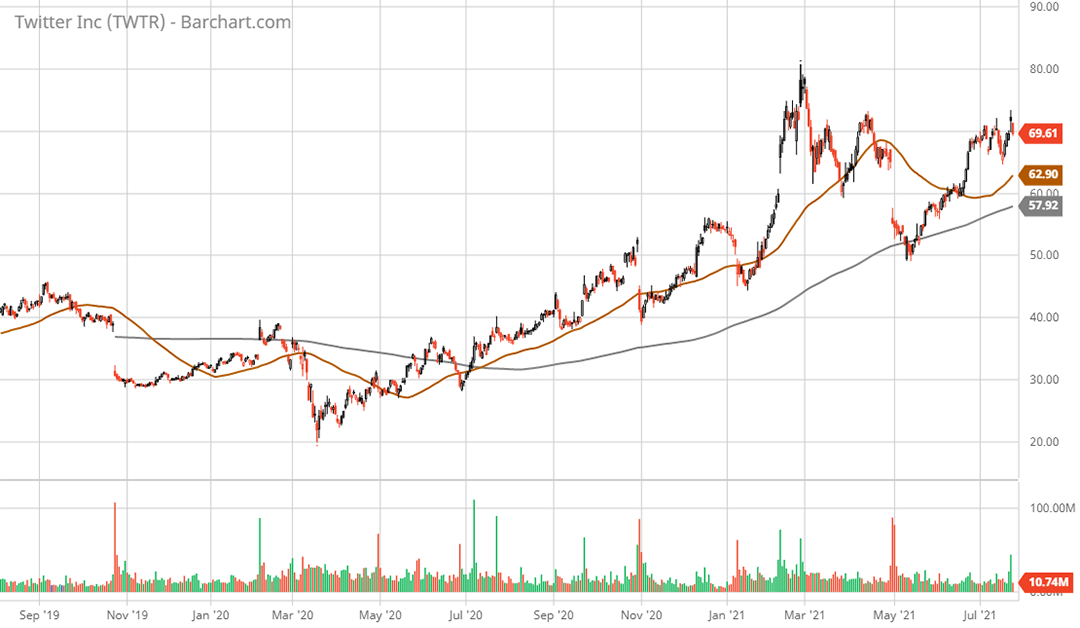
Twitter 2-year daily chart
Technical resistance: The current level to the $75 area has been resistance for the past four months. With all-time highs near $80, this area is likely to offer stiff resistance given the valuation.
Technical support: $55 which is the gap lower at the end of April 2021 and near the 200-day moving average (grey line on the 2-year daily chart). Next lower support is in the $45 area which should offer strong support.
Price as of report date 7-26-21: $71
Twitter Investor Relations Website: Twitter Investor Relations
All data in this report is compiled from the Twitter investor relations website and SEC filings, and where applicable publicly available information regarding consensus earnings estimates.