I am assigning Twitter (NYSE:TWTR) a neutral risk/reward rating based on its symmetrical expected return profile over the near term. This is a result of the competing forces of an elevated valuation and the significant untapped growth potential across a wide spectrum of non-advertising revenue streams.
Risk/Reward Rating: Neutral
Twitter is a unique platform and is arguably the most dynamic platform available for a large spectrum of social interactions. As a result, there is incredible long-term upside potential for the stock. That said, the company has yet to demonstrate an ability to leverage the Twitter platform for non-advertising revenue growth.
Advertising represents 89% of total sales and is trending higher. The growth rate of non-advertising revenue has stagnated near 10% in recent years. Jack Dorsey’s replacement is an 11-year veteran of Twitter and the previous Chief Technology Officer. There is little indication that the leadership shift will serve as a catalyst for a material change to Twitter’s historic growth trajectory. The existing growth trajectory is therefore of critical importance for the Twitter investment case.
Growth Trends
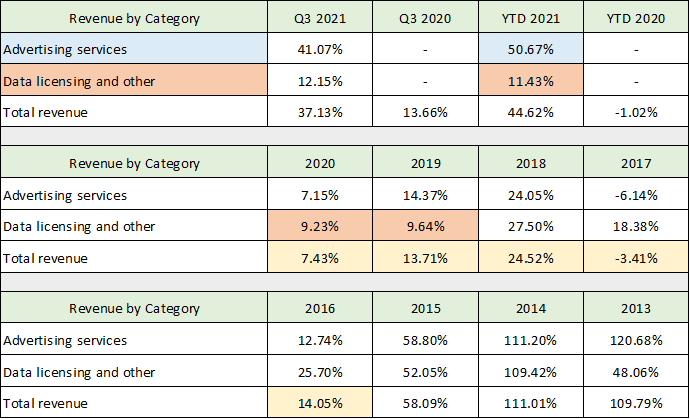
Twitter reported strong Q3 2021 revenue growth of 37% on October 26, 2021. The shares responded by falling 11% the following day as investors questioned the sustainability of Twitter’s well-above trend revenue growth of 45% through the first nine months of 2021. Adding further concern for many investors is the company’s increasing reliance on advertising sales which registered 51% year-to-date growth through Q3 2021 (highlighted in blue in the table below). Given the structure of the Twitter platform and the maturity of its market penetration, advertising growth is likely to face challenges in the future.
Growth in data licensing and other revenue streams such as subscription services has been subdued. It appears to have levelled off after 2018 in the 10% growth range (highlighted in orange in the table below). The following tables and those throughout this article were compiled from Twitter’s Q3 2021 10-Q, Q4 2020 8-K, Q4 2019 8-K, 2020 10-K, 2017 10-K, and 2014 10-K filed with the SEC. I have highlighted the cells which illuminate the underlying revenue growth trends.
Source: Created by Brian Kapp, stoxdox
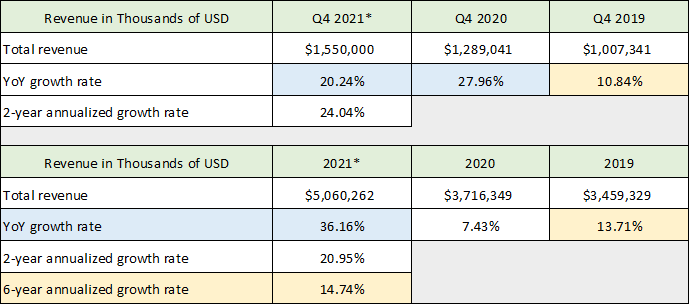
Twitter’s advertising business has benefited substantially from the COVID-era lockdowns and the resulting migration of advertising spend to online channels to capture the increased online engagement opportunity. I have highlighted in blue the exceptional advertising growth in the upper table and its effect on recent overall revenue growth in the lower table. Using the midpoint of management’s guidance for Q4 2021 (the Q4 2021* column), total revenue growth is projected to be 20% in the final quarter of 2021. This is down from 37% in Q3 2021 and 45% growth year-to-date in 2021. Looking at Q4 over the last three years, the COVID advertising spike clearly began in Q4 2020 with 28% growth compared to the pre-COVID growth rate of 11% in Q4 2019.
The two-year annualized revenue growth rate expected for Q4 2021 is a healthy 24%. However, the deceleration to 20% in Q4 2021 points toward a reversion to the underlying pre-COVID growth trend. The pre-COVID growth trend is highlighted in yellow in the above tables. The six-year annualized revenue growth rate stands near 15%. The central tendency toward mid to low teens revenue growth can be seen in the yellow highlighted cells for Q4 2019, 2016, 2019, and 2017 and 2018 combined.
The greatest area of concern is the relatively weak 10% revenue growth trend over the past three years for data licensing and other which is highlighted in orange. Non-advertising revenue is critical to the upside potential for Twitter’s shares looking forward. This is because subscription-like revenue streams receive a materially higher valuation than advertising revenue. It is due to the relative unpredictability and volatility of advertising revenue compared to recurring subscription revenue.
The historical sales record strongly suggests that low to mid-teens growth is the underlying revenue growth trajectory for Twitter.
Geographic Trends
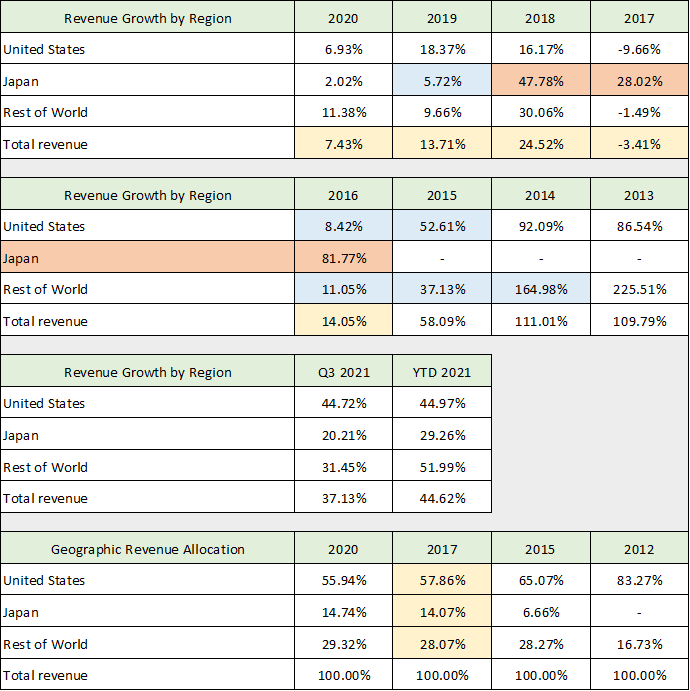
While the central tendency for total revenue growth prior to COVID looks fairly stable in the mid to low teens, the geographic composition of Twitter’s revenue is quite volatile. The following table displays Twitter’s geographic revenue growth and sales breakdown from 2012 through Q3 2021.
Source: Created by Brian Kapp, stoxdox
Twitter’s geographic volatility highlights both its core strength and weakness. The strength is on full display when viewing the case of Japan highlighted in orange in the above table. From 2016 through 2018, Japan produced extraordinary annual growth rates of 82%, 28%, and 48% respectively (one would think Donald Trump became Japan’s Prime Minister rather than the US president). These incredible growth rates cushioned the effects of a collapse in US growth after 2015, and a collapsing growth rate in the rest of the world following 2014. Twitter’s international diversification is a core strength.
The collapse in growth rates ex-Japan following 2014 and 2015 as well as Japan’s collapse in 2019 are highlighted in blue and illuminate the core weakness of the company’s business model. Please review the historical growth record for each region shown above. You will notice that Twitter produces massive revenue growth over a condensed period of time in a given region (roughly three years) which is followed by a collapse toward single digit growth rates. This volatility reflects what I view as the viral nature of Twitter’s platform as well as the company’s focus on advertising rather than subscriptions.
The viral nature of its platform and the reliance on advertising sales are core weaknesses for Twitter. Other platforms like TikTok and YouTube are more effective for creating viral content that is attractive to advertisers from both a targeting and content control perspective. Facebook (NASDAQ:FB), Google (NASDAQ:GOOG), and Apple (NASDAQ:AAPL) are more effective for advertisers in targeting and customizing their message. These are just a few examples of Twitter’s competitive disadvantage in advertising.
Twitter is dependent on its user base to generate content and engagement for which it has no control outside of using its algorithms to amplify certain user content. The lack of content control and the largely anonymous user base creates challenges from the perspective of an advertiser. Twitter’s reliance on algorithms to amplify select content in order to generate user engagement that is sufficient to be monetized creates a structurally negative feedback loop for the majority of its users over the longer term.
Elon Musk and Donald Trump, with over 60 million followers each, are two extreme examples of this feedback loop dynamic for the majority of users. Each received extraordinary value from the Twitter platform. In Elon Musk’s case, he does not have to spend money on advertising for Tesla or his other investment ventures as his tweets are amplified around the world instantly. Donald Trump achieved the same leverage on the platform and became president of the United States.
The vast majority of users are Twitter’s product. Twitter then monetizes this product by leveraging viral content creators. It is a common dynamic in the digital world, however, the economic value proposition of the Twitter platform is heavily skewed toward an exceedingly small percentage of users. I am not suggesting that users do not receive value from Twitter, rather, my focus is on the economic value proposition of the platform. This appears to create a negative feedback loop for long-term user engagement and is a probable cause of Twitter’s history of rapid growth followed by a collapsing growth rate.
Key Performance Indicators
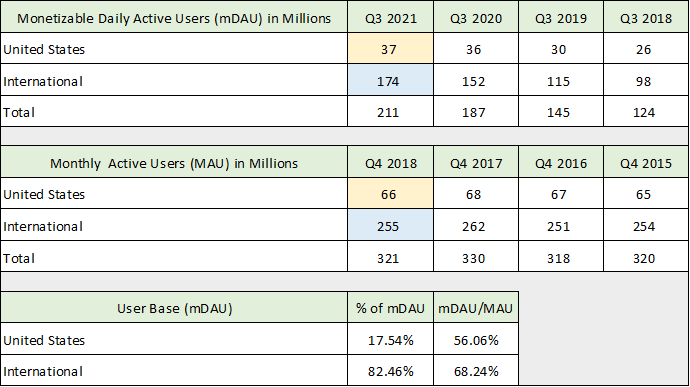
There is evidence of a user engagement problem in the historical record of Twitter’s Key Performance Indicators or KPIs. Through Q4 2018, the company tracked and presented MAU or Monthly Active Users as its key gauge of success. The gauge measured exactly what it sounds like, monthly active users. In 2019 Twitter switched this long-standing key indicator to mDAU or monetizable Daily Active Users. The following table displays the history of Twitter’s MAU measurement from 2013 through 2018, which is important for providing background on the user engagement issue.
Source: Created by Brian Kapp, stoxdox
I have highlighted in blue the rapid growth slowdown that occurred from 2013 through 2015. Recall from the revenue discussion above that sales growth collapsed after 2015 in the United States and the rest of the world excluding Japan. It is clear from this record that user growth leads revenue growth. This makes sense because Twitter is monetizing its user engagement. An advertiser needs proof of engagement which Twitter can only prove after the engagement has occurred. As a result, advertising sales logically follow trailing engagement statistics.
I have highlighted in yellow the MAU growth rates leading into Twitter’s KPI change. Stagnation and decline began in 2016 and continued through 2018 when the company abandoned MAU for mDAU. The historical record depicts a mature company that largely penetrated the majority of the global market by the end of 2015. The following table presents the actual number of MAU until the termination of the measure as well as the new KPI, the number of mDAU. The numbers are in millions of users.
Source: Created by Brian Kapp, stoxdox
The stagnation of MAU following 2015 is visible in the middle section and reaffirms the degree of market penetration achieved by 2015. MAU may serve as a proxy going forward for the total potential market of mDAU that Twitter can reach. The lower section of the table shows the potential market penetration if this is correct (mDAU/MAU column). Please note in this lower section the percentage breakdown of Twitter’s user base, which is roughly 18% US and 82% international.
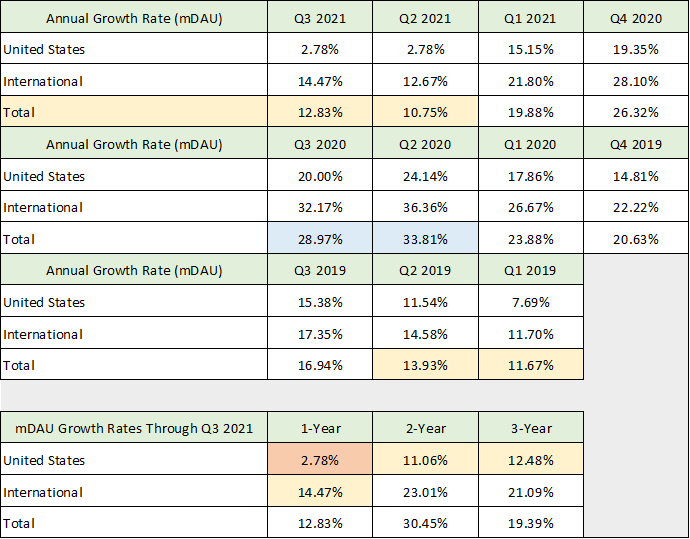
The less than 18% weighting toward the US looks likely to remain as US mDAU has largely stagnated over the past year at 37 million (highlighted in yellow). International mDAU continues to grow through Q3 2021 at 174 million, however, growth is decelerating rapidly (highlighted in blue). The following table provides a better sense for the growth trajectory of mDAU.
Source: Created by Brian Kapp, stoxdox
Recall from the discussion of MAU that revenue growth has historically lagged Twitter’s key performance indicator. In the case of MAU, users grew at 11% in Q4 2015 before turning negative which was followed by collapsing revenue growth rates.
In the upper section of the above table, I have highlighted the most recent two quarters of mDAU growth in yellow which is in the 11% range. Notice the clear spike in mDAU in response to COVID with peak growth occurring in Q2 and Q3 of 2020 (highlighted in blue). The revenue growth spike to 45% through the first nine months of 2021, from only 7% in 2020 and 13% in 2019, is following the growth of mDAU as was the case with MAU historically.
The decelerating mDAU trend and the correlation of past KPIs to subsequent revenue growth points toward the potential for rapid revenue growth deceleration heading into 2022. The yellow highlighted cells throughout the above table suggest that the central growth trajectory of mDAU is in the same low to mid-teens range as was the case with revenue growth discussed above.
Risk to Consensus Growth Estimates
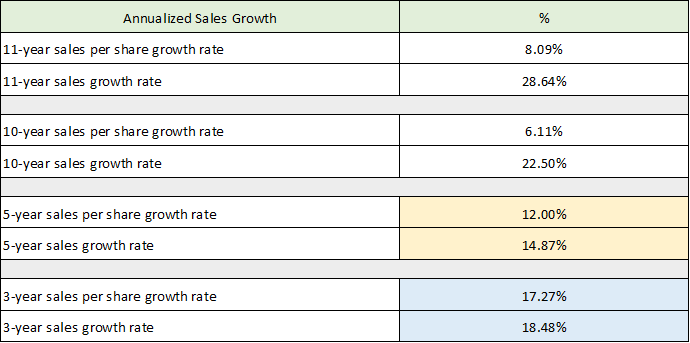
The evidence to this point supports a revenue growth trajectory in the mid to low teens on average, with the possibility of extreme revenue volatility as was seen in 2017 and 2018 in the first table. Recall that revenue contracted 3.5% in 2017 before rebounding 24.5% in 2018. In the following two tables I compare the historical growth record from Twitter’s SEC filings to the current consensus estimates for revenue growth which were compiled from Seeking Alpha. Please note, that the Trend* column depicts the midpoint of the company’s guidance for Q4 2021 followed by 14.74% annual revenue growth going forward. 14.74% growth is the actual 6-year annualized revenue growth rate through Q4 2021 (shown in the first table of this article).
Source: Created by Brian Kapp, stoxdox
In the top portion of the table, I have highlighted in yellow what I view as the most likely organic growth trend as the 3-year growth rate is likely artificially inflated as a result of COVID. Also note that I have included the sales growth rate on a per share basis to highlight the dilution caused by Twitter’s rapid share count growth. While sales have grown at 29% annualized over the past 11 years, sales per share only grew at 8%. From a shareholder perspective, 8% is the actual sales growth rate for the past 11 years.
In the lower section of the table, I have highlighted in blue the estimates I believe to be at a heightened risk of disappointment. The 22% revenue growth expectation for 2022 looks to be aggressive compared to the projected 20% growth rate in Q4 2021. It is rapidly slowing from 37% growth in Q3 2021 and 45% growth through the first nine months of 2021. The estimates look especially aggressive when combined with the historical trends toward low to mid-teens revenue growth.
I have highlighted in yellow the estimated sales for 2022 and 2023 using the historical revenue growth trend of 14.74% as well as the lowest analyst estimate for each year. It is important to note that the lowest analyst estimate for each year going forward is at or above the 14.74% growth trajectory. This means that my estimated central growth trajectory in the low to mid-teens (which is purely drawn from historical data) is below the most bearish analyst trajectory.
It must be noted that there are no bearish forecasts for Twitter. All revenue estimates are above the historical growth trajectory. The 2022 to 2023 period presents a heightened risk of revenue growth disappointment.
Profitability
While future shareholders face a heightened risk of revenue growth disappointment, historically Twitter has produced disappointing and erratic profitability. There appears to be substantial room for margin improvement and greater operational stability at Twitter which could bolster the investment case looking forward.
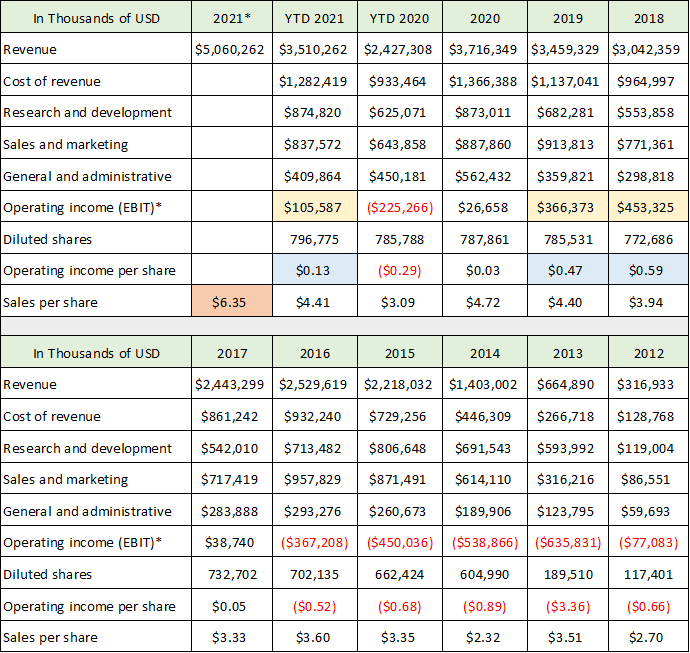
Uncovering the underlying profitability of the business model is challenging and requires a review of both the income statement and cash flow statement. The following table displays key line items from Twitter’s income statement. Please note that the key operating income data highlighted below represents my estimate of profitability before interest expense and taxes, or EBIT. I will focus on the data since 2018 while the historical data is included for reference.
Source: Created by Brian Kapp, stoxdox
The yellow highlighted cells for 2018 and 2019 reflect Twitter’s peak operating income years with an absolute high of $453 million in 2018. Additionally, the blue highlighted cells reflect these peak operating earnings on a per share basis. At the current price per share of $42.82, Twitter is trading at 75x peak operating earnings. On this basis, Twitter became profitable for the first time in 2017 with erratic profitability ever since. This measure is a fair gauge of Twitter’s underlying earnings power as things stand.
Cash Flow
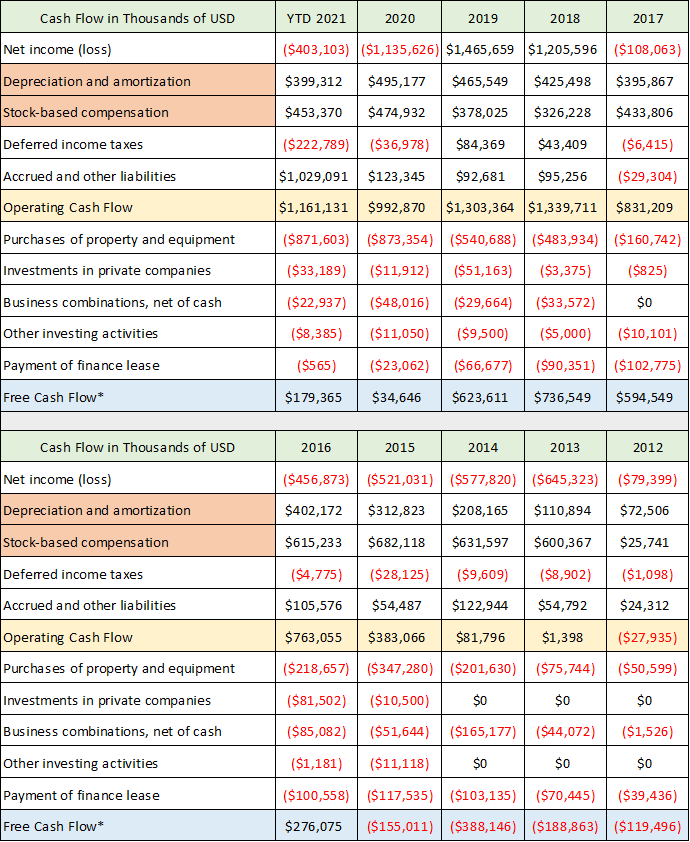
The expense figures above include heavy use of stock-based compensation which must be weighed. In this respect, the cash flow performance of Twitter sheds additional light on the underlying earnings power of the business model. The following table presents select data from Twitter’s cash flow statements. I have highlighted the actual cash flow from operations in yellow and presented my best estimate of free cash flow which is highlighted in blue. Please note I have highlighted in orange the cash flow items that require judgement as they are non-cash expense items.
Source: Created by Brian Kapp, stoxdox
The peak cash flow and free cash flow years align perfectly with the peak operating income years of 2018 and 2019. I view free cash flow as a better proxy of Twitter’s underlying earnings power than cash flow from operations. The company has a very consistent history of investment requirements for property and equipment which is the primary item subtracted from operating cash flow to arrive at an estimate of free cash flow. I believe the other three reductions to arrive at a free cash flow estimate are economically correct though not as material.
Based on these estimates of earnings power, Twitter is trading at 46x peak free cash flow of $737 million in 2018 and 26x peak operating cash flow in the same year. While operating cash flow is likely to set a new high in 2021, free cash flow is running at levels similar to 2016 which is roughly one-third of the prior peak.
Non-Cash Expenses
Free cash flow is the superior measure of profitability in my opinion as it accounts for the economic reality more so than cash flow from operations. Additionally, cash flow from operations completely ignores actual economic expenses such as stock-based compensation and depreciation and amortization. For example, Twitter capitalizes a substantial amount of software development costs rather than expensing them as incurred. These costs are part of depreciation and amortization. It should be noted that this has historically been a red flag for aggressive accounting choices for some firms. Nonetheless, these are real expenses not accounted for when using cash flow from operations to gauge earnings power.
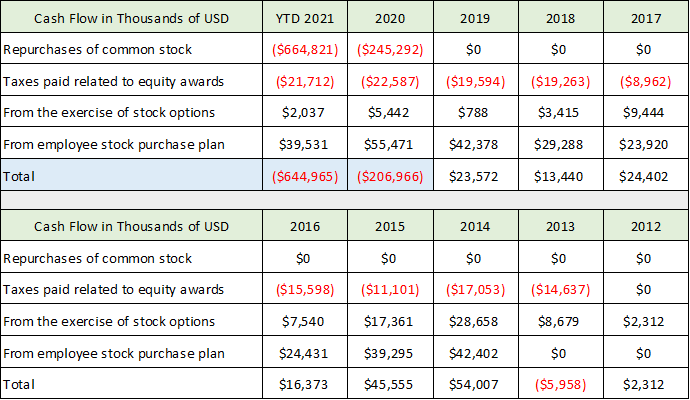
In terms of stock-based compensation expense, many market participants remove it as an expense item in viewing non-GAAP (generally accepted accounting principles) earnings. The argument here is that stock-based compensation is not a cash expense and therefore should be excluded when considering profitability. I disagree with this view as Twitter itself is beginning to demonstrate. The company has recently begun an aggressive share buyback program as can be seen in the table below (highlighted in blue).
Source: Created by Brian Kapp, stoxdox
In the past year and a half, Twitter has essentially monetized $850 million of past stock-based compensation. This act is roughly equivalent to Twitter having paid cash compensation to employees rather than stock-based compensation, and it illuminates the fact that stock-based compensation is an expense.
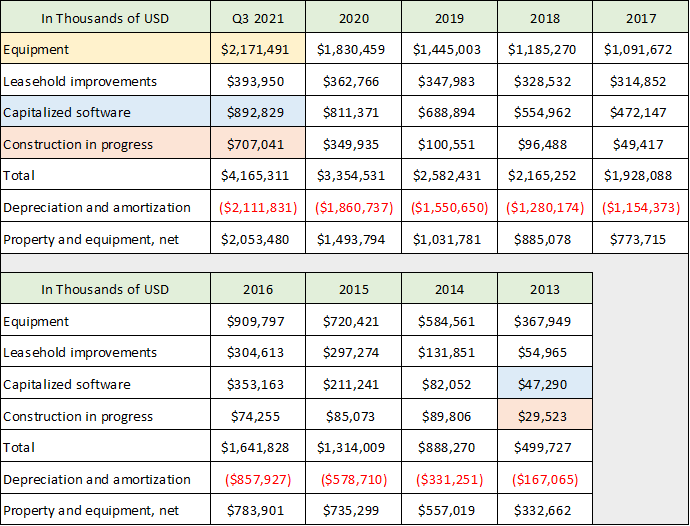
Depreciation and amortization are the other non-cash expenses that must be weighed. Here too, the expenses are real economic costs as the capitalized software example demonstrates. I have highlighted the top three categories in the following table (compiled from Twitter’s balance sheet data in the SEC filings).
Source: Created by Brian Kapp, stoxdox
The capitalized software category (highlighted in blue) and the equipment category (highlighted in yellow) are regular and recurring expenses for Twitter, and I believe they should be treated as such. Construction in progress is materially elevated compared to the historical record and could be viewed as less of a recurring expense. Given the upward trend and conservatism, I would not exclude depreciation and amortization related to this category.
Balance Sheet
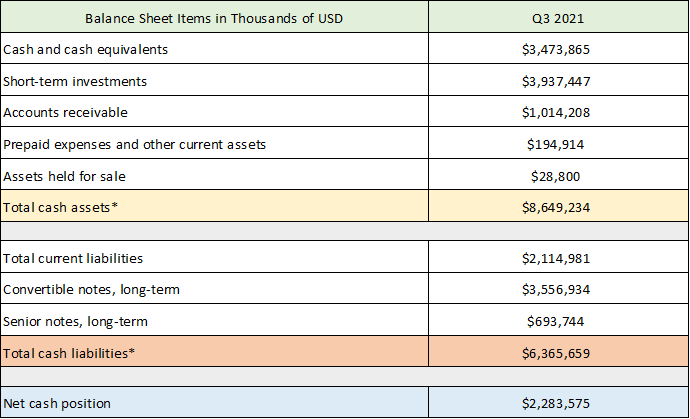
The above discussion of balance sheet items highlights the difficulty of estimating the economic value of many of Twitter’s assets. As a result, in the case of Twitter, I prefer to view the balance sheet from a pure net cash position. Twitter has a net cash position of $2.3 billion after subtracting its debt (highlighted in blue in the table below).
Source: Created by Brian Kapp, stoxdox
The company has plenty of liquidity and a strong balance sheet. Much of the debt is in the form of convertible bonds. $1.15 billion matures in 2024 with a stock conversion price of $57.14. $1 billion matures in 2025 with a stock conversion price of $41.50. These look likely to be converted before maturity barring larger negative surprises from Twitter. The remainder of the debt (which matures in 2026 and 2027) looks to be pure debt given the current share price.
Twitter’s balance sheet strength does provide it with growth optionality, whether internally via organic growth or externally via acquisitions. That said, at the moment Twitter has chosen to use its balance sheet to aggressively repurchase shares rather than pursue growth opportunities. This choice is a negative signal for future growth.
Technicals
The negative growth signal from the share buyback decision combined with Twitter’s elevated valuation at 46x peak free cash flow and 75x peak operating income place added importance on the technical backdrop for the shares. Twitter has a constructive technical backdrop looking longer term.
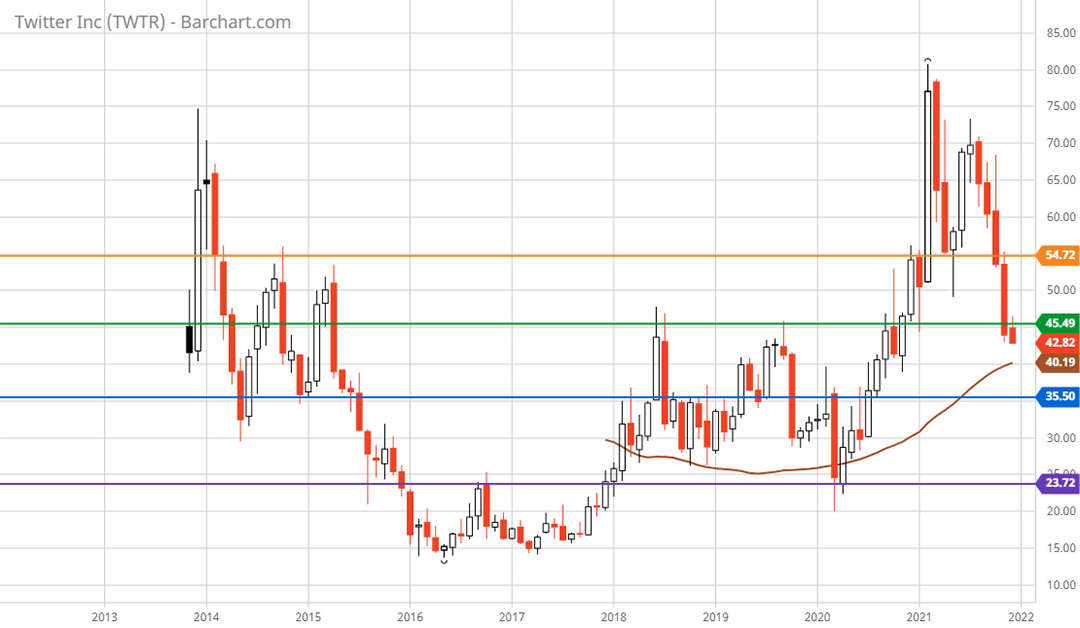
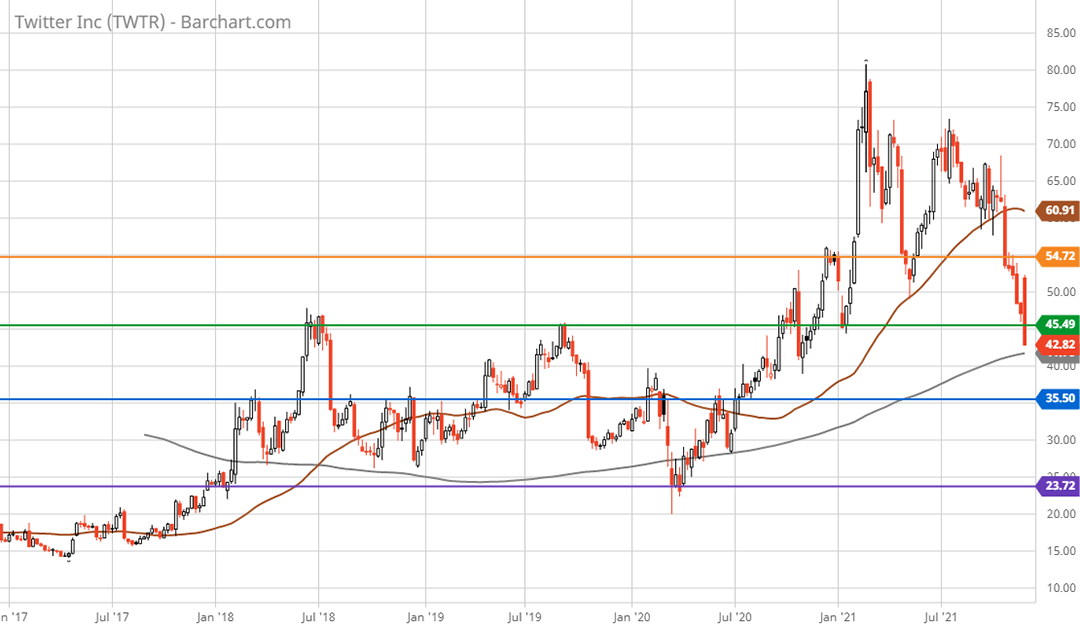
Taking a step back to look at the 10-year monthly chart below, the horizontal lines highlight the major support and resistance zones. The recent 47% decline has brought the shares to the top of a prior, prolonged consolidation phase. The green line in the $45 area represents a major area of prior resistance from 2018 through 2020. It is reasonable to expect that this level down to the blue line near $35 represents a meaningful support zone from a pure technical perspective. Furthermore, the $35 area is the midpoint of the long consolidation phase from 2018 to 2020 (between the green and purple lines). $35 represents 18% downside potential. Lower support levels cannot be ruled out as the valuation at $35 is elevated at 38x peak free cash flow and 62x peak operating income.
Twitter 10-year monthly chart. Created by Brian Kapp using a chart from Barchart.com
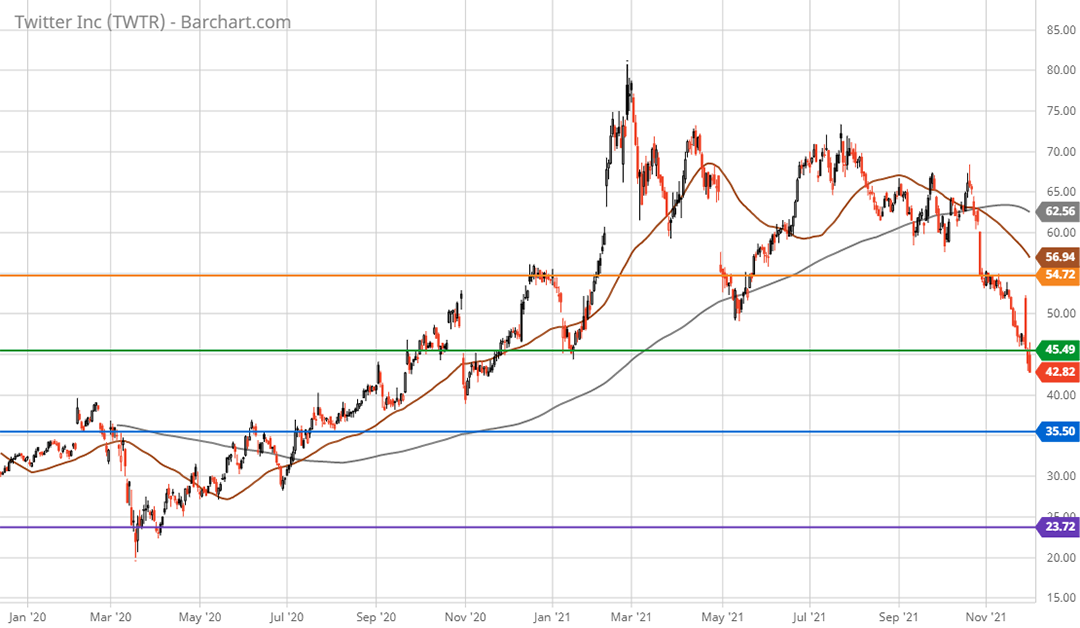
I would expect very strong support in the lower $30’s should the $35 level be breached due to lack of valuation support. The $30 level represents 30% downside potential. Zooming in to the 5-year weekly chart provides a closer look at the support zones.
Twitter 5-year weekly chart. Created by Brian Kapp using a chart from Barchart.com
I suspect that the high $20’s is a worst-case scenario barring anything unusual. At $30, Twitter would be trading at 33x peak free cash flow to date and 53x peak operating income. It should be noted that these valuations are still materially higher than the current market averages which trade between 21x and 30x forward earnings estimates (S&P 500: 21x, Nasdaq 100: 30x). Due to the valuation premium at $30, a test of the lowest support level near $24 cannot be ruled out and represents 44% downside potential.
The 2-year daily chart below, provides a closer look at the support and resistance levels.
Twitter 2-year daily chart. Created by Brian Kapp using a chart from Barchart.com
The orange line near $55 should represent heavy resistance going forward as it is broken support from the May 2021 bottom. This level represents 28% upside potential. If $55 can be overcome, the $60 area should serve as a ceiling with 40% upside potential. The elevated valuation at each of these technical upside targets supports these levels serving as heavy resistance in the near term.
Summary
Twitter is a unique company and is arguably the most dynamic platform available for a large spectrum of social interactions. As a result, there is incredible long-term upside potential for the stock.
That said, the rapidly slowing mDAU growth points toward a material slowdown in revenue growth throughout 2022. With consensus growth estimates in the 22% range for 2022 and 2023, and an unfolding reversion to the mean pointing to mid-teens growth, there is a heightened level of downgrade risk should results disappoint.
Furthermore, the valuation is well-above average while earnings have been quite volatile across all metrics. These factors suggest caution regarding earnings quality and the underlying trend. While there appears to be untapped operating leverage potential, the degree and timing remain unclear. With an 11-year Twitter veteran and CTO taking the reins, there is a strong likelihood that the company remains on its current growth trajectory.
When I began this Twitter review I was fully expecting a positive risk/reward rating given the 47% decline from the peak in February 2021. With upside potential in the range of 28% to 40% and downside potential in the range of 18% to 44%, the risk/reward tradeoff is symmetrical for Twitter. Given the neutral risk/reward setup at the current price, the area between the high $20’s and $35 looks to represent an attractive accumulation zone for long-term investors.
Price as of report date 12-5-21: $42.82
Twitter Investor Relations Website: Twitter Investor Relations


