A heightened degree of uncertainty is the defining feature of the moment. Isolating the signals from the noise is becoming increasingly difficult. In a recent interview with CNN’s Chloe Melas, Jeff Bezos described the economic climate as follows:
I don’t know whether we’re technically in a recession, economists argue over that and they have technical definitions, what I can tell you is that the economy does not look great right now… The probabilities say that if we are not in a recession now, we are likely to be in one soon. My advice to people is to take some risk off the table right now.
It’s fair to say that Bezos has an excellent view of the economy via Amazon (NASDAQ:AMZN). The heightened uncertainty is a signal that the economy is undergoing a fundamental phase change. In fact, Amazon forecasted sales for the current quarter to grow by just 2% to 8% compared to last year. While there is a material currency drag in the forecast, the numbers remain well below what investors have become accustomed to from Amazon over the years.
Phase Change
From my perspective, in regard to the economy, Bezos hits the nail on the head in the above quote. I covered the likelihood that a recession is already unfolding in the September 15 report “The recession is here, filter the noise” and the October 28 report “FedEx and the recession.”

On November 15, Home Depot (NYSE:HD) reported a -4.3% decline in its transaction volumes during the third quarter and a -5.1% transaction volume decline year to date. Home Depot’s volume declines are in line with those of UPS (NYSE:UPS), which is discussed in the “FedEx and the recession report” mentioned above.
Interestingly, on November 15, Walmart (NYSE:WMT) reported better-than-expected third quarter results. Walmart’s divergence is what one would expect in a recessionary environment as the company is a price leader and oriented toward consumer staples products. In other words, Walmart is a classic recession stock and has been viewed as such for much of my career.
The recessionary conditions are a feature of the ongoing phase change, whether officially declared a recession or not. In other words, economic conditions are a symptom of the current transition period rather than representing the fundamental shift itself. As with all economic phase changes, uncertainty is a defining feature.
I hinted at the current phase change in regard to the technology sector specifically in the report “IBM is a technology leader for the next cycle.” From the report:
This is an ideal setup as the vast majority of investors are still focused on the winners of the last technology cycle, such as Amazon, Google, and Microsoft. The surprise potential embedded in IBM’s share price is decidedly to the upside while consensus growth estimates offer a low hurdle rate.
Fundamental changes are rippling across all economic sectors.
Top Stocks
In respect to Bezos’ advice on taking some risk off the table, from a portfolio perspective, high-quality companies that offer high income today with visibility into longer-term growth are especially attractive. The following table displays five top income and growth stocks for the current period of uncertainty. Please note that the Dividend 23* column and EPS 23* column represent consensus estimates for the next full fiscal year for each company. The data was compiled from Seeking Alpha.
Please note that I have highlighted in blue the average expected dividend and earnings yield for the above basket. A portfolio equally weighted between these five stocks offers attractive features in today’s environment. With an expected dividend yield of 4.7%, the group is competitive with bond market returns as the 10-year Treasury bond yields only 3.8% today.
Turning to earnings, the group has an expected earnings yield of 8.66% or a PE of 11.5. Given a historical equity market PE in the mid-teens, the group offers a large valuation margin of safety within an environment of still elevated valuations in respect to historic norms. A normalization of valuations is a defining feature of the current phase change in the markets.
While five stocks do not make a diversified portfolio, the above group is attractive from the perspective of a broad range of investor objectives. I will briefly update the positive risk/reward rating for each company with references to prior foundational reports. Please note that IBM was updated last week so I will not cover it here.
Eastman Chemical
The positive risk/reward rating for Eastman Chemical Company (NYSE:EMN) remains supported by the likelihood of it surpassing consensus earnings estimates through mid-decade, its deeply discounted valuation, and its well-above-average income growth potential. Additionally, the high quality of Eastman’s business may be undervalued by the market which opens the door to further multiple expansion potential.
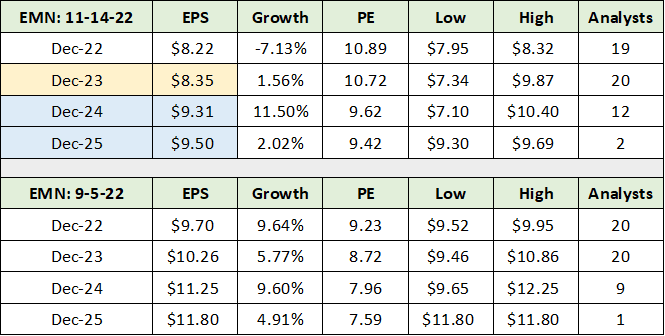
This is an update to the September 6, 2022 report, “Eastman Chemical is entering a bull market,” which offers foundational information for which the above summary remains unchanged. The following table displays consensus earnings estimates as of today (upper section) and compares them to those as of the September 6 report (lower section). In each case, consensus estimates were compiled from Seeking Alpha.
I have highlighted in yellow the consensus estimate that I view as being at risk of disappointment and in blue those estimates which are likely too conservative. The following quote is from the September 15 report, “The recession is here filter the noise.” It followed an earnings warning by Eastman Chemical just after my September 6 Eastman report.
Eastman was trading at 9x the 2022 consensus earnings estimate, which is roughly half the market-wide multiple. Clearly investors were anticipating Eastman missing the consensus estimate for 2022, which I infer from Eastman’s trading history near a mid-teen earnings multiple.
With Eastman trading near $82 at the time of the above quote, I estimated that the market was pricing in roughly $5.12 per share of low or trough annual earnings in the 2022 to 2023 timeframe. This was based on a 16x PE multiple and inferring what is likely to be priced in on the earnings front. The company’s average PE in recent times is near 18x. The estimate for 2023, highlighted in yellow above, remains well above the $5.12 trough estimate at $8.35 per share.
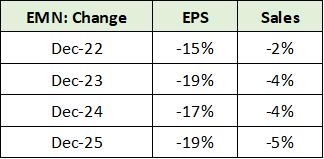
What is most interesting is that consensus earnings estimates were reduced for each year through 2025, following Eastman’s recent profit warning. The next table displays the percentage reduction in the consensus earnings estimates for each year and includes the change in sales estimates since my September 6 Eastman report.
Notice that consensus earnings estimates were reduced uniformly through 2025, as were sales. With Eastman entering recessionary conditions last quarter, the above changes to estimates in the 2024 to 2025 timeframe appear too pessimistic. Furthermore, estimates for 2023 may be at risk depending on the depth of the current downturn.
Regardless, Eastman’s current valuation appears to account for a material downside surprise to the current 2022/2023 consensus earnings estimates in the low $8 per share range. The lowest estimate is in the low $7 per share range.
Technicals: Eastman
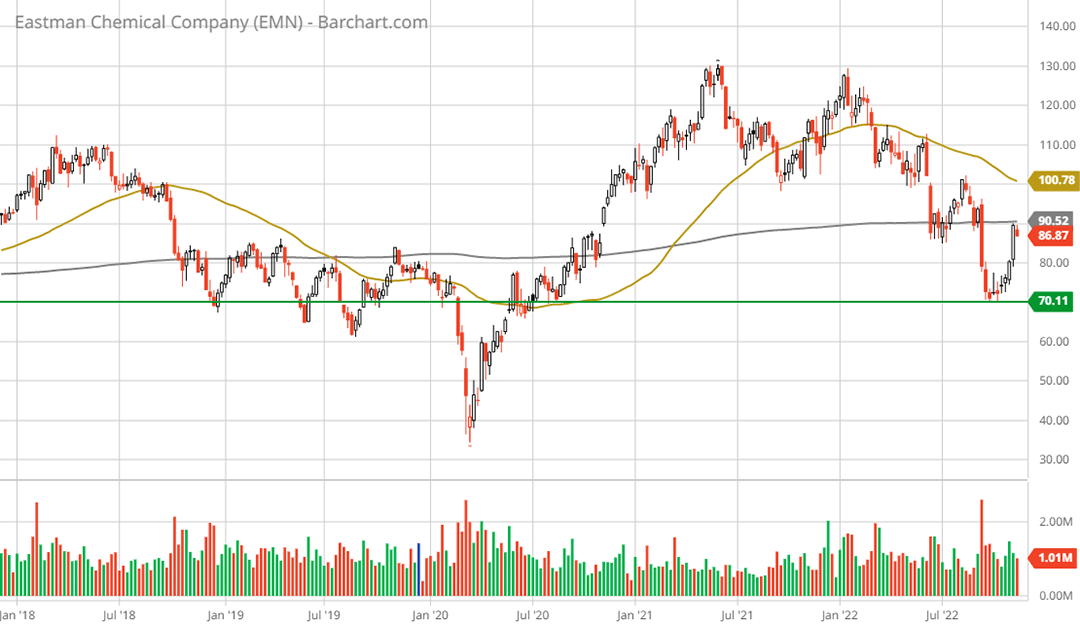
The downside valuation support provided by Eastman’s fundamentals, or earnings power, is reflected in Eastman’s technical backdrop. On the following 5-year weekly chart I have highlighted a key long-term support level with the green horizontal line. The $70 level was identified as a lower downside target in the September 6 report.
Notice that Eastman recently reversed higher at the key support level. The area between $70 to $80 should continue to serve as incredibly strong long-term support for Eastman’s shares. Keeping in mind that market dislocations, such as the COVID collapse, do happen. While painful, they offer little information value.
With the downside well supported both fundamentally and technically, the risk/reward asymmetry is decidedly to the upside. Turning to the upside potential, my estimate from the September 6 report remains unchanged. From the report:
Applying a 16x multiple to the consensus earnings estimates for Eastman into mid-decade results in a price target range of $150 to $190.
While consensus estimates into mid-decade have since come down by a high-teens percentage amount, I view the estimates as of the September 6 report to remain achievable in the 2024 to 2025 timeframe. The return potential to this range is 73% to 119%, excluding the dividend which is projected to reach 3.69% next year at the current price.
Rio Tinto
Like Eastman Chemical, Rio Tinto (NYSE:RIO) offers exceptional risk/reward asymmetry. This update builds off of my prior two Rio Tinto reports, “Rio Tinto is a perfect portfolio diversifier” and “Rio Tinto Is an asymmetric global growth opportunity,” which were published this year on June 3 and January 18, respectively.
Rio operates arguably the highest quality iron ore business in the world. Steel underpins the global economy and the energy transition. The company’s aluminum business is a global leader in terms of profitability. Trends here are positive as the aluminum industry is benefiting from structural supply shifts in China and the need for light-weight products for energy efficiency purposes. Finally, Rio Tinto offers one of the highest copper growth profiles in the materials sector. Copper is the largest commodity beneficiary of the energy transition, and electrification generally.
The energy transition, or decarbonization, is metals intensive. I covered projections for incremental metal demand resulting from the energy transition in “Rio Tinto is an asymmetric global growth opportunity.” The following is a paraphrase from the report and summarizes the growth opportunity for Rio Tinto.
Steel is slated to comprise 23% of the incremental metal value created by decarbonization plans and is estimated to be valued at $110 billion annually. Rio Tinto’s second and third largest business lines are aluminum and copper which account for 14% and 28% of the estimated incremental value creation from decarbonization demand. The average annual incremental aluminum and copper value opportunity is forecasted to be $67 billion and $133 billion, respectively. The total additional demand from the energy transition is estimated to be $310 billion per year which is in addition to base demand.
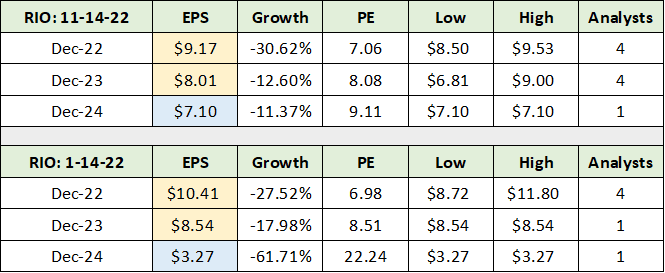
Rio Tinto’s improving prospects looking out to the mid-decade timeframe are beginning to show in consensus earnings estimates. The following table displays consensus earnings estimates for Rio Tinto as of November 14 (upper section) compared to my January report (lower section). I have highlighted in yellow the reductions to consensus earnings estimates and in blue the increase.
While the reductions since the January report are largely immaterial for a commodity producer, the increase in the 2024 estimate is notable, keeping in mind that it is one estimate. At the time of the January report, using $85 as an average iron ore price looking forward, I estimated that Rio’s iron ore business alone accounted for $74 per share of value. Iron ore accounts for three quarters of Rio’s profitability.
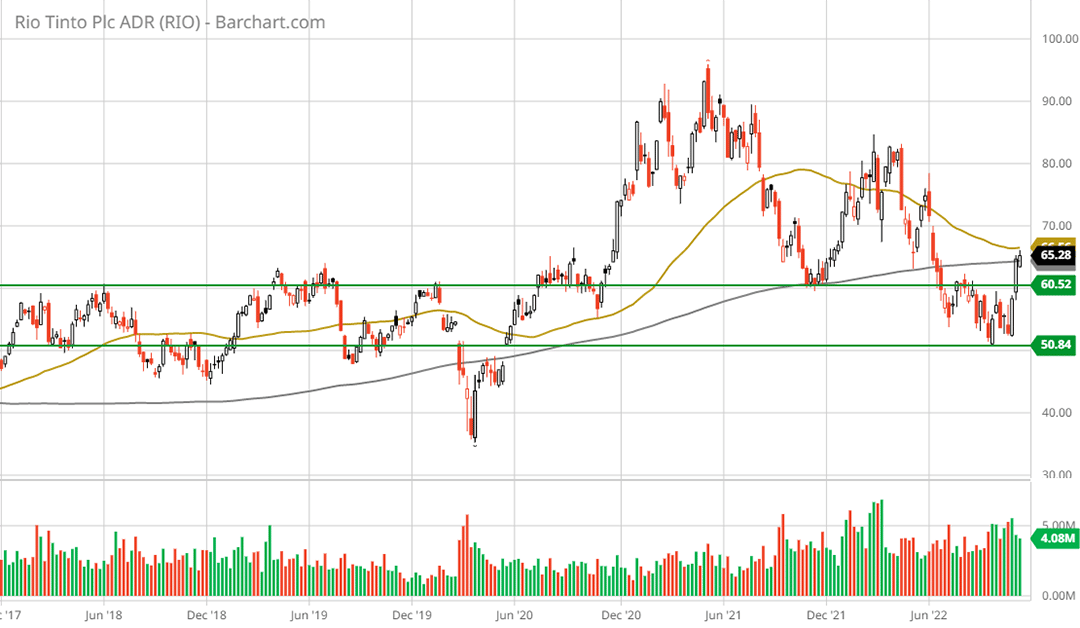
Today, iron ore is trading at roughly $92 per ton while Rio is trading near $65 per share. The material increase in the earnings estimate for 2024 may reflect the growing likelihood of a stable commodity pricing environment into mid-decade. If metals prices enter even a modest bull market trend as a result of the energy transition, the upside surprise potential for Rio into mid-decade is exceptional. Trading at a high single-digit PE ratio with an expected dividend yield near 8%, Rio Tinto is fundamentally well supported on the downside.
Technicals: Rio Tinto
Rio Tinto’s technical backdrop mirrors the fundamental setup. The technical picture can be summarized as strong nearby support with unbounded upside potential. On the following 5-year weekly chart I have highlighted the key long-term support zone with two horizontal green lines. Rio recently tested the lower end of the zone near $50 per share and found strong support.
The bounce at key support affirms the strong fundamental and technical support between $50 and $60 per share. I would expect this to remain the case given the deeply discounted valuation and positive outlook for metals.
The fundamental upside potential remains largely unchanged since my January report. My estimated upside target at the time was a range of $122 to $171 over the intermediate term. This represents upside return potential of 88% to 163%, respectively. The estimated 8% annual dividend is not included in these upside estimates and is material in its own right. The risk/reward asymmetry remains decidedly positive for Rio Tinto.
Pfizer
Similar to Eastman and Rio Tinto, the Pfizer (NYSE:PFE) investment case is defined by strong fundamental and technical support combined with unbounded upside. From a fundamental perspective, Pfizer has been a top performer in recent years due to its COVID vaccine success.
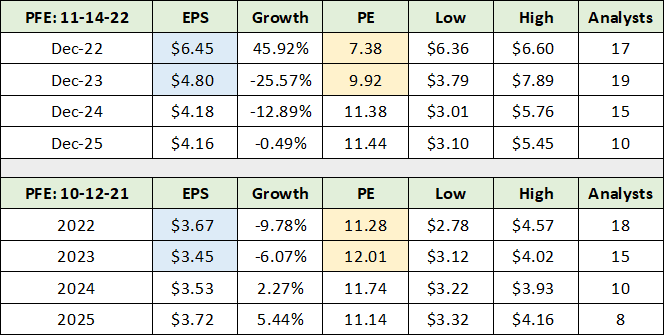
The following table highlights the upside surprise delivered by Pfizer since my October 17, 2021 report “Pfizer is an asymmetric growth opportunity.” The upper portion of the table displays current consensus earnings estimates and the lower section displays consensus estimates as of the October 2021 Pfizer report. Consensus estimates were compiled from Seeking Alpha.
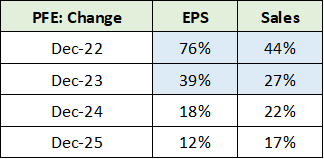
I have highlighted in blue the change in estimates for 2022 and 2023 over the past year. The yellow highlighted cells display the associated valuation change in response to the material increase in consensus earnings estimates. Since October 2021, Pfizer’s valuation multiple on earnings has contracted by 35%. The following table summarizes the upward revisions to consensus earnings and sales estimates since October 2021.
The blue highlighted cells summarize the increase in estimates through 2023 for both sales and earnings since October 2021. Interestingly, estimates have been revised upward materially through mid-decade. This fact captures the essence of the Pfizer investment case. From the October 2021 report:
Pfizer is best viewed as a biotech growth opportunity fund operating with a substantial capital base, existing infrastructure at scale, and rapidly growing free cash flow for reinvestment and shareholder distributions. The primary focus in monitoring Pfizer’s future success will be placed on the capital allocation and investment choices made with its substantial financial resources.
Following its record performance in 2021 and 2022, with free cash flow reaching $30 billion in 2021 alone, Pfizer has embarked on a historic growth investment cycle. The growth investments were covered in my April 4, 2022 report “Pfizer and how it could double.”
The increase in consensus estimates in the mid-decade timeframe may reflect Pfizer’s structurally improved growth profile. Trading at under 10x next year’s earnings estimate with an expected dividend yield of 3.46%, Pfizer offers a large margin of safety, fundamentally speaking.
Technicals: Pfizer
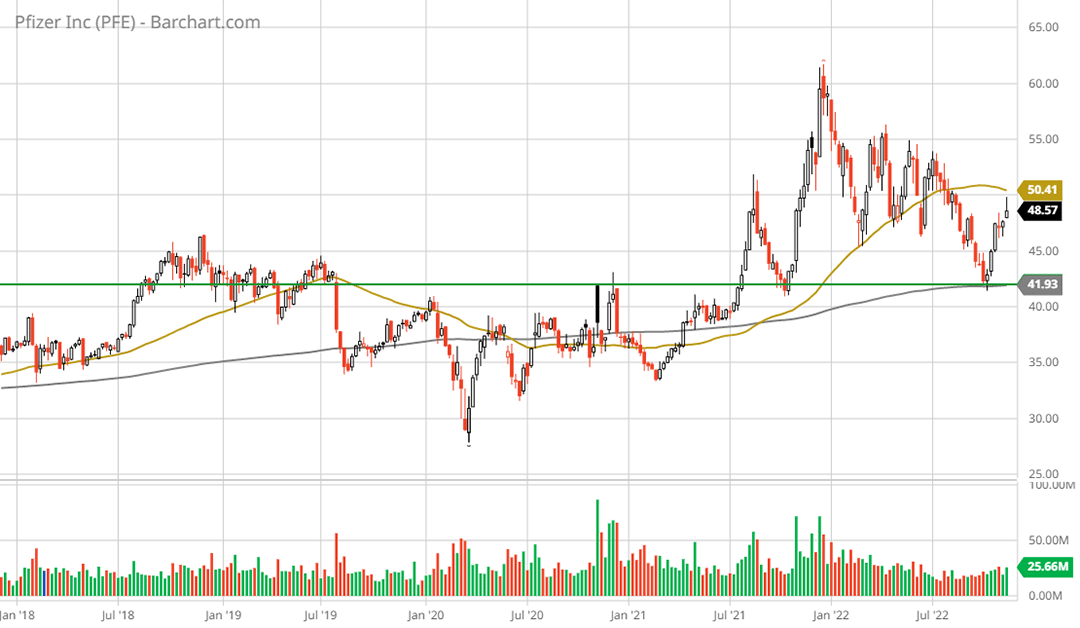
The downside valuation support provided by Pfizer’s fundamentals is reflected in the technical backdrop, as is the case for each of the five top income and growth stocks. The following 5-year weekly chart visually captures the strong downside support for Pfizer’s shares. I have identified the key long-term support level with the green horizontal line.
Notice that Pfizer recently tested the primary support level and reversed to the upside. The strong fundamental support near the current share price adds credence to the strength of nearby technical support. I would expect the low $40’s to remain rock solid support for Pfizer.
Turning to the upside potential, it remains largely unchanged since my prior Pfizer reports. In the April report, I estimated the upside potential using a PE multiple on 2024 earnings of between 15x, 20x, and 25x earnings. I selected this range as Pfizer’s growth profile and business model support an average to above-average valuation multiple.
Applying 15x and 20x to the current 2024 consensus estimate suggests upside potential of 29% to 72% over the intermediate term, excluding the dividend. The risk/reward asymmetry remains decidedly positive for Pfizer. If the company achieves success with its growth investment strategy, there is further upside potential.
Barrick Gold
Turning to Barrick Gold (NYSE:GOLD), I covered the fundamental investment case for gold and the gold miners in my October 14, 2022 report, “Gold is on the efficient frontier.” The report covers the relative attractiveness of gold miners in today’s environment from a portfolio management perspective. For foundational background on Barrick, please see my October 19, 2021 report “Barrick Gold is on the efficient frontier.”
As the fundamentals are thoroughly covered in the above reports, I will focus on the technical backdrop for Barrick Gold after noting consensus estimates, which are displayed in the table below. The data was compiled from Seeking Alpha.
Notice that Barrick’s earnings are projected to decline substantially in 2022 and 2023 before rebounding into mid-decade. This is due to the inflationary spike in Barrick’s cost structure at a time when metals commodity prices are correcting lower. Barrick’s earnings power is split roughly 75% gold and 25% copper.
Looking out to the mid-decade time frame, copper offers excellent growth potential resulting from the energy transition. The outlook for gold is generally favorable based on the increasing cost of production and its low weighting in institutional investment portfolios. The decade-plus sideways consolidation in both metals suggest a strong price foundation is in place.
Technicals: Barrick Gold
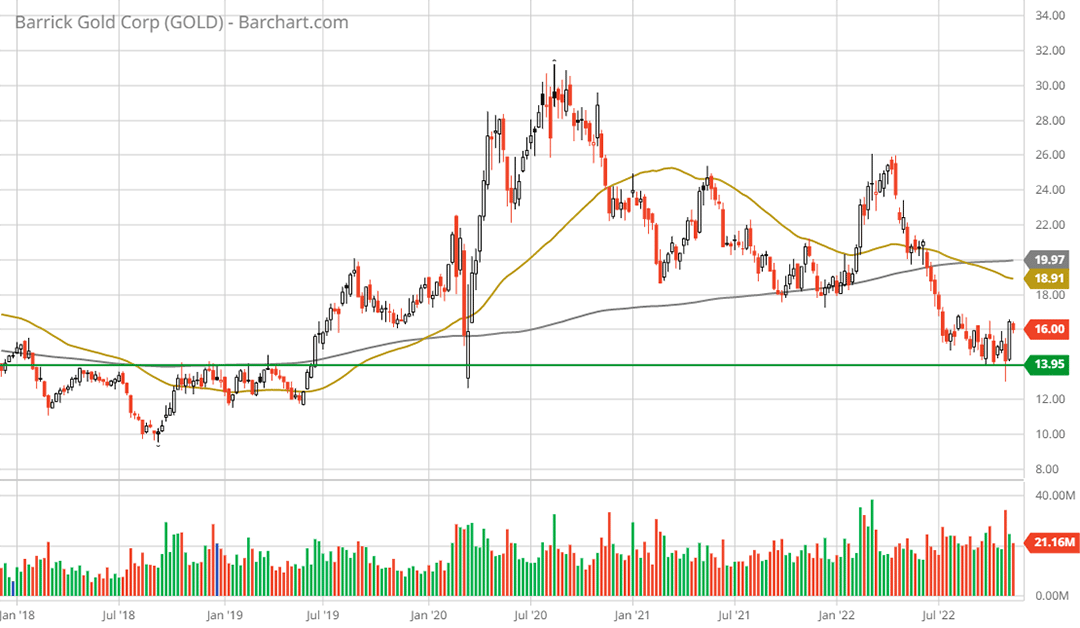
The near-term earnings decline embedded in consensus estimates above has been priced into Barrick’s share price as can be seen on the following 5-year weekly chart. Barrick has lost half of its value since peaking in August 2020 and is now back to a multi-decade support level which is denoted by the green horizontal line.
Like the other stocks in this income and growth basket, Barrick recently bounced off its major long-term support level. Barrick’s correction is now into year three. It should be noted that gold was trading at $1,300 per ounce when Barrick traded near $14 in 2018. Gold is trading near $1,775 today suggesting that the downside for Barrick’s shares may be near an exhaustion point.
The relative stability of gold in relation to Barrick’s share price hints at upside asymmetry in the shares of Barrick, as a blue-chip gold miner. I concluded the recent gold report, “Gold is on the efficient frontier,” with the following:
My base case for gold is a moderate bull market trend over the intermediate term… leaving the upside return asymmetry in the gold miners… Gold miners can offer a uniquely asymmetric risk/reward opportunity. They offer high beta exposure to an uncorrelated asset class.
I have tempered my expectations for Barrick’s earnings power over the intermediate term, since the December 2021 report. The higher upside potential discussed in the report is unlikely, barring an explosive gold and copper price rally. That being said, a return to all-time highs appears to be reasonable given current conditions and the outlook. This represents upside potential of roughly 100%, excluding the expected 3.54% dividend yield, and is within the more moderate commodity price assumptions covered in the December Barrick report.
Summary
In times of heightened uncertainty, longer-term visibility should receive a premium. Each of the five companies covered here is highly likely to be prospering in its respective industry into the mid-decade time frame. Their discounted valuations and high current income offer real-world fundamental support on the downside, which is fully reflected in each company’s technical backdrop. The risk/reward asymmetry is decidedly to the upside for the group.


