I am assigning Teladoc Health, Inc. (NYSE:TDOC) a negative risk/reward rating based on the weak cash flow generation of its business model, signs of slowing demand, an elevated valuation, and the heightened execution risk of its acquisition strategy.
That said, the company deserves to be on the watchlist of all growth investors as Teladoc seeks to become the proverbial front door to the healthcare industry for consumers and organizations. If it is successful, Teladoc would position itself as the leading global healthcare delivery platform. The company would then be in an extraordinarily valuable position as consumers, organizations, and governments seek to expand access while reducing healthcare costs. The ability to leverage technological advancements to enable greater use cases would then greatly expand the company’s value proposition.
In this article, I walk through Teladoc’s financial performance to date to understand its strengths and weaknesses with the goal of creating an investment framework for the shares.
Risk/Reward Rating: Negative
Teladoc reported Q2 2021 earnings on July 27, 2021, sending the shares down 12% the following day before recovering. The stock has proceeded to selloff 17% since the close on July, 28 2021 as investors question the sustainability of the company’s business model.
Teladoc is on a quest to become the category-defining provider of whole-person virtual care in the US and internationally. To fulfill its mission, the company has been rolling up industry players under its umbrella by conducting a regular and aggressive acquisition strategy. This approach plays into the company’s first mover advantage and brand strength. However, the strategy also creates heightened execution risk.
The execution risk revolves around the cohesive integration of each acquisition into the Teladoc platform in a profitable manner. In fact, given the 17% decline since the Q2 earnings report, the sustainable profitability of the business model remains an open question. I will begin with a look at Teladoc’s financial performance to address this overriding concern.
Profitability: Cash Flow
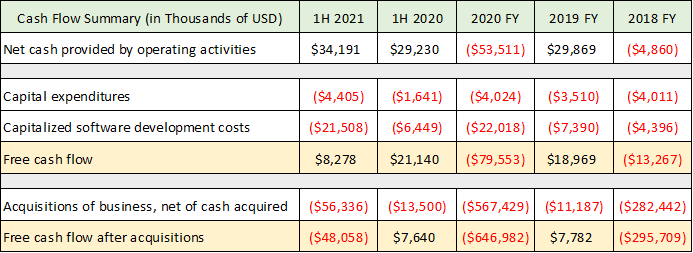
One of the defining features of the Teladoc business model to date is the dispersion across its profitability measures. This dispersion creates challenges in valuing the company and is a red flag for prospective investors as it clouds the underlying economics of the Teladoc business. When profitability measures vary widely, I prefer to begin with the cash flow statement as it removes accounting adjustments and forms a foundation for proceeding with an analysis. The following table was compiled from the company’s Q2 2021 10-Q and 2020 10-K reports filed with the SEC (1H = first half, FY = full year).
Source: Created by Brian Kapp, stoxdox
Looking at the first row, combining the three full years of cash flow from operations (2018 through 2020), Teladoc has generated -$28.5 million of negative cash flow cumulatively. Through the first half of 2021, cash flow from operations is up $5 million or 17% compared to the first half of 2020. While the percentage growth is in the right direction, the absolute increase of $5 million is not material for a company valued at $20.3 billion. Additionally, cash flow could turn negative in the second half of the year as was the case in the second half of 2020. The company did not provide cash flow guidance for the full year of 2021.
Turning to free cash flow after capital expenditures (first yellow highlighted row), the results weakened substantially in 2020 coming in at -$80 million. The first half of 2021 is trailing the first half of 2020 materially. The primary cause of the deteriorating free cash flow position is capitalized software development costs. It should be noted that capitalizing software development costs rather than expensing them has been a red flag in prior market cycles.
The most important and material investment that Teladoc consistently makes is the acquisition of other companies (final row highlighted in yellow). Acquisitions are core to the Teladoc business model and are its primary form of growth capital expenditures. Free cash flow after subtracting acquisitions is deeply negative coming in at just under -$1 billion for the three and a half years through the first half of 2021. While this is not alarming in its own right, if the acquisitions do not lead to increased cash flow from operations (first row in the table), it may signal that the business model is not self-funding and therefore unsustainable.
EBITDA and Adjusted EBITDA
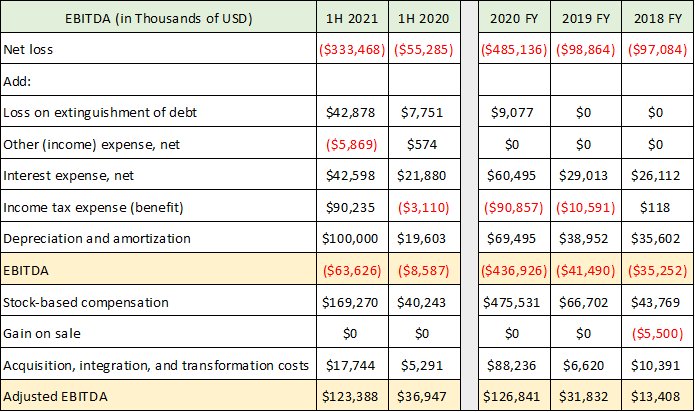
While the cash flow statement points to Teladoc operating at a cash flow and free cash flow loss the past three and a half years, the company’s preferred measure of profitability tells a different tale. Teladoc’s preferred profitability metric for which it provides guidance is adjusted EBITDA (earnings before interest taxes depreciation and amortization). The following table was compiled from the same two SEC documents used above.
Source: Created by Brian Kapp, stoxdox
The EBITDA performance (first highlighted row) tells a similar operating loss story as the cash flow statement. 2020 is a negative outlier due to stock-based compensation tied to a large acquisition (Livongo). The massive spike in stock-based compensation as a result of the Livongo acquisition has continued through the first half of 2021.
Excluding the stock-based compensation effect, cumulative EBITDA for the three full years through 2020 came in at -$38 million. This is remarkably similar to the -$28.5 million of cash flow from operations over the same period, lending credence to this operating loss range.
The dispersion in profitability figures begins to take shape with the company’s adjusted EBITDA calculation (final yellow shaded row). For this measure Teladoc adds back stock-based compensation expenses and costs associated with the integration of acquisitions and technology transformation expenditures. On this basis the company is showing an impressive 846% growth in its profitability from 2018 through 2020, with the first half of 2021 equaling the full year figure in 2020. In fact, Teladoc is forecasting 117% growth in adjusted EBITDA for the full year of 2021 to $275 million.
Given the upside dispersion in adjusted EBITDA compared to EBITDA, cash flow, and free cash flow from operations, this profitability figure should be used cautiously. The removal of stock-based compensation expense is questionable as the company itself states in its Q2 2021 10-Q SEC filing: “Adjusted EBITDA does not reflect the significant non-cash stock compensation expense which should be viewed as a component of recurring operating costs.”
Additionally, adding back acquisition integration and technology transformation costs to measure profitability is also questionable as recurring acquisitions are at the core of Teladoc’s growth strategy. Here is how Teladoc describes these expenses in its SEC filings:
These transformation cost adjustments made to our results do not represent normal, recurring, operating expenses necessary to operate the business but rather, incremental costs incurred in connection with our acquisition and integration activities.
Based on the business model and demonstrated history of acquisitions, I strongly disagree with this characterization.
Income Statement
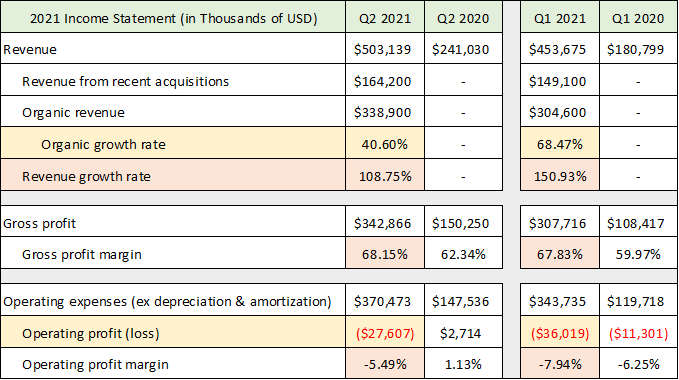
As can be seen in the first row of the EBITDA table, the company reports significant GAAP (generally accepted accounting principles) operating losses (first row). This measure of profitability highlights the dispersion once again as the numbers are materially worse than cash flow from operations, EBITDA, and adjusted EBITDA. Given the large accounting distortions introduced by the acquisition-heavy business model, I make several adjustments to the income statement from the Q2 10-Q filed with the SEC in the following table.
Source: Created by Brian Kapp, stoxdox
Focusing on profitability, the second yellow highlighted row reflects the operating loss excluding depreciation and amortization expenses (which are non-cash charges primarily related to acquisitions). On this adjusted operating income measure, the company has produced a loss of -$63.6 million through the first half of 2021 compared to -$8.6 million in the first half of 2020. This loss estimate is in line with the EBITDA figure through the first half of 2021 in the previous table lending credence to this measure of profitability.
Given the acquisition strategy and lack of cash flow growth, it is important to take note of Teladoc’s organic revenue growth rate excluding acquisitions to discern whether the company can generate sustainable internal growth (first yellow highlighted row). Organic revenue growth of 41% in Q2 2021 is excellent and well above the growth rate of the healthcare industry. However, this is a rapid slowdown from the 68% growth posted in Q1 2021.
On the profitability front, the business model is demonstrating healthy gross margin growth (second orange highlighted row). This is to be expected given the technology platform nature of the Teladoc business model. What is not expected from a platform business model is the lack of operating leverage on the bottom line. The operating profit margin improved slightly from -7.94% in Q1 2021 to -5.49% in Q2 2021. The jury remains out on whether Teladoc can gain control of its operating expenses and create profitability leverage in its business model.
Revenue Mix
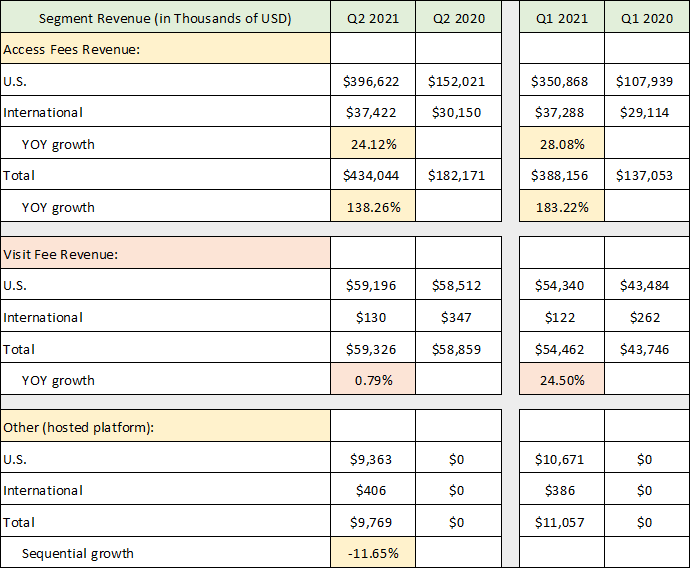
The company is experiencing material shifts in its revenue mix which may add some color to the dispersion in measures of profitability. The following table was compiled from the Q2 10-Q filed with the SEC and breaks out Teladoc’s revenue across its reporting segments through the first half of 2020 and 2021 (YOY = year-over-year).
Source: Created by Brian Kapp, stoxdox
A material slowdown is occurring in the visit fee revenue category (orange highlighted rows) which came in flat in Q2 2021 compared to Q2 2020. The company has 22 million visit fee-only members which is unchanged from last year. The flat revenue in Q2 2021 occurred against the backdrop of visits increasing by 28% year-over-year in Q2 2021. This is worrisome and suggests there may be significant pricing pressure in this revenue channel.
There is plenty of competition for facilitating virtual healthcare sessions from the likes of Microsoft and Zoom, as well as in-house solutions to name a few. This trend will be important to monitor in the future as it speaks to the utilization of the Teladoc platform.
The stagnant visit fee revenue in Q2 2021 also points toward a return to normal, as COVID restrictions are lifted and people return to in-person visits for general medical, expert medical, and other specialty visits.
Access fees (first section highlighted in yellow) now dominate Teladoc’s revenue mix at 86%. The company has been successful in signing large customers. Teladoc now has relationships with many industry participants and providers, and it claims to work with half of the fortune 500 companies in some manner.
With 52 million paid members in Q2 2021 and access fee revenue of $434 million, Teladoc is generating $2.78 on average per member per month. Keep in mind that much of these per member fees are paid by large organizations covering large groups of people which will limit the amount that they are willing to pay per member. That being said, there should be upside pricing potential over time.
Finally, the hosted virtual healthcare platform fees (the last section in the above table) are a new revenue stream and could provide a higher margin opportunity for Teladoc. It is too early to draw conclusions here as the revenue stream is not yet material. It posted a sequential decline of 12% in Q2 2021 compared to Q1 2021 suggesting caution is in order.
Guidance
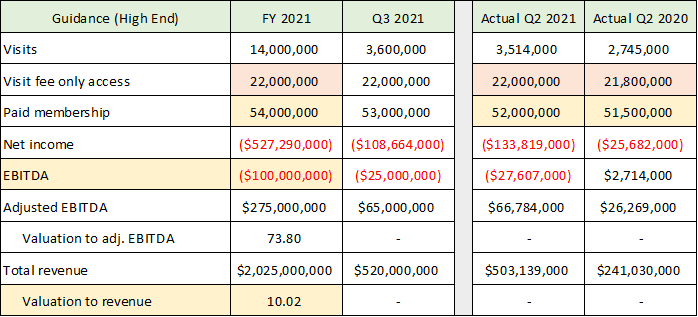
The company’s guidance for the remainder of 2021 will round out the fundamental review and transition to a look at Teladoc’s valuation. The following table was compiled from the Q2 2021 8-K earnings release and Q2 2021 10-Q filed with the SEC. It provides the high end of the company’s guidance for the remainder of 2021 with a comparison to Q2 2021 and Q2 2020 for context.
Source: Created by Brian Kapp, stoxdox
The dispersion of profitability measures is on full display in the company’s guidance, ranging from -$527 million of reported net income to $275 million of adjusted EBITDA. As discussed in the profitability sections, EBITDA is likely the closest measure of the underlying profitability of the business and is expected to come in at -$100 million for the full year in 2021.
The first two highlighted rows are member and customer forecasts and paint a slowdown picture. Visit fee access customers are expected to be unchanged over the eighteen months from Q2 2020 through year end 2021. Paid memberships are expected to show marginal growth of 5% over the same 18-month period. These trends are not indicative of hypergrowth. The growth slowdown is evident in the revenue forecast for 2021 (final row). It is even more visible in the following table compiled from the same SEC filings which depicts the sequential quarterly revenue growth that is expected.
Source: Created by Brian Kapp, stoxdox
I have highlighted the two most important cells. Teladoc has seasonality in its business with Q4 and Q1 being the strongest quarters of the year due to the annual healthcare enrollment industry cycle. The 11% sequential growth posted in Q2 2021 (a seasonally weaker quarter) is double the 5.4% sequential growth expected in Q4 2021 (a seasonally stronger quarter). Sequential quarterly growth near 5% suggests that the organic 40% year-over-year revenue growth rate posted in Q2 2021 may turn into a sub 25% annual growth rate entering 2022. This would align with the rapidly slowing member estimates.
While annual growth near 25% is excellent, it is a massive slowdown from 40% in Q2 2021 and 68% in Q1 2021. This also introduces acute valuation risk for Teladoc’s shares as the rapid slowdown that appears to be unfolding is occurring against a still elevated valuation multiple.
Valuation
As can be seen in the first Guidance table, Teladoc is trading at 10x estimated sales for 2021. This is extreme for a low margin company viewed from a historical market perspective. Given the operating income and cash flow losses, the company’s adjusted EBITDA estimate is the only positive profitability metric with which to work. In this respect, Teladoc is trading at 74x estimated adjusted EBITDA for 2021. This is extreme relative to current market valuations which range from 22x to 32x estimated 2021 earnings (S&P 500: 22x, Nasdaq 100: 29x, and Russell 2000: 32x).
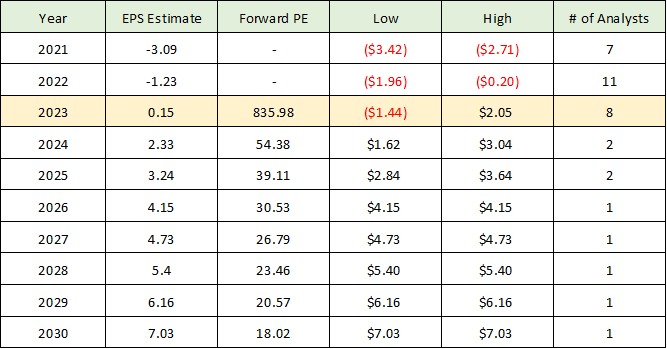
Turning to consensus earnings estimates, the following table was compiled from Seeking Alpha and displays consensus analyst earnings estimates and the forward price-to-earnings ratio each year.
Source: Seeking Alpha. Created by Brian Kapp, stoxdox
I have highlighted the most important row in yellow as that is the last year with more than a few analyst estimates. On 2023 earnings estimates, Teladoc is trading at an 836x forward PE. This is an extreme valuation historically and relative to current market valuations.
The extreme dispersion in profitability estimates discussed here is also evident in the wide range of earnings estimates each year in the above table (Low and High estimate columns). The dispersion of estimates is a red flag. It implies extraordinary uncertainty regarding Teladoc’s business model and points toward reduced earnings visibility.
Balance Sheet Risk
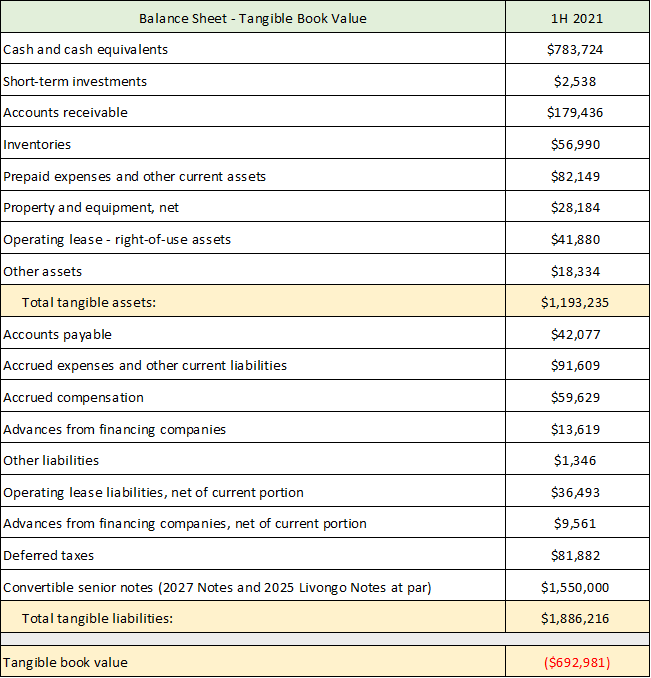
Given the negative free cash flow and heightened business model uncertainty, it is important to take note of the balance sheet risk facing Teladoc. The company has plenty of liquidity at the moment with $784 million of cash. The majority of its liabilities are in the form of medium-term debt that matures in 2025 and 2027. Given the company’s heavy reliance on acquisitions for growth, the balance sheet may begin to limit its opportunity set in this regard. The following table was compiled from the Q2 2021 10-Q filed with the SEC.
Source: Created by Brian Kapp, stoxdox
I have removed all intangible items from the balance sheet to get a glimpse of the tangible book value of Teladoc. This is a better reflection of the company’s financial position as $16.4 billion of its reported assets are intangible assets and goodwill (price paid for an acquisition minus its identifiable assets). With a negative tangible book value of -$693 million and negative free cash flow, the market may become less willing to supply Teladoc with additional capital for acquisitions if the company’s profitability does not begin to materially improve. This is a key risk to the Teladoc business model looking forward.
Technicals
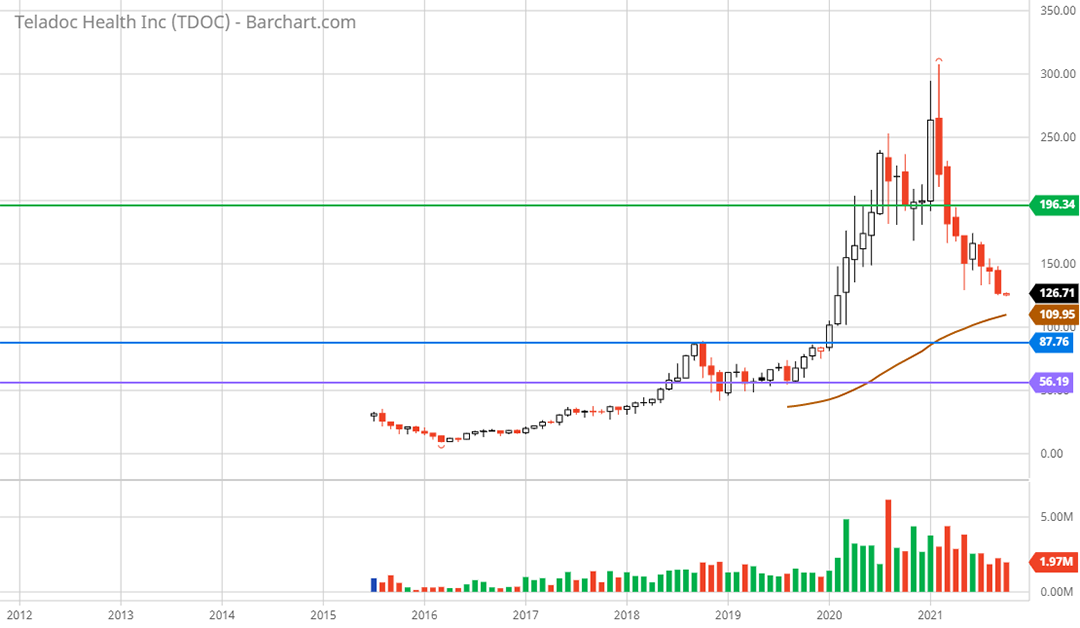
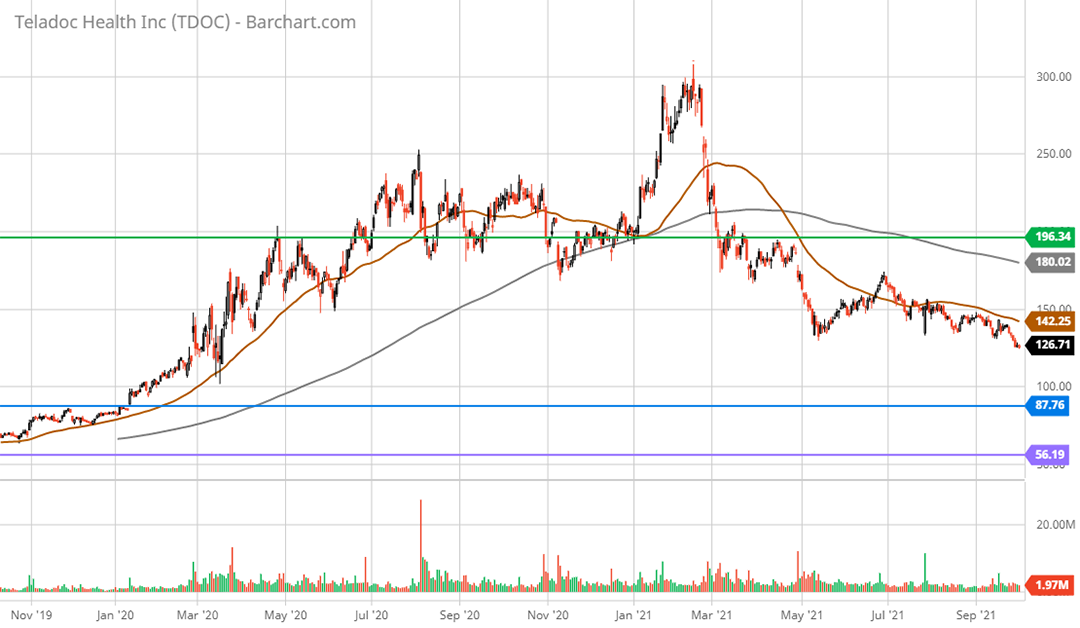
Teladoc stock came public in July of 2015 in the $30 range and was in a moderate uptrend for much of its trading history leading up to the global COVID outbreak in January 2020. The COVID pandemic was a perfect operating environment for Teladoc sending its shares from $80 to a peak of just over $300 in February of 2021 (coincident with the global vaccine rollout). The following 10-year monthly chart puts these events into context with three critical support and resistance zones highlighted by the horizontal lines.
The three support and resistance lines align well with the key weekly chart levels (not shown here) and are carried over to the following 2-year daily chart for a closer look.
Teladoc 2-year daily chart
Teladoc is in a well-defined downtrend which was confirmed by the death cross on April 20, 2021, when the 50-day moving average (brown line on the daily chart) crossed beneath the 200-day moving average (grey line on the daily chart). The stock recently broke to a new low for 2021 which opens the door to a test of the nearest long-term support area near $87 (blue line). This area served as resistance in 2018 and was the key breakout zone in January 2020. Based on the fundamentals and valuation discussed here, this looks to be a natural accumulation level for the shares.
The next lower support level is at $56 (purple line) which was the bottom throughout 2018 and 2019 and looks to be the floor for the share price. The zone between $56 and $87 should provide an attractive entry point for long-term growth-oriented investors. The first major resistance zone is near $196 (green line) which would offer an attractive upside price target.
Summary
The risks outweigh the rewards for Teladoc’s shares, even after a 58% decline from the peak in February 2021. The most pressing concern is the profitability of Teladoc’s business model, which is highly uncertain with little historic evidence of cash flow generation potential. Teladoc’s uncertain profitability is further complicated by the rapid organic growth slowdown that is unfolding. The slowdown risk is further amplified by Teladoc’s increasingly constrained acquisition potential as a result of its stretched balance sheet. Acquisitions have been a core growth driver of the business model setting up a period of great uncertainty heading into 2022.
On the bright side, the future of virtual healthcare delivery offers tremendous growth potential and Teladoc is a relative first mover and leader in the space. The company has relationships with many industry participants and providers and works with half of the fortune 500 companies in some manner. If Teladoc can stabilize its business model, the shares may offer an excellent long-term investment opportunity.
Price as of report date 10-4-21: $127
Teladoc Health Investor Relations Website: Teladoc Health Investor Relations


