I am assigning Square, Inc. (NYSE:SQ) a negative risk/reward rating based on its extreme valuation, the sustainability of its recent financial outperformance, and questionable capital allocation choices. Given the vast opportunity set provided by the fintech space, Square offers enticing growth potential once the above concerns are resolved. In this article I deconstruct Square’s performance though the first half of 2021 to uncover the underlying growth rate and profitability of the business model before turning to an investment strategy for the shares.
Risk/Reward Rating: Negative
Square pulled out all the stops in announcing its Q2 2021 earnings five days earlier than scheduled in a surprise Sunday press release on August 1, 2021. The surprise earnings release featured adjusted earnings that came in 89% above consensus estimates and was accompanied by a large acquisition announcement. The news sent the shares up 17% over the next several days peaking near $290 on August 5, 2021. Square has since reversed these gains and remains largely unchanged from levels preceding the Q2 2021 earnings report.
The most surprising aspect of the unscheduled earnings release was the company’s announcement that it was buying Afterpay (ASX: APT) for $28.2 billion in an all-stock deal. Square is valuing Afterpay at an extraordinary 31x fiscal year 2021 sales and 729x adjusted EBITDA (earnings before interest taxes depreciation and amortization). Afterpay provides buy now, pay later or BNPL services to merchants and consumers primarily in Australia and North America. The extremely high valuation paid for Afterpay raises a major red flag for the Square investment case.
The Afterpay acquisition follows in the footsteps of the eyebrow raising TIDAL acquisition in Q2 2021. In this instance, Square purchased what is essentially a music streaming service based on the premise that it will help fulfill Square’s mission of economic empowerment. The acquisition of TIDAL was a red flag as well in my opinion. The reasoning behind the acquisition could be applied to any company in any industry thereby opening the door for Square to become increasingly scattered and unfocused in its growth strategy.
Square has no clear competitive advantage in music or the music streaming business and there are no clear synergies with its existing products and services. Furthermore, TIDAL is not material to Square’s financial results as evidenced by Square not breaking out TIDAL’s performance in its Q2 2021 financial statements. The red flag in the case of TIDAL is further supported by Square mentioning TIDAL 23 times in its Q2 2021 10-Q risk factors while not warranting a breakout in Square’s financial statements. The acquisition thus appears to offer many new risks for Square without a clear pathway for reward.
The recent acquisition red flags combined with the surprise Sunday Q2 earnings report place Square’s recent financial outperformance in the spotlight.
Adjusted Revenue
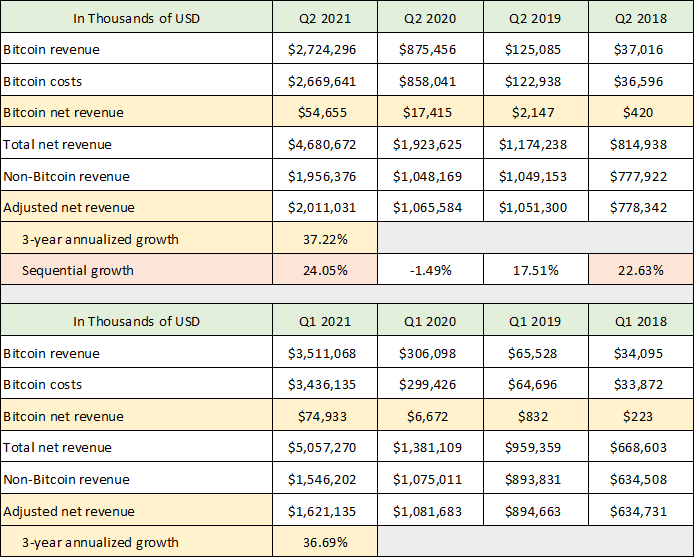
I will begin on the top line with Square’s revenue. The company reported incredible revenue growth of 195% through the first half of 2021 compared to 2020. Looking under the hood, the reported revenue growth should be taken with a grain of salt as it does not capture the economic reality of the Square business model. The following table was compiled from the company’s Q2 2021 10-Q and Q2 2019 10-Q filed with the SEC. The upper half of the table is Square’s revenue performance in Q2 over the past four years, and the lower half is the Q1 revenue performance over the same time.
Source: Created by Brian Kapp, stoxdox
In recent quarters Bitcoin has come to dominate Square’s reported revenue. Through the first half of 2021 Bitcoin sales comprised 64% of Square’s total reported revenue (Bitcoin revenue divided by total net revenue). Square sells Bitcoin to its customers as a middleman. Essentially, when customers buy Bitcoin through Square, the company buys Bitcoin and then resells it to its customers with a markup.
The economic reality of this arrangement is best captured by the net Bitcoin revenue to Square rather than the total amount of Bitcoin sold to its customers. Square’s net Bitcoin revenue is in the third row highlighted in yellow in both the Q2 and Q1 tables. I then add Bitcoin net revenue to non-Bitcoin revenue to arrive at an adjusted net revenue figure. The adjusted net revenue figure is a better reflection of the economic reality underlying Square’s business model than is the company’s reported total net revenue.
Due to COVID depressing business in Q1 and Q2 of 2020, it is best to view Square’s adjusted net revenue performance as an annualized figure over the past three years using 2018 as the base year. Square is growing its revenue at an impressive 37% per year through Q1 and Q2 2021 (the final yellow highlighted row in each table). The sequential growth in Q2 2021 compared to Q1 2021 is a very impressive 24% (orange highlighted row). The sequential growth should be viewed cautiously as the the full reopening of the economy in Q2 likely benefited Square substantially. For additional sequential growth context, Square posted 23% sequential growth in Q2 2018 compared to Q1 2018. This suggests that the Q2 2021 spike is within historical norms for the company when the reopening boost is added to the equation.
On the revenue front, Square is growing at an impressive 37% per year. However, this is a far cry from the reported revenue growth of 195% through the first half of 2021.
Segment Revenue and Gross Margin
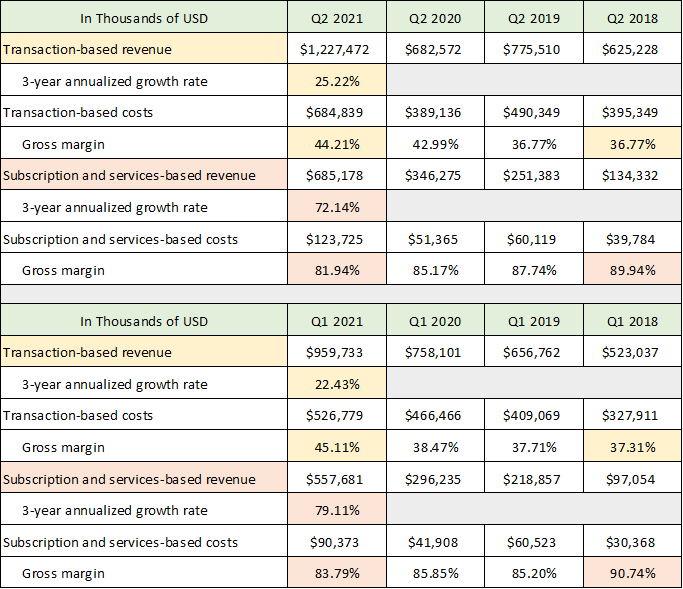
Square reports revenue in two primary segments (excluding Bitcoin and other): transaction-based revenue and subscription and services-based revenue. Viewing each revenue segment separately will shed light on the drivers behind Square’s 37% revenue growth. The following table was compiled from the two SEC filings used above. I have highlighted the pertinent information with yellow denoting transaction-based data and orange denoting subscription and services data.
Source: Created by Brian Kapp, stoxdox
While annualized transaction-based revenue growth of 25% is respectable, Square’s subscription and services-based revenue growth of 72% per year is impressive. Transaction gross margins are trending materially higher from 37% in Q2 2018 to 44% in Q2 2021. This trend is making a large contribution to overall dollar gross profit growth as transaction-based revenue is 79% greater than subscription and services-based revenue. It should be noted that the gross profit margin on transaction-based revenue is down 1% from Q1 2021, which bears watching for signs of a trend reversal.
Subscription and services gross profit margins are trending materially lower from 90% in Q2 2018 to 82% in Q2 2021. Additionally, the gross profit margin in this segment is down 2% from Q1 2021. The trend here should be bookmarked for reference in future quarterly reports. While not yet alarming, if this trend continues it could begin to crimp gross profit growth as subscription and services-based revenue begins to slow. Although it remains an extraordinary growth rate, the annualized growth rate of 72% in Q2 2021 slowed from 79% in Q1 2021.
The net gross profit margin effect of the above is positive. It should be noted that the Afterpay business generates gross margins in the 54% neighborhood (using Afterpay management’s EBITDA numbers) compared to Square’s first half 2021 adjusted gross margin in the 58% range.
Operating Margins
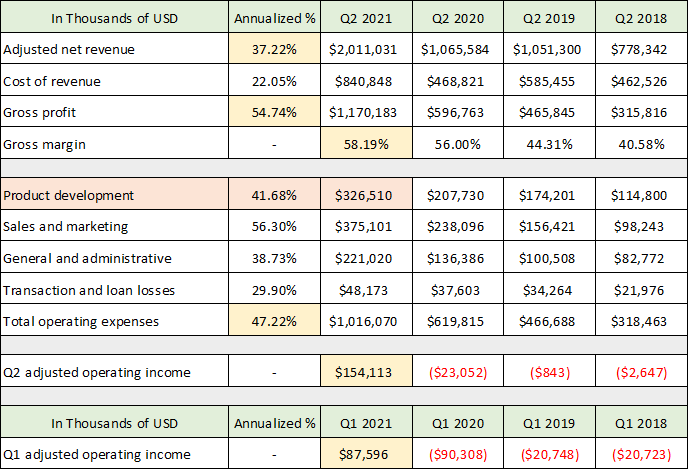
Gross profit growth has been impressive registering 55% annual growth since Q2 2018 (second yellow highlighted cell in the table below) and is running well ahead of the 37% revenue growth. The following table was compiled from the above-mentioned SEC filings and carries over the adjusted revenue from the first table. I calculate the total adjusted gross margin and begin to deconstruct Square’s operating profitability. The expense categories are as reported (not adjusted to remove expenses such as stock-based compensation).
Source: Created by Brian Kapp, stoxdox
Total operating expenses are growing well above revenue growth at 47%.This is being offset at the moment by the 55% gross profit growth. With revenue growth at 37% and initial signs of gross profit margins trending lower, Square’s 47% operating cost growth appears unsustainable.
I have highlighted product development expenses in orange as Square invests heavily here. The $327 million spent in Q2 2021 follows $310 million spent in Q1 2021 (not shown in the table). This raises a concern regarding the Afterpay purchase price of $28.2 billion. It hints at the possibility that Square’s product development expenditures are not being directed toward the highest return use cases in the market (such as BNPL). Square could easily have developed a buy now, pay later product offering inhouse for a fraction of the $28.2 billion it is paying for Afterpay. In this light, the Afterpay acquisition price may provide a window into Square’s inhouse view of its organic growth potential.
The final two data rows in the table are striking. The pertinent 2021 data is highlighted in yellow. Q2 and Q1 2021 are the first quarters in this data series to show positive operating income using reported operating expenses. On this basis, the combined operating income through the first half of 2021 is $282 million.
Adjusted Profitability
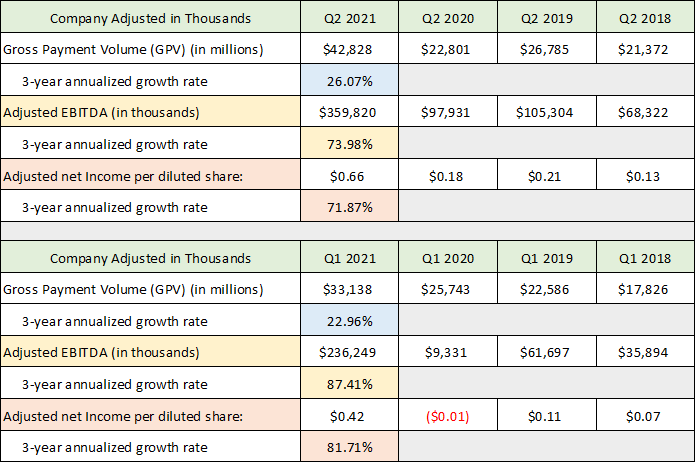
The striking nature of the historic losses begins to raise the question of Square’s underlying economic profitability. In this regard, Square provides adjusted EBITDA and adjusted net income as part of its Key Operating Metrics and Non-GAAP Financial Measures table which is shown below (compiled from the same two SEC filings used above).
Source: Created by Brian Kapp, stoxdox
Square is reporting impressive adjusted-profitability numbers which are highlighted in yellow (adjusted EBITDA) and orange (adjusted net income) for both Q2 (top table) and Q1 (bottom table). The annualized 3-year growth rates are incredible at 72% to 74% in Q2 2021. Recall that subscription and services revenue is also growing at 72%.
If these adjusted operating profit figures reflect Square’s underlying economics, they too speak to the question of why Square is paying $28.2 billion or 31x sales for a BNPL company. The answer may begin to be found in the Gross Payment Volume on Square’s network (the 3-year annualized growth rates are highlighted in blue). The volume going through Square’s network is growing in line with Square’s largest source of revenue, transaction-based revenue.
Recall that this revenue segment has been experiencing material gross margin improvement in recent years thereby offsetting the 47% growth rate in operational expenses. The concern here may be that there is tremendous competition in the payment processing business. Additionally, the payment processing competition is with more established and larger competitors such as PayPal (NASDAQ:PYPL), Mastercard (NYSE:MA), and Visa (NYSE:V).
Due to these competitive factors, the 25% transaction-based revenue growth may revert toward the growth rate of the underlying payments sector and general economy over the medium term. If so, this would begin to weigh heavily on Square’s overall growth being 79% larger than subscriptions and services-based revenue.
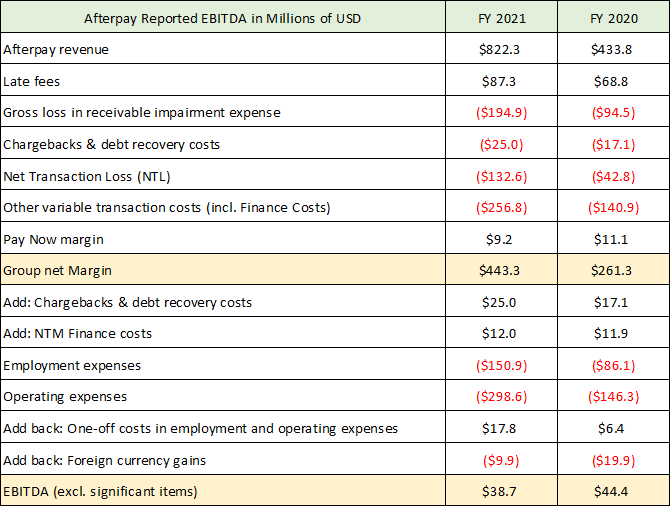
Another explanation for the extreme premium paid for Afterpay could be that Square’s adjusted EBITDA and net income figures overstate the underlying profitability of its business. For example, Square’s adjusted EBITDA tally for the first half of 2021 (1H) is $596 million or $1.2 billion annualized. While Afterpay reported EBITDA of $39 million for the recently completed full fiscal year of 2021.
Square is offering Afterpay shareholders 18% of the combined company while Afterpay is generating only 3% of the combined adjusted EBITDA. If the adjusted EBITDA figures reflect Square’s true economics, it would be offering quite the bargain to Afterpay shareholders. There is usually no such thing as a free lunch in economics. This strongly suggests that Square’s adjusted EBITDA and adjusted net income figures are not the best measure of the company’s underlying profitability.
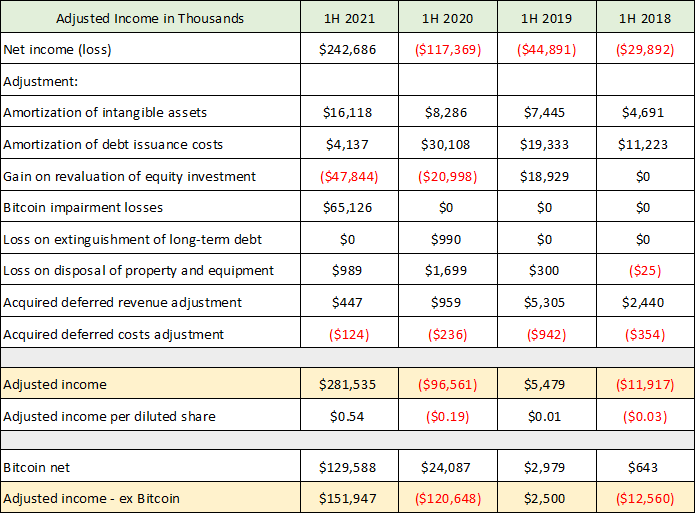
Square excludes large expenses from its adjusted profitability measures. In the following table, I remove three of Square’s adjustments to EBITDA and net income: stock-based compensation expense, acquisition related and other costs, and interest expense on the company’s senior convertible debt. The table was compiled from the SEC filings used previously and shows first half results for the past four years.
Source: Created by Brian Kapp, stoxdox
I have highlighted my adjusted income calculations in yellow. The $281 million adjusted income estimate in 1H 2021 matches the $282 million adjusted income estimate from the operating margin table discussed previously.
I have removed net Bitcoin revenue in the final row to highlight the effect of Bitcoin at 46% of my adjusted income calculation. I assume that the net Bitcoin revenue figure is also the net operating income from Bitcoin, as there should be no further expenses for this business. The Bitcoin revenue stream is highly volatile and may not be a reliable recurring business line for valuation purposes. Either way, it is informative to view Square’s profitability with and without the Bitcoin sales.
The Afterpay acquisition price becomes somewhat more defensible based on my adjusted income estimate above. By this profitability measure, Afterpay shareholders are getting 18% of the total company while contributing 6.5% of the combined adjusted income. While this makes the acquisition look more equitable, the Afterpay shareholders still appear to be receiving substantially more value from the transaction than Square shareholders.
The Afterpay valuation begins to make more sense if the adjusted income excluding Bitcoin is used as Square’s sustainable profitability run rate. In this case, Afterpay shareholders are getting 18% of the combined company while contributing 11% of the combined adjusted income.
Profitability Summary
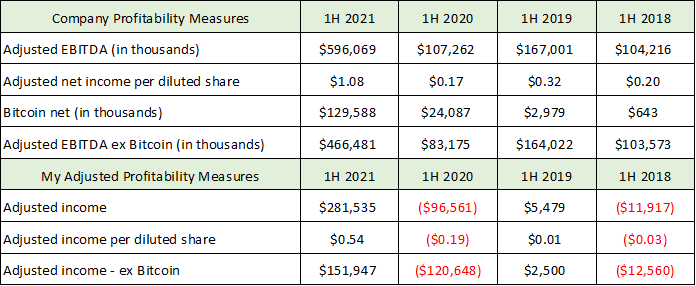
The following two tables summarize the profitability estimates discussed above and are provided for reference as they will be used in looking at Square’s valuation. The first table is compiled from the two SEC filings with which we have been working. The second table was compiled from Afterpay’s investor presentation provided to its shareholders to report fiscal 2021 results and to outline Square’s offer.
Source: Created by Brian Kapp, stoxdox
Valuation
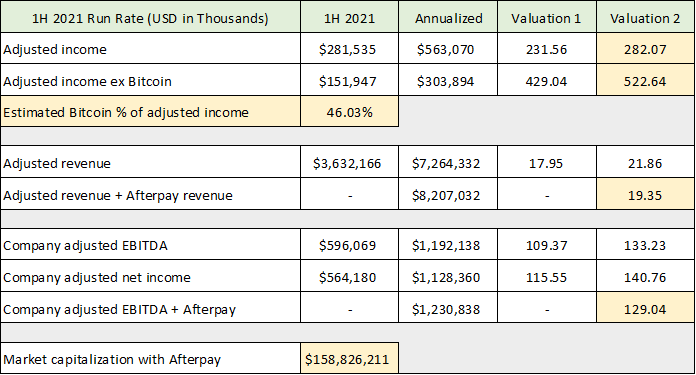
With the above estimates of Square’s underlying income generation and the Afterpay details, we can now turn to valuation. In the following table, I use the first half of 2021 actual results for Square and multiply them by two for a current annualized run rate. The addition of Afterpay to this annualized Square run rate uses Afterpay’s just completed full year 2021 results from its investor presentation. Valuation 1 is Square’s valuation using its current diluted share count. Valuation 2 is Square’s valuation using the diluted share count plus the shares used as payment for the Afterpay acquisition.
Source: Created by Brian Kapp, stoxdox
I have highlighted what I believe to be the most informative valuation metrics in the final column, using the estimated total diluted shares following the Afterpay acquisition. The valuation on revenue is extreme by historical market norms, coming in at 19.35x sales. On the profitability measures, the valuation ranges from 129x the run rate of the company’s adjusted EBITDA estimate to 282x my adjusted income run rate estimate. These are extreme compared to historic market norms and relative to current market averages which range from 21x to 33x forward 12-month earnings estimates (S&P 500: 21x, Nasdaq 100: 28x, and Russell 2000: 33x).
The current consensus earnings estimates for Square are provided in the following table from Seeking Alpha. Please note that the forward price-to-earnings ratio based on the 2021 consensus earnings estimate is identical to the valuation in the previous table annualizing Square’s 1H 2021 adjusted EBITDA figure. The consensus earnings estimates are for non-GAAP (generally accepted accounting principles) earnings and should be handled with care as discussed in detail above.
Source: Seeking Alpha. Created by Brian Kapp, stoxdox
I have highlighted the key data. The 129x 2021 adjusted net income estimate and 104x 2022 are extreme from both a historic and current relative perspective. While one can justify such valuation premiums for smaller, hypergrowth companies, they are extraordinary valuation premiums for a $159 billion company with revenue growth of 37% (which is likely to slow materially going forward).
Finally, it should be pointed out that 37 analysts have earnings estimates for Square into 2022 (orange highlighted cells). This represents very broad-based research coverage and suggests that Square is widely-owned in the investment community. As a result, there is the added risk of the shares lacking the necessary marginal demand to reignite upward momentum as the charts are beginning to suggest.
Technicals
Square is coming up on its 1-year anniversary of being confined to a sideways trading range. Given the current valuation extreme, the technical backdrop will be informative in terms of potential accumulation levels for the shares.
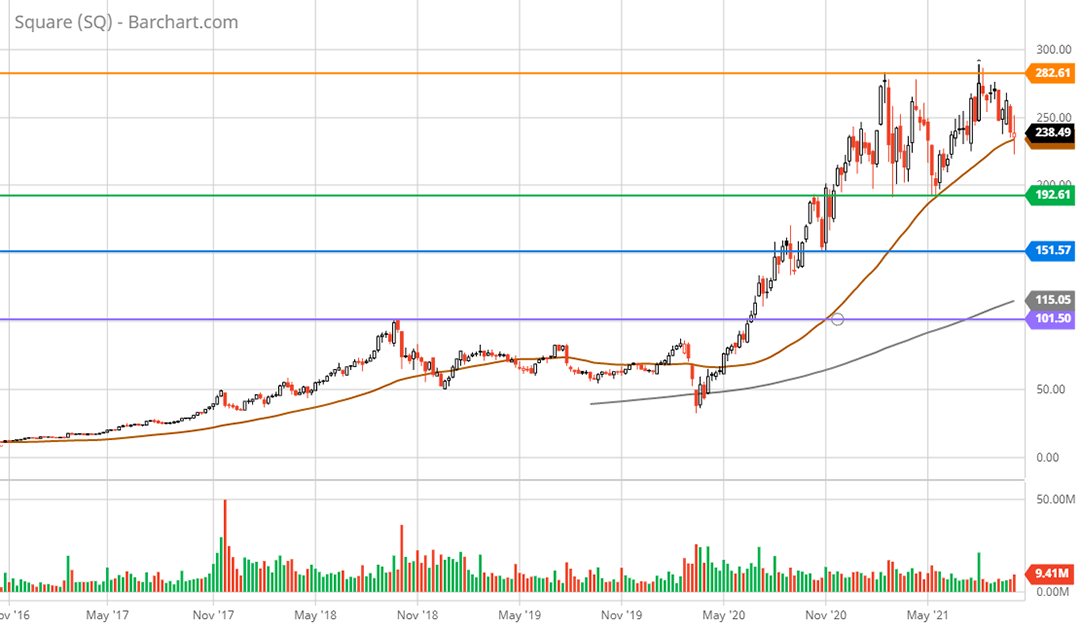
The 5-year weekly chart below will set the stage. There are four well-defined support and resistance levels highlighted by the horizontal lines.
Square 5-year weekly chart. Created by Brian Kapp using a chart from Barchart.com
Square staged an incredible rally from $50 at the COVID crash low to $283 at the peak of speculative market activity in mid-February 2021. The peak was retested following the Sunday surprise Q2 earnings announcement and the shares were rejected once again at this level (orange line). This is likely to serve as stiff resistance going forward.
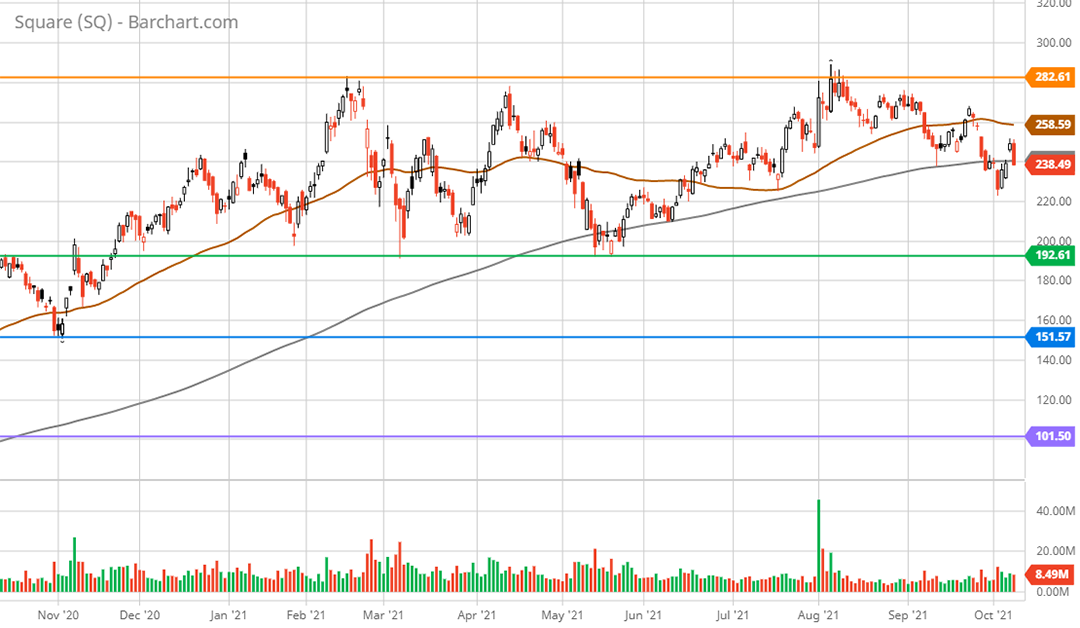
Since mid-November 2020, Square’s share price behavior is best described as a trading range with $283 as the ceiling and $193 as the floor (green line). The $200 area is the nearest strong support level as it was resistance in Q4 2020 and has served as the lower support zone throughout 2021. This level has been tested on four separate occasions so far in 2021, suggesting the possibility that it could break. As things stand, the $193 to $200 area looks to be firm support and is likely to serve as a battleground for the share price.
If this level fails, the $150 area stands as the next support zone which was resistance throughout Q3 2020 (blue line). Based on the fundamental and valuation backdrop, the area closer to $150 looks to be the first attractive risk/reward accumulation level. The purple line near $100 is the lowest support zone and was key resistance in 2018 that was finally surpassed in July 2020. This level seems unlikely to be retested given the strong organic revenue growth in recent years and should be a worst-case scenario for the shares.
I have carried the weekly support and resistance lines over to the 1-year daily chart below for reference and a closer look. It is notable that Square is currently testing the 200-day moving average (grey line on the daily chart). This should set up an important period for Square’s shares heading into year end.
Square 1-year daily chart. Created by Brian Kapp using a chart from Barchart.com
Summary
Square is generating impressive organic revenue growth of 37% per year since 2018. While revenue growth has been excellent, the underlying profitability of the company’s business model is clouded by the even more impressive 47% growth rate of the company’s operating expenses. The rapidly increasing cost structure combined with a budding downtrend in gross profit margins complicates the underlying profitability picture.
The profitability picture is further clouded by Square’s recent acquisition spree. The TIDAL purchase appears to be an unrelated business that carries meaningful risk without commensurate reward. The Afterpay acquisition adds fuel to the uncertainty fire as the purchase price is extraordinary and exposes Square’s shareholders to substantial ownership dilution.
The excessive purchase price for Afterpay offers a window into Square’s view of its relative value compared to Afterpay. The read through to Square’s view of its sustainable organic profit growth potential is negative given the large discrepancy between Square’s and Afterpay’s current adjusted income figures.
When Square’s elevated valuation is added to the equation, the risks outweigh the rewards at the current share price. That said, as a leader in the dynamic fintech space, the company is a must add to the watchlist of all growth investors. A more attractive entry point would better compensate investors for the elevated risk level of the shares. The fundamental and technical pictures place the lower end of the $150 to $200 zone as the first attractive risk/reward entry level.
Price as of report date 10-8-21: $247.80
Square Investor Relations Website: Square Investor Relations


