
I am assigning Snap Inc. (NYSE:SNAP) a positive risk/reward rating. The primary factors include its peer-leading growth profile, track record of consistent execution, rapidly expanding profitability, and strategic positioning at the intersection of social media and augmented reality. The positive risk/reward rating comes with the caveat that extreme volatility is likely to be a persistent feature for Snap investors. As a result, the shares are most appropriate for those with a high-risk tolerance seeking a long-term secular growth opportunity.
Risk/Reward Rating: Positive
Snap is arguably the most dynamic growth opportunity in the technology, media, and telecom space; strategically positioned at the intersection of social media and augmented reality. At first glance, this statement may appear unusual given Snap’s vision articulated in its 2021 10-K:
Snap Inc. is a camera company. We believe that reinventing the camera represents our greatest opportunity to improve the way people live and communicate.
Given the stagnation of the global camera market, describing Snap as arguably the most dynamic growth opportunity may indeed appear provocative given its mission statement.
The global penetration of smartphones reached maturity in 2017 with global smartphone shipments at 1.56 billion. Shipments then declined through 2020 before increasing to 1.39 billion in 2021. Given a total global population of approximately 7.9 billion, and the smartphone volume peak of 1.56 billion units in 2017, it is safe to say that the smartphone market is fully penetrated. The growth cadence will now be driven by hardware upgrade cycles.
What this means for Snap, for all intents and purposes, is that everyone in the world now has a camera with them at all times. Additionally, the increasing capabilities of cameras combined with higher bandwidth services will create a robust growth environment for Snap given the rapidly growing visual opportunities. The following quote from Snap’s 2021 10-K begins to clarify the opportunity (emphasis added):
In the way that the flashing cursor became the starting point for most products on desktop computers, we believe the camera screen will be the starting point for most products on smartphones… Our flagship product, Snapchat, is a camera application that helps people communicate visually… because images created by smartphone cameras contain more context and richer information than other forms of input…
The crux of Snap’s vision is visual data, no pun intended. When one steps back to consider this remarkably simple idea, it becomes evident that Snap is creating tools and applications which will enable people to take control of and build their version of reality with their associated metaverse preferences. Evan Spiegel, Co-Founder and CEO, summed up Snap’s vision well on the Q4 2021 earnings call: “our vision of computing overlaid on the world.”
This is decidedly different than most metaverse investment opportunities which rely more heavily on artificial or virtual reality. In essence, Snap is focused on enabling the augmentation of physical reality with a visual computing overlay platform. A final quote from Snap’s 2021 10-K:
The strength of our core business has enabled us to accelerate our investments in augmented reality, transforming the way that the Snapchat community experiences the world through our camera.
Growth Trajectory
In fact, Snap’s core business has been incredibly strong. The company has achieved an annualized sales growth rate of 49% over the past four years. The most interesting aspect of Snap’s growth trajectory is the remarkable consistency of it. The following table displays Snap’s sales performance by geography and was compiled from the company’s 2021 10-K and 2018 10-K filed with the SEC.
I have highlighted the key sales growth data in blue. Please note that North America includes Mexico, Latin America, and the Caribbean while Europe includes Turkey and Russia. The 2022* column represents the consensus revenue estimate for 2022.
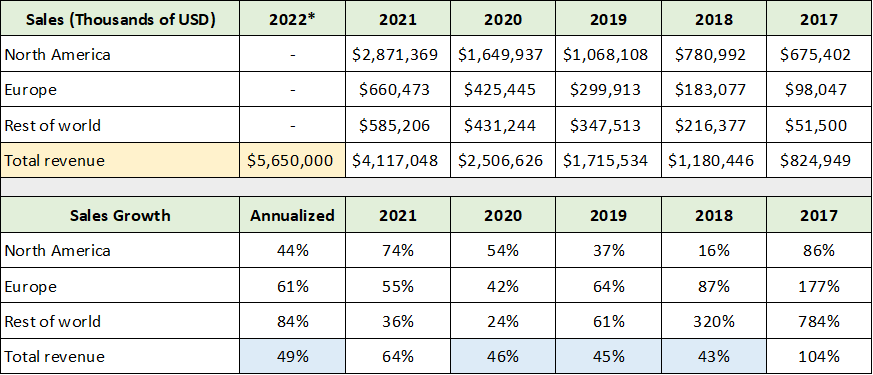
Source: Created by Brian Kapp, stoxdox
Notice that total sales growth was very consistent in the mid-40% range from 2018 through 2020, with upside growth outliers in 2021 and 2017. The 104% revenue growth in 2017 was due to a small revenue base, while the 64% growth in 2021 was the result of both excellent execution and the positive pandemic tailwinds for the online advertising market.
Given the 64% growth outlier in 2021, sales are likely to revert to the underlying trend over the coming year. The following table was compiled from Snap’s Q1 10-Qs for 2021, 2019, and 2017. The Q1 2022* column represents the midpoint of management’s guidance for revenue and DAU (Daily Active Users) for Q1 of 2022.
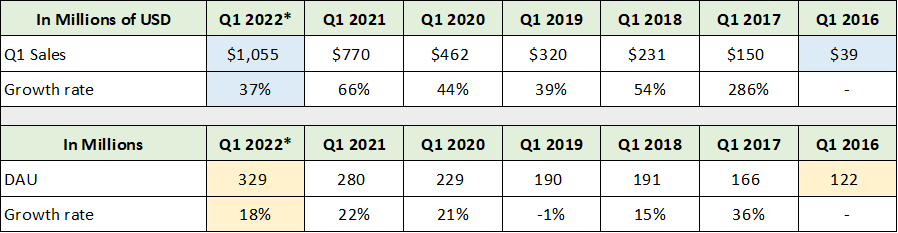
Source: Created by Brian Kapp, stoxdox
I have highlighted in blue the key sales growth data. Management is forecasting a reversion to trend for sales in Q1 2022 at 37% growth. This level of growth returns the 2-year annualized growth rate to 50%, which is nearing the mid-40% baseline trajectory prior to 2021. Notice the incredible growth over the past six years with Q1 sales of $39 million in 2016 compared to an estimated $1.055 billion in 2022 (73% annualized).
The key Daily Active User data is highlighted in yellow. Similar to revenue growth, DAU growth has been very consistent at 18% annualized since 2016 with an outlier in 2019. Management’s guidance for 18% growth in Q1 2022 is in line with the relatively stable growth rate over the past six years.
Given Snap’s focus on the camera and visual applications, every smartphone user is part of the realistic target market for the company. As a result, the user growth runway remains quite long for Snap compared to competing social media and metaverse firms.
Peer Comparison
Comparing Snap to its three most prominent peers places its growth trajectory into greater context. The top peers are Meta Platforms (NASDAQ:FB), Twitter (NYSE:TWTR), and Pinterest (NYSE:PINS). From a product positioning and business model perspective, I view Snap’s total addressable user market as being more on par with Meta Platforms (Facebook) than Twitter and Pinterest. This is due to the universal use case of the Facebook and Snap platforms compared to the more specific use cases that can be leveraged on the Twitter and Pinterest platforms.
My view of a more limited addressable user market for the Twitter and Pinterest platforms is supported by the user data of the two compared to Snap and Facebook. Twitter discontinued its Monthly Active User metric in Q1 of 2019 after users fell 3% to 321 million in Q4 of 2018. The company then switched to what it calls Monetizable Daily Active Users which is currently 35% lower at 211 million compared to the Q4 2018 user metric. Similar to Twitter in 2018, Pinterest reported a 6% decrease in Monthly Active Users to 421 million in 2021 compared to 2020. While the user base is larger at Pinterest, it looks to be mature in terms of market penetration.
Users on the Facebook platform also slowed rapidly to 4% growth in 2021 following 11% growth in 2020. However, the slowdown is largely a function of market saturation for Facebook, with 1.9 billion Daily Active Users. Given the universal camera or visual data platform approach by Snap, I view the 1.9 billion Facebook users as being in Snap’s total addressable market. The following table was compiled from Seeking Alpha and provides the historical sales performance for Meta Platforms.
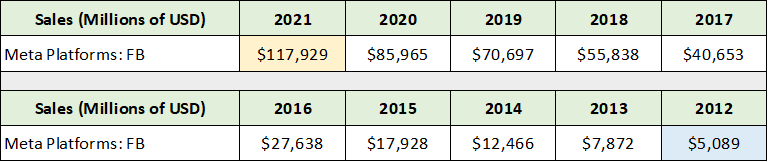
Source: Seeking Alpha. Created by Brian Kapp, stoxdox
I have highlighted key cells for context when reviewing the Snap investment case. In 2012, Meta Platforms achieved $5.1 billion of sales (highlighted in blue). This is similar to the $5.65 billion of sales expected for Snap in 2022. While I am not predicting or expecting that Snap will grow to such an incredible size, Meta Platforms does highlight the market opportunity for Snap.
If the Facebook user base is in the addressable market ballpark for Snap, the company has now penetrated roughly 20% of the total market. Nonetheless, at a consistent 18% user growth rate, Snap has a unique user growth profile compared to its largely stagnant peer group.
A similar theme emerges when looking at the consensus revenue growth estimates for the peer group. Snap has a uniquely high growth profile compared to the competition. The following table displays consensus revenue growth estimates (compiled from Seeking Alpha) for Snap, Pinterest, Twitter and Meta Platforms through 2026.
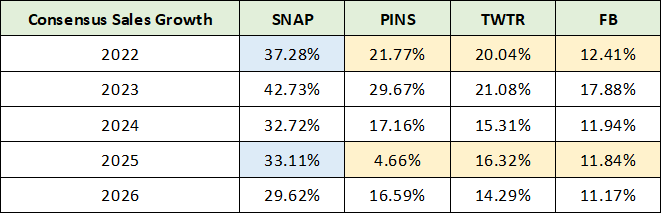
Source: Seeking Alpha. Created by Brian Kapp, stoxdox
I have highlighted the 2022 and 2025 consensus estimates in order to contrast the current growth profile of Snap with that of its peers. The consensus estimates appear to be fair given the trajectory of each company. It is reasonable to expect Snap’s revenue growth to slow from the mid-40% range in recent years to the low-30% range into mid-decade. Consensus estimates for Snap’s peers over the coming years may be on the high side given the stagnant to declining user growth on the platforms. In either case, it is clear that Snap has the leading growth profile of the group.
Growth Strategy: Capital Investment
In addition to leading its peer group in sales and user growth, Snap is also investing aggressively for the future. The above consensus revenue growth estimates for Snap likely assume the current growth trajectory persists within a natural growth deceleration curve. It is unlikely that large upside potential resulting from Snap’s investments is a meaningful contributor to consensus sales growth rates through 2026.
The following table was compiled from Snap’s 2021 10-K filed with the SEC and summarizes the company’s capital investments in recent years. I have highlighted the largest single acquisitions. I will provide a brief summary of each as the capital allocation choices provide color to the growth strategy.
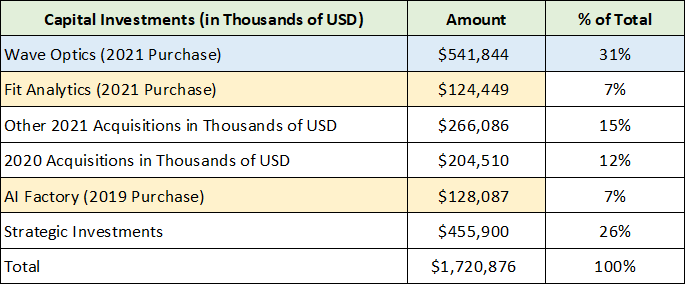
Source: Created by Brian Kapp, stoxdox
Snap has invested $1.7 billion in recent years and $932 million during 2021 alone. The Wave Optics purchase was the largest at $542 million and accounted for 58% of the total for 2021. This particular acquisition illuminates Snap’s strategy to create a full stack of capabilities in the augmented reality ecosystem. Wave Optics is a display technology company that develops and supplies light engines and diffractive waveguides for augmented reality displays.
Wave Optics
Essentially, the Wave Optics acquisition enables Snap to empower hardware manufacturers and software engineers to create fully-functional augmented reality devices and applications. The eyewear and headset market are the most natural market fit during the early S curve growth phase for augmented reality. There are many other use cases for the technology as adoption grows across consumer and industry groups. The purchase details are displayed in the following table which was compiled from Snap’s 2021 10-K.
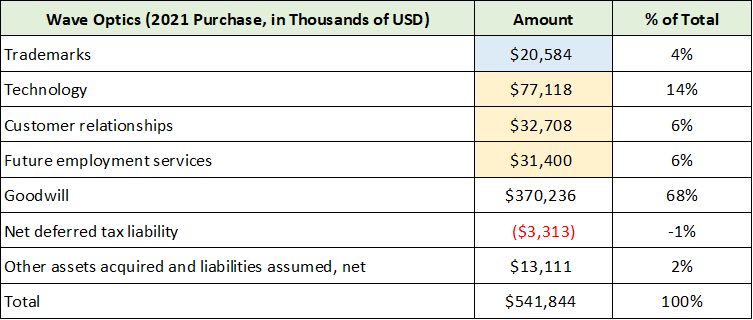
Source: Created by Brian Kapp, stoxdox
I have highlighted the key details of the acquisition. While one expects a substantial goodwill allocation in technology acquisitions, it looks as if Snap received material identifiable tangible value in technology, employees, trademarks, and customer relationships. I found the $21 million allocation to trademarks to be interesting and a positive signal for Wave Optics’ brand recognition in the marketplace. The material $33 million assigned to customer relationships supports this signal.
The Wave Optics acquisition is a clear strategy indicator that Snap has chosen to take control of its own destiny in the augmented reality space. Wave Optics offers Snap valuable design and timing optionality. Snap will now be in a position to affect the hardware development cycle which will offer greater degrees of freedom in executing on its vision.
Fit Analytics
Snap describes Fit Analytics as a sizing technology company that enables solutions for retailers and brands to grow e-commerce and expand their offerings. This is an immediate industry use case that solves the problem of size selection and excessive product returns resulting from e-commerce sales. The retail industry is a natural first mover in augmented reality.
In the case of Fit Analytics, the $124 million investment looks high at first glance. However, it is a key industry vertical for use cases and it is quite large. The following table displays the details of the acquisition for reference.
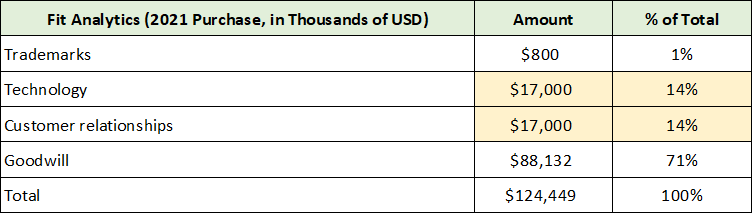
Source: Created by Brian Kapp, stoxdox
Fit Analytics looks like a reasonable investment choice as it opens the door for use cases on both the industry and consumer side. The acquisition could offer material growth upside through 2026 while building out Snap’s augmented reality ecosystem.
AI Factory
Snap describes the purpose of the AI Factory acquisition as enhancing the functionality of their platform. AI Factory is also depicted as a content and technology company. Given Snap’s social media business, this appears to support and sustain the underlying growth trajectory of the core business lines. The details are in the following table for reference.
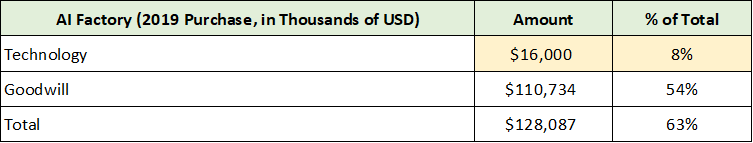
Source: Created by Brian Kapp, stoxdox
While there is little detail on the less material investments, the three large investments point toward Snap making intelligent investment choices that are in sync with its stated vision. It is also encouraging to see continued investment in core capabilities (AI Factory) alongside the heavy growth investments (Wave Optics and Fit Analytics).
Strong Financial Position
To fund its long-term business plan, Snap has made heavy use of the convertible bond market with $3.5 billion of bonds outstanding. Given this pool of low-cost capital and Snap’s early stage of development, this looks like an excellent capital supply choice. The following table summarizes the debt maturities, principal amount, and price per share at which the convertible bonds become equity equivalents. It was compiled from Snap’s 2021 10-K filed with the SEC.
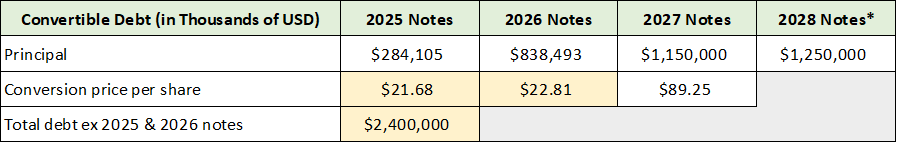
Source: Created by Brian Kapp, stoxdox
The 2025 and 2026 maturity bonds are solidly in the money above the conversion price. If we exclude these as equity equivalents through 2025 and 2026, Snap’s total debt becomes $2.4 billion. The following balance sheet data displays Snap’s net liquid financial position assuming $2.4 billion of convertible debt (highlighted in yellow) and assuming all of the convertible debt gets exchanged into equity (highlighted in blue).
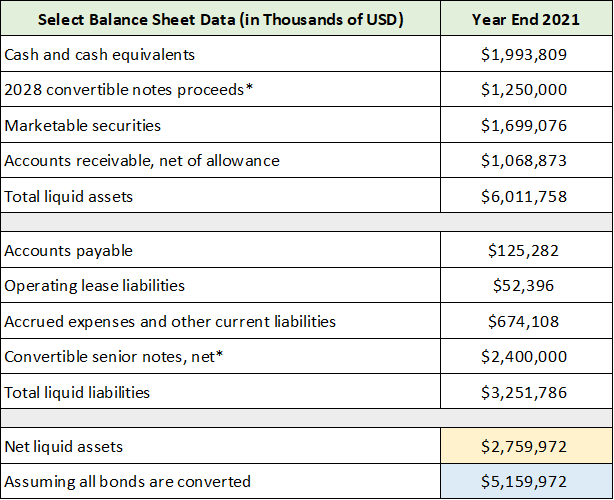
Source: Created by Brian Kapp, stoxdox
With a net liquid position of between $2.8 and $5.2 billion, Snap is in a powerful financial position with significant investment resources. In addition to the strong balance sheet, Snap has begun to generate significant cash flow and adjusted EBITDA enabling it to fund growth internally. The following table summarizes Snap’s profitability in Q4 of 2021 and for the full year. I have highlighted the key data points.
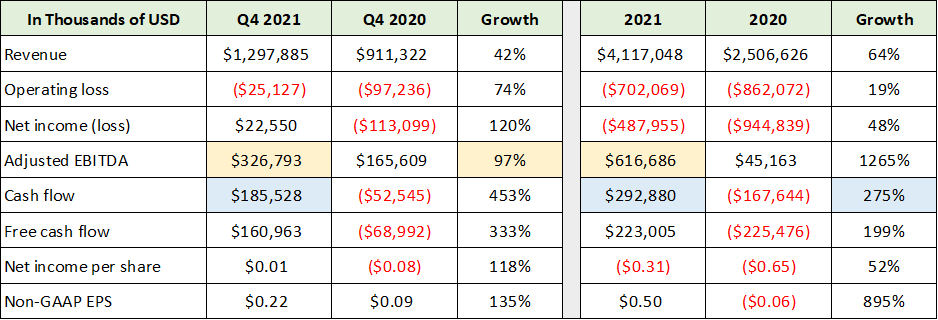
Source: Created by Brian Kapp, stoxdox
Valuation
Given the bright growth outlook and rapidly improving profitability, this is an appropriate time to review Snap’s current valuation and begin to formulate a potential return spectrum. The following table was compiled from Seeking Alpha and displays the consensus earnings and sales estimates for Snap through 2026. I have highlighted 2023 and 2024 as the expected growth rates and valuation hint at potential upside.
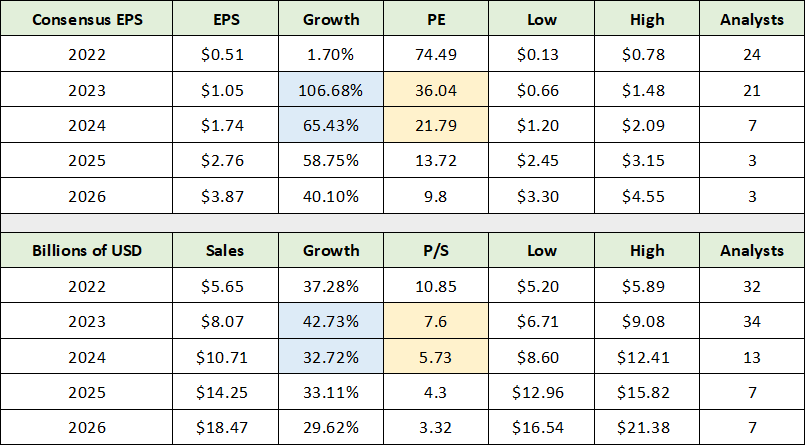
Source: Seeking Alpha. Created by Brian Kapp, stoxdox
Please keep in mind that the above earnings estimates are non-GAAP estimates, which exclude things such as stock-based compensation expense. Nonetheless, the expected earnings growth rates from 2023 onward are exceptional. Furthermore, the forward valuation multiples are quite reasonable in relation to the consensus growth estimates.
The flat earnings estimate for 2022 is in line with management’s guidance and is the result of an aggressive growth investment plan for 2022. There remains upside surprise potential to the 2022 consensus earnings estimate. Favoring growth over profitability near term looks wise as Snap is facing an intensely competitive environment. Facebook changing its name to Meta Platforms and rolling out a massive metaverse investment strategy is a clear market signal. The industry is staging a fundamental shift and the time to position oneself is now.
Return Potential
Estimating a potential return spectrum for high-risk secular growth stocks is by its nature exceedingly difficult. My approach for Snap is to apply what I view as a reasonable valuation spectrum on adjusted earnings estimates in light of Snap’s growth profile. In the following table I apply an earnings multiple of between 30x and 60x to consensus earnings estimates through 2026 in order to construct a potential return spectrum. Please keep in mind that downside potential exists outside of this range as I am assuming that consensus earnings estimates are achieved.
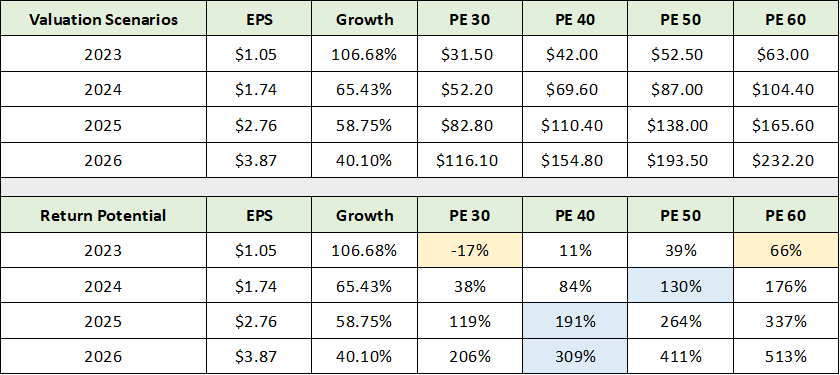
Source: Created by Brian Kapp, stoxdox
I have highlighted in yellow what I view as a realistic 1-year potential return spectrum. The -17% return at 30x the 2023 consensus earnings estimate looks to offer a great support level if Snap matches expectations. While 60x is an elevated valuation, it remains quite reasonable in light of the 107% earnings growth expectation in 2023.
The blue highlighted cells represent what I view to be a reasonable baseline expectation through 2026 assuming Snap executes in the ballpark of consensus growth estimates. The resulting total return spectrum from a fundamental perspective is -17% to +309% over the coming four years. This return spectrum is generally well supported by the technical backdrop.
Technicals
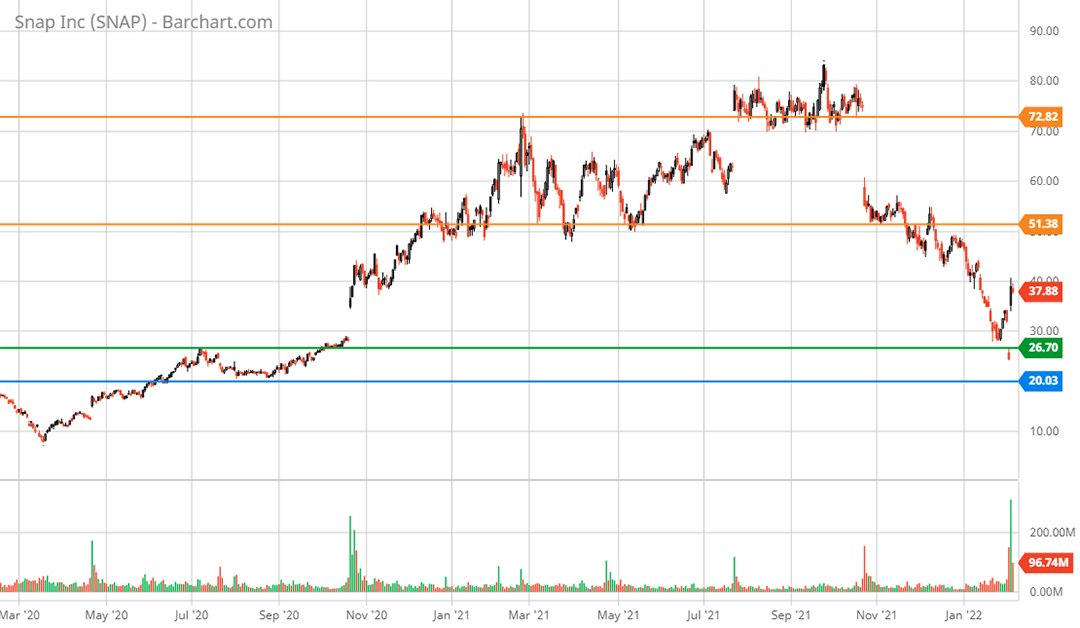
The technical picture for Snap supports the fundamental upside scenario while introducing additional downside risk. The following 5-year weekly chart displays the technical canvas. I have highlighted the primary resistance levels with orange horizontal lines and the key support levels with the green and blue lines.

Snap 5-year weekly chart. Created by Brian Kapp using a chart from Barchart.com
The green line near $27 should offer strong support as this was key resistance following the IPO in 2017 as well as the first resistance level following the rally off the COVID bottom in March of 2020. This support level recently received confirmation following the disappointing Meta Platform earnings, which sent Snap down 25% before rocketing higher following Snap’s Q4 2021 earnings report. The return potential to this support level is -29% from the current price of $37.88. Additionally, this primary support level is reasonably consistent with the -17% downside estimate from the fundamental return scenario spectrum.
The blue line near $20 was the critical resistance level for the bottoming pattern that Snap carved out over the 3 years following its IPO. The break above this level occurred in June 2020 and signaled the beginning of the bull market move that peaked near $83 in September of 2021. This level should be a worst-case scenario as things stand and represents -47% downside risk. I view a retest of this support level to be a low probability barring a significant miss to the consensus sales estimate over the coming year. The following 2-year daily chart offers a closer look at the current price in relation to the support and resistance levels.
Snap 2-year daily chart. Created by Brian Kapp using a chart from Barchart.com
Turning to the primary resistance levels, the $51 area is the first hurdle and represents 36% upside potential. This is likely to offer stiff resistance in the near term. The next resistance level is in the $73 area and represents 93% upside potential.
The midpoint of these two key resistance levels fits very nicely with the 66% upside return potential derived from applying a 60x PE multiple to the 2023 consensus earnings estimate. The fundamental and technical alignment for this first price target reaffirms it as an excellent baseline expectation over the coming year. There are no technical resistance levels once new highs are reached. This opens the door to the additional upside return potential calculated using consensus earnings estimates between 2024 and 2026.
While I generally do not use very short-term charts in constructing a technical backdrop, they are often required for wildly volatile stocks like Snap. The following 1-month chart will help inform an accumulation strategy for Snap shares.
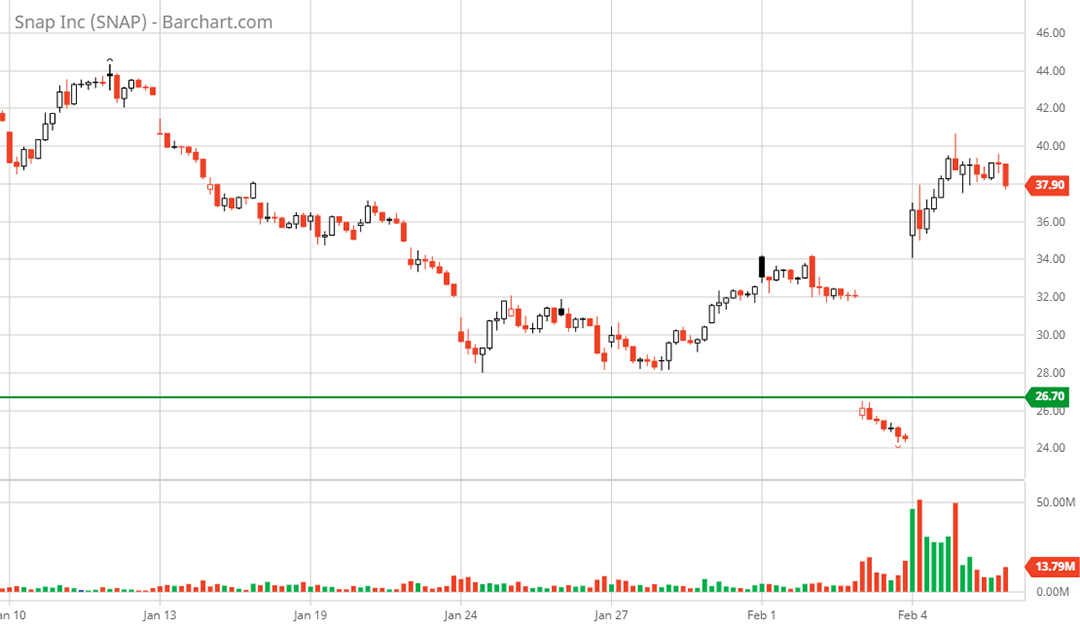
Snap 1-month chart. Created by Brian Kapp using a chart from Barchart.com
Snap gapped up an incredible 55% immediately after reporting earnings on February 3, 2022. This followed a massive -25% gap lower in response to the Meta Platforms earnings report that preceded Snap’s results. Essentially, there was no trading in Snap shares recently between $26 and $32 and little trading between $24 and $36. In technical analysis terms, gaps are usually filled.
As a result, the most rewarding accumulation strategy is likely to involve acquiring Snap shares on a retest of the gap zone surrounding the $32 area ($30 to $36). This comes with the caveat that Snap is a secular growth opportunity for which this type of purchasing finesse is less important if one is looking at long-term returns. For new Snap investors, staking an initial position near current prices with the intent to accumulate into the gap fill looks to be reasonable. It is a compromise in balancing the long-term potential upside with the short-term downside created by the technical overextension resulting from the recent gap higher.
Special Risk Factor: Insider Control
It should be noted that Snap carries a special risk factor for public investors. The two co-founders control the voting stock of the company. This control risk is substantial and may materialize under adverse market conditions should Snap begin to struggle to meet growth expectations. It should also be noted that the two co-founders are unusually young at 31 and 33 years old.
I view the age of the company’s leaders to be a potentially large strategic asset as they are well-placed demographically to understand the core millennial and Gen-Z target market. Additionally, they are well-placed to lead for the extraordinarily long secular growth opportunity in front of Snap.
Finally, the board of directors is exceptionally well-diversified, with ages ranging from 31 to 75. The choice of Michael Lynton as Chairman of the board offers an excellent counterbalance with the co-founders. Michael is 62 years old and has deep experience in the technology, media, and telecom sector. He served in leadership roles at market-leading firms such as Walt Disney (NYSE:DIS), AOL Time Warner, and Sony Entertainment Inc. (NYSE:SONY). All told, I view the age and skillset diversity of the Snap executive suite and board to be a strategic advantage.
Summary
Snap is a top choice for risk-tolerant secular growth stock investors. The core social media business is firing on all cylinders placing Snap in the pole position amongst its peer group and in the upper echelon of the growth stock universe. The company’s vision for the future sets it apart from the metaverse crowd: computing overlaid on the world to augment reality rather than a world subjugated to the computing of virtual realities. As a result, Snap’s growth could become explosive if the company continues to successfully execute on its larger visual computing and augmented reality mission.
Price as of this report: $37.88
Snap Investor Relations Website: Snap Investor Relations