
The butterfly offers a robust mental model for viewing the present and the future as it unfolds. Applying the butterfly model to investment opportunities is especially powerful. After all, an investor’s job is to clearly see the present (a caterpillar) while keeping sight of the vast possibilities (a butterfly).
The above quote from the report “Of investment models and butterflies“ sets the stage for viewing growth stock opportunities. When it comes to growth stocks, one must take a step back from the current news flow to reflect upon future possibilities. Shake Shack is a great example of these opportunities.
Shake Shack
The most interesting feature of the Shake Shack (NYSE:SHAK) investment opportunity is that its extraordinary brand potential was self-evident at the time of its IPO in January of 2015. That said, the company’s business model at the time, and until quite recently, prohibited the full realization of Shake Shack’s brand equity opportunity.
Due to the conflict between the extraordinary potential of the Shake Shack brand and its limited business model, I have monitored it casually over the years. Today, the business model limitations are a thing of the past as the company now has a credible blueprint for penetrating the restaurant mass market.
Business Model
The prior business model limitations revolved around the company’s restaurant format. Essentially, Shake Shack was developing larger restaurants which were similar to the full-service, casual dining concepts which pervade society. Such full-service, casual dining concepts have proven to be of limited potential in terms of ultimate equity value realization.
Darden Restaurants is an excellent example of the brand equity limitations that are innate to the full-service, casual dining industry. The company has long been a leader in the space, with an equity value of just under $20 billion dollars today. This valuation equates to 1.9x sales estimates for the current year.
Darden has reached maturity and is valued at just under $20 billion. While Darden is not strictly a direct comparable, Shake Shack’s original business model was quite Darden-like and faced a similar hard ceiling in regard to potential equity value.
Changing Its Colors
The core challenge for Shake Shack living up to its full brand potential primarily has revolved around its restaurant format. The following series of slides are from the company’s January 2023 investor presentation with the first depicting the original, Darden-like business model.
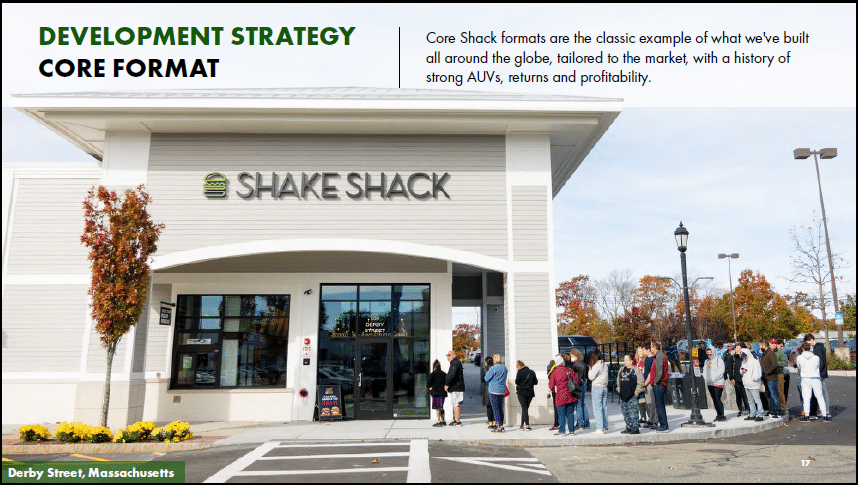
Source: Shake Shack ICR Conference January 10, 2023
The above image is an example of the original restaurant format which one would find alongside similar concepts in shopping centers. The following two slides depict the essence of the strategy change which has significantly expanded the brand equity opportunity and thus valuation potential for Shake Shack.
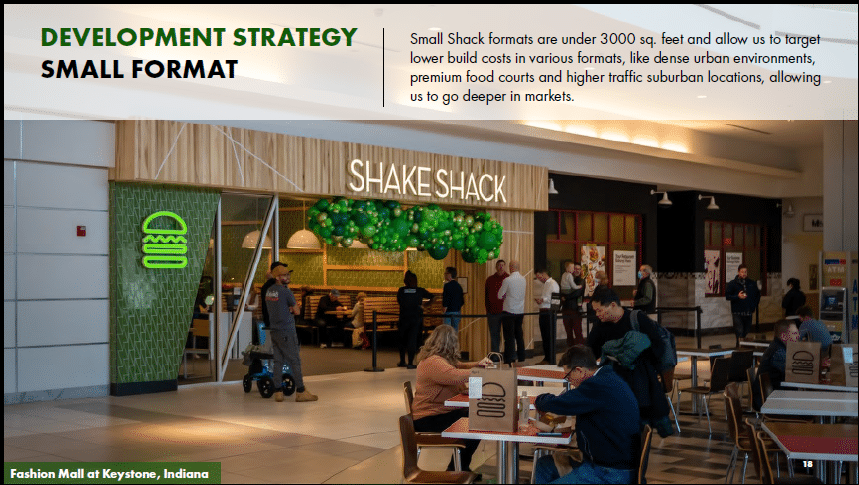
Source: Shake Shack ICR Conference January 10, 2023
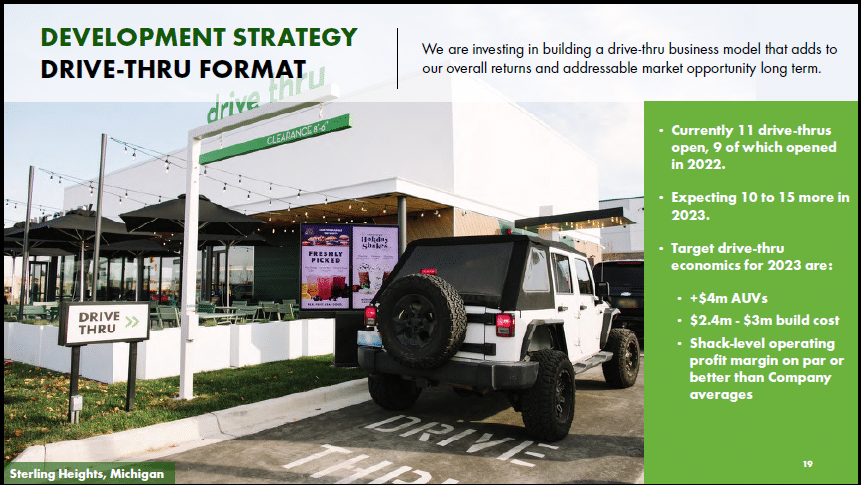
Source: Shake Shack ICR Conference January 10, 2023
Smaller store formats and drive-thru restaurants open the door to densification and thus maximum market penetration. This dynamic is on display in the next image which offers a case study that speaks to the full potential of Shake Shack’s brand under the new strategy.
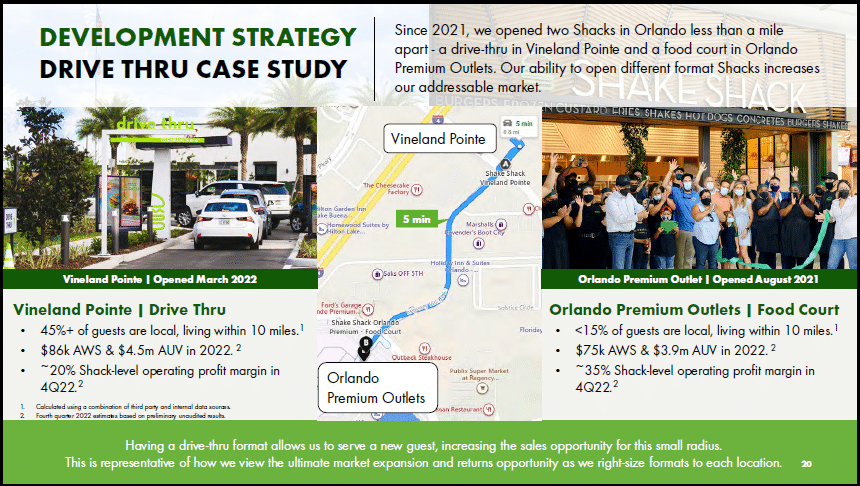
Source: Shake Shack ICR Conference January 10, 2023
The Orlando example in the above image gets to the crux of the matter; two restaurants operating successfully within one mile of each other. Prior to the strategy change, the company estimated that it could open 450 US restaurants. Shake Shack’s business model change opens the door to a much larger footprint, thus maximizing the company’s equity potential.
In addition to enabling densification in urban and suburban areas, the new format strategy enables Shake Shack to target all available markets. For example, captive audiences are now in play for the brand. Recent examples of captive audience targeting include new restaurants located in airports and resorts. Travel market demand is quite large and lucrative in its own right.
Brand Equity Potential
Smaller formats and drive-thru restaurants fundamentally change Shake Shack’s competitive positioning and remove Darden as a comparable company. Shake Shack’s change of color places its brand potential in league with the industry leaders: Chipotle Mexican Grill, Wingstop, Starbucks, and McDonalds.
The importance of the strategy shift and the change in comparable companies is evident in the equity valuations of the four industry leaders. The following table displays the equity valuation of these four companies, as well as that of Darden and Shake Shack.
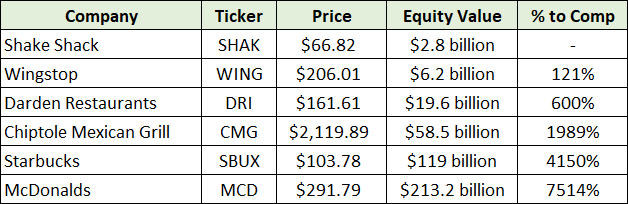
Created by Brian Kapp, stoxdox
Note that the % to Comp column depicts the upside return potential if Shake Shack were to reach the level of success and valuation achieved by each comparable company. Given Shake Shack’s strategy shift, I view Chipotle’s valuation as a realistic long-term target, if the company can successfully execute its business plan.
The Starbucks and McDonalds targets, while not impossible, remain highly unlikely. Nonetheless, the upside potential remains substantial using the first three comparable companies in the table.
Consensus Estimates
Given Shake Shack’s corporate youth and related earnings power immaturity, viewing consensus sales expectations and the price-to-sales valuation ratios into mid decade is the most informative approach. The following table displays consensus estimates for Shake Shack and the four industry leaders. I have highlighted in yellow the price-to-sales ratio using next year’s estimates for ease of comparison.
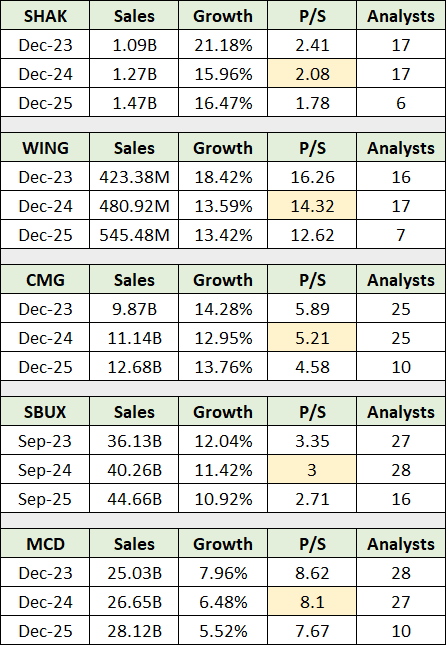
Source: Seeking Alpha. Created by Brian Kapp, stoxdox
Notice that Shake Shack trades at a steep discount to the four comparable companies. Additionally, take note of the wide dispersion in the valuation of each company. Wingstop trades at an incredible 14x 2024 sales estimates on the high end, while Shake Shack trades at 2x 2024 estimates on the low end.
All things equal, higher growth rates should translate into higher valuations. As a result, what immediately jumps out from the above comparison is that Shake Shack is the youngest of the group while trading at the lowest valuation. This is unusual as Shake Shack offers the greatest growth potential of the comparable companies, as can be seen in the next table.
The table below displays the number of restaurants in operation for each company as of the most recent quarter and the percentage of the locations which are licensed (franchised). The % of Stores column displays Shake Shack’s total restaurant count as a percentage of each comparable company’s store count.
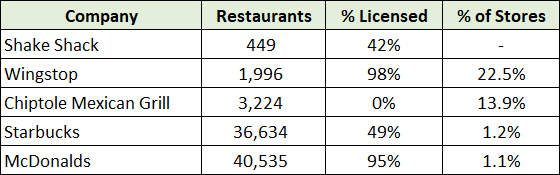
Created by Brian Kapp, stoxdox
It is self-evident that Shake Shack’s growth runway is quite long in relation to its top peers. As the company’s strategy shift opens the door to deep market penetration worldwide, success is largely a function of execution. In other words, Shake Shack should control its own destiny.
Returning to the prior table and the wide valuation dispersion from 2x sales (Shake Shack) to 14x sales (Wingstop), the % Licensed column in the store count table holds the answer to the dispersion question. McDonalds and Wingstop are primarily licensing business models and trade at large premiums to the group at 8x and 14x sales, respectively.
The bottom line, licensing or franchise business models receive much higher valuations than do company-operated restaurant models. From this perspective, and a potential valuation premium, Shake Shack’s future could be quite bright. The following slide from the January 2023 investor presentation displays the number and locations of licensed restaurants globally.
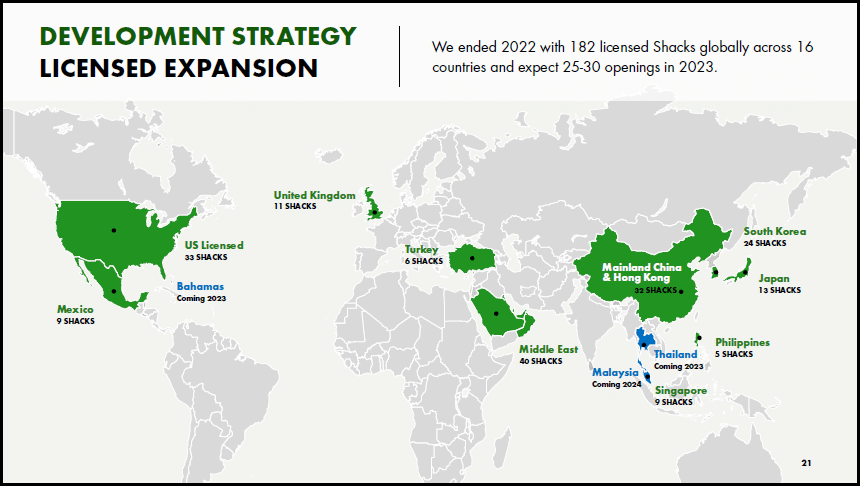
Source: Shake Shack ICR Conference January 10, 2023
What is clear from the above image is that Shake Shack has only scratched the surface of its global licensing potential. The company has developed a foothold in the top Asian and Middle Eastern markets and can expand from there. The remainder of the world outside of the US remains untouched to date.
While it is unclear how many Shake Shack restaurants are ultimately possible, with the new strategy it is safe to say that the number is many multiples of its current restaurant base of 449. For reference, Chipotle’s 3,224 are almost entirely in the US market, while McDonalds has just under 13,500 in the US. Internationally, McDonalds has just under 27,000 restaurants and Starbucks has nearly 18,000 store fronts.
A small fraction of McDonalds’ global footprint would translate into a Chipotle-sized brand equity opportunity for Shake Shack investors.
Technicals
Turning to the price action, Shake Shack’s share price has been largely unchanged since the company’s January 2015 IPO. That said, the shares have established an uptrend over the past year which is likely due to the company’s evolving business model. The following 1-year daily chart captures the recent uptrend.
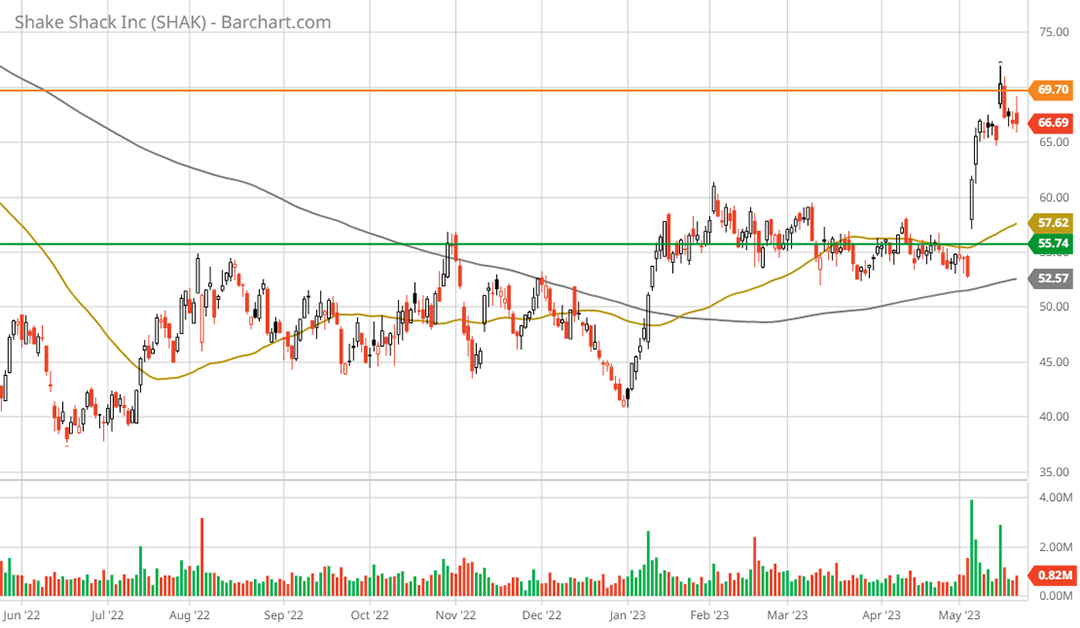
Shake Shack 1-year daily chart. Created by Brian Kapp using a chart from Barchart.com
On all of the charts, the green line represents the key support zone and the orange lines depict the primary resistance levels. Additionally, the gold line represents the 50-period moving average while the grey line is the 200-period moving average.
Notice that the 50-day moving average crossed above the 200-day moving average on January 23, 2023. This golden cross carries a bullish technical interpretation and confirms the short-term uptrend. The recent price spike followed the company’s May 4, 2023 earnings report and reaffirms the bullish price trend.
Following the May earnings report, the shares were rejected at the first resistance level (the orange line), which was to be expected. Keep in mind that resistance levels are technical price targets. Return potential to the upper two resistance levels is 21% and 69%, respectively. The following 5-year weekly chart provides a longer term view.
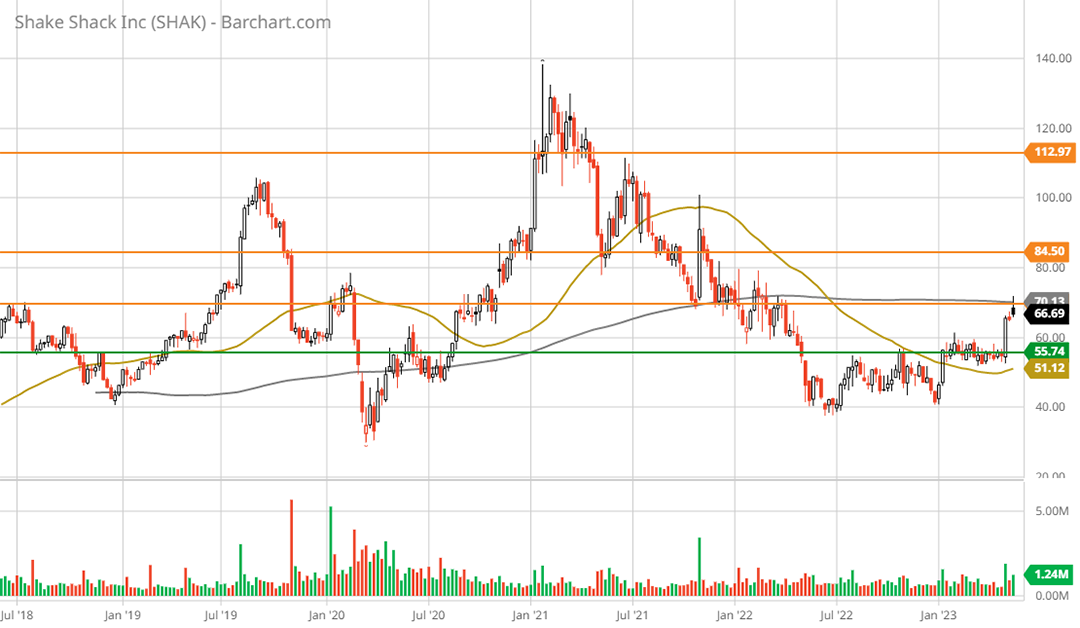
Shake Shack 5-year weekly chart. Created by Brian Kapp using a chart from Barchart.com
Shake Shack put in a double bottom near $40 per share in June and December of 2022, while forming what should be a strong support base near $56 per share (the green line). A retest near this support level would represent an ideal accumulation opportunity.
Summary
Shake Shack represents a rare growth stock opportunity in the restaurant industry. As evidenced by the store count data, the company has just scratched the surface of the global market. When combined with the strategy change to include smaller format and drive-thru restaurants, the ultimate brand equity opportunity is quite large.
The upside opportunity is illuminated by Chipotle’s success at the high end, which would equate to 1,989% over the long term. Wingstop highlights the low end of the upside return spectrum at 121% over the intermediate term. With the shares trading within 16% of the primary support level, and bullish trends in place, Shake Shack represents an asymmetric risk/reward opportunity for secular growth stock investors. While it remains a caterpillar, Shake Shack may yet become a butterfly.
Price as of this report: $66.67
Shake Shack Investor Relations website