Risk/Reward Rating: Negative
Ross Stores is one of the largest off-price apparel and home fashion chains in the United States with 1,859 locations. Ross was especially hard hit by COVID which forced the shutdown of its stores for a portion of 2020. Given the reliance on physical stores as compared to online sales, the company’s earnings were devastated last year. In addition to the earnings hit, the company also took on over $2 billion of debt to cushion itself against the COVID impact. Ross has historically carried little debt on its balance sheet.
Even though things have returned to normal in 2021, Ross still expects its earnings to come in beneath the level achieved in 2019. In 2019, Ross earned $4.60 per share and the current estimate for 2021 is $4.33 (the company has guided to $4.20 per share on the high end). The valuation stands at 29x 2021 expected earnings which is quite high for a maturing retailer compared to historical stock market valuation norms.
Making matters worse, the earnings per share decline expected in 2021 is against a reduced share count as the company has an active share repurchase program. Ross plans to spend $650 million to buy back shares in 2021 and $850 million in 2022. While this will help support the share price, it does shine a light on the declining earnings growth for the company as a whole.
For example, net income for Ross was $1.66 billion in 2019 compared to $1.59 billion in 2018 representing a mere 5% growth rate in overall profitability. The estimates for 2021 would place net income in the $1.55 billion range which would represent a decline of 3% from 2018 earnings. This suggests that Ross is mature, and that overall profitability is stagnating and may be in decline. This is not what one would expect when paying 29x earnings for a stock.
The current business climate is also presenting challenges for Ross. The company is experiencing supply chain inflation in the form of higher freight transportation and raw materials costs. Additionally, Ross is facing increasing wage pressures from its workforce. These cost pressures show no signs of abating in the near term. Given that Ross serves the value conscious consumer, it will be difficult to pass along the higher expenses by raising prices which could place additional pressure on margins.
Finally, it should be noted that the company’s CFO just resigned to take a position at another company, which is a negative signal.
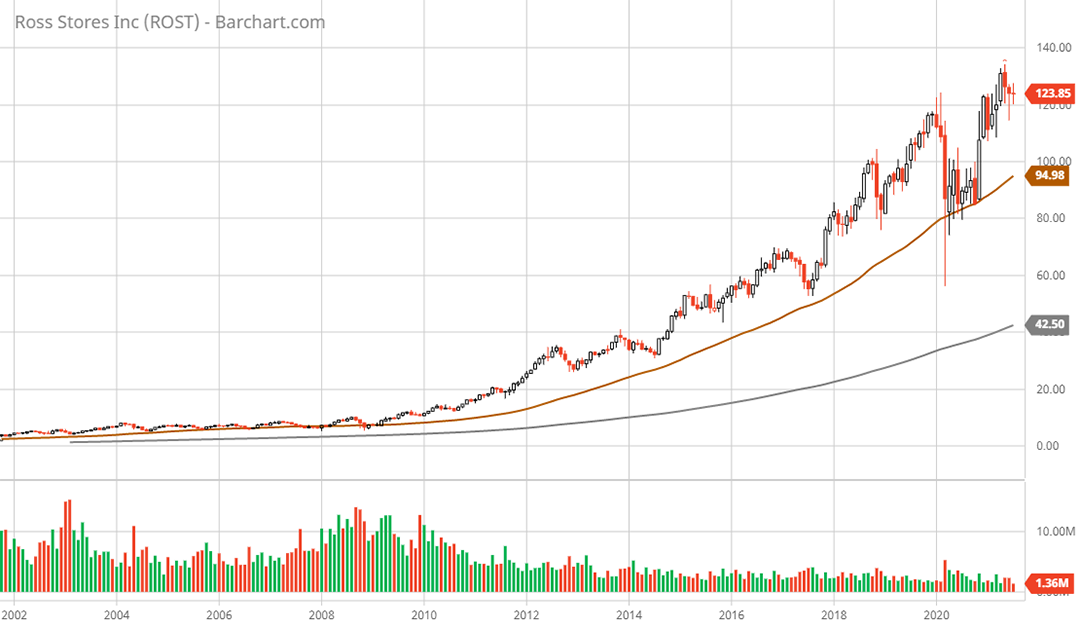
Technical backdrop: Ross has been one of the most successful retail stocks of the past decade plus as the shares rose from $5 in 2008 to $125 today (see Ross Stores 20-year monthly chart). While the stock market averages have powered ahead since their 2019 highs, it is clear that Ross is struggling to remain above its high in 2019 near $120. The loss of upward momentum for the stock aligns with the fundamental backdrop of earnings stagnation and decline.
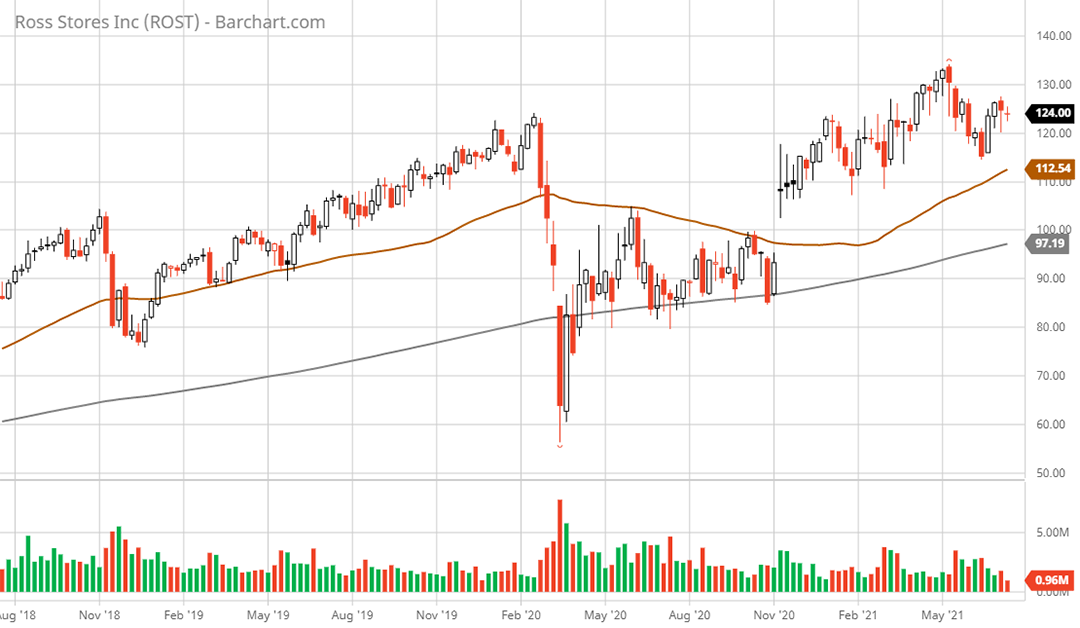
Technical resistance: current level which is near the all-time high in the $133 area.
Technical support: $112 is the 50-week moving average (brown line on the 3-year weekly chart) and $97 is the 200-week moving average (grey line on the 3-year weekly chart). The $97 area also represents the gap upward in November of 2020 suggesting that it is likely to be tested.
Price as of report date 7-15-21: $125
Ross Stores Investor Relations Website: Ross Stores Investor Relations
All data in this report is compiled from the Ross Stores investor relations website and SEC filings, and where applicable publicly available information regarding consensus earnings estimates.


