I am assigning Rio Tinto Group (NYSE:RIO) a positive risk/reward rating based on its leverage to Asian economic growth, its peer-leading copper growth potential, a robust outlook for the global aluminum market, and its asymmetric risk/reward profile. The downside is supported by a 10-year technical base and a discounted valuation, while the upside is bolstered by a structurally bullish supply and demand balance for industrial metals.
Risk/Reward Rating: Positive
Rio Tinto is among the world’s leading producers of iron ore and aluminum and offers one of the highest copper growth profiles amongst its peers. As a result, the investment case for Rio Tinto hinges on the global supply of and demand for these critical industrial commodities, as well as Rio Tinto’s competitive positioning.
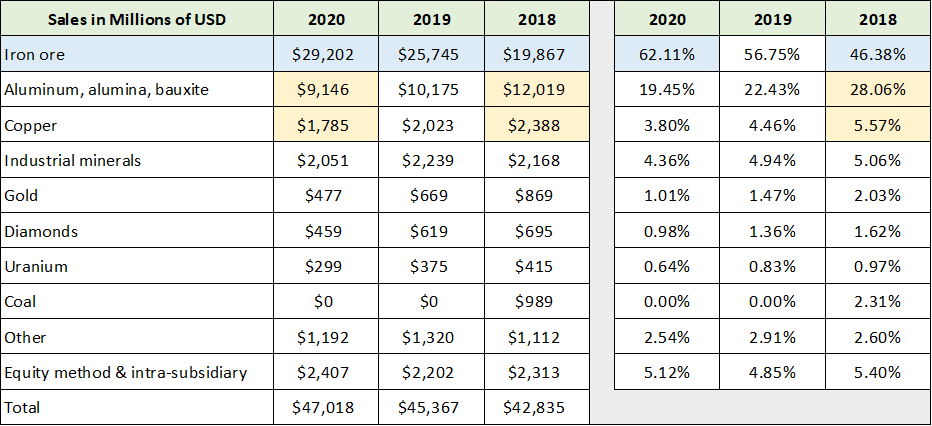
The following two tables provide an overview of Rio Tinto’s business by commodity and were compiled from Rio Tinto’s October 2021 Investor Seminar and Annual Report 2020, respectively. The first table provides an overview of the company’s sales and profitability by commodity segment through the first half of 2021. The second table provides a more granular look at the sales performance by commodity over the prior three years.
Source: Created by Brian Kapp, stoxdox
I have highlighted in blue the iron ore business as it has been a standout in recent years. It is the primary driver of Rio Tinto’s performance at 63% of sales and 75% of EBITDA through the first half of 2021. Sales growth from 2018 through 2020 was very strong at 47%. Annualizing the first half 2021 performance, sales growth is on pace to reach an incredible 118% compared to 2018.
Rio Tinto’s iron ore operations are centered in the Pilbara region of Australia and are arguably one of the highest quality and lowest cost iron ore assets in the world. This is reflected in EBITDA growth outpacing sales growth through the first half of 2021, coming in at 109% compared to sales growth of 89% in the face of cost pressures and global supply chain disruptions.
Between 2018 and 2020, sales in the aluminum and copper businesses contracted by 24% and 25%, respectively. I have highlighted these segments in yellow in the above tables. Notice that these metals put in a bottom in 2020 and are staging a powerful rebound in 2021. Copper EBITDA is up an incredible 200% through the first half of 2021 compared to 2020 on a 91% sales increase. The aluminum sales rebound was substantial at 32% while EBITDA exploded by 108%. These two metals will be key growth drivers for Rio Tinto over the coming decade.
Iron Ore
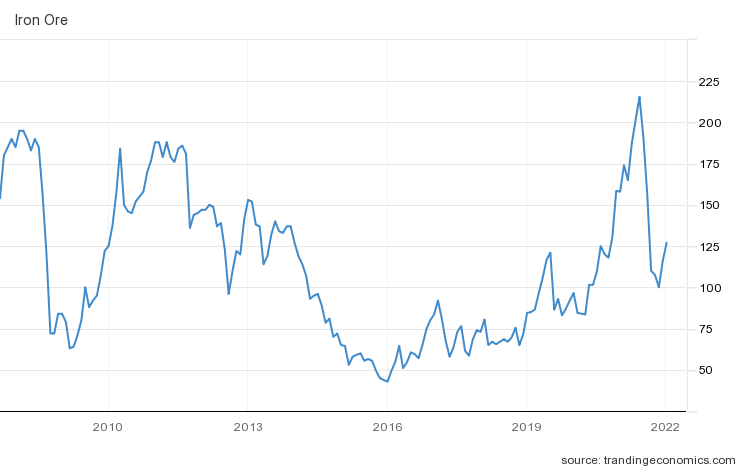
Rio Tinto’s incredible overall performance was driven by a powerful bull market in the price of iron ore. Iron ore increased 125% from the end of 2018 through the end of 2020. At the absolute peak in July 2021, iron ore was briefly up 213% compared to the end of 2018. The following chart from tradingeconomics.com provides a visual overview of iron ore prices over the past decade.
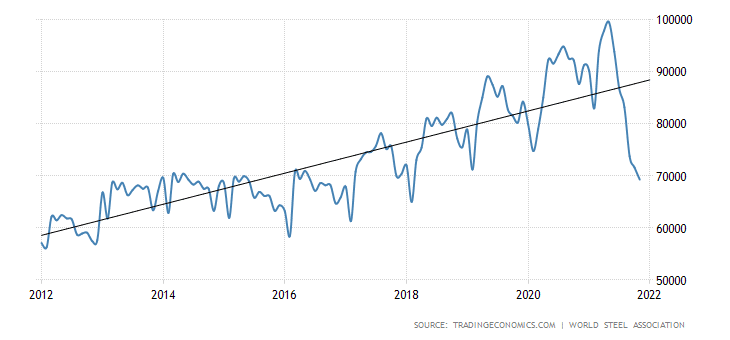
Iron ore was in a brutal bear market from 2011 through 2015 with prices down 79% from peak to trough. The period from 2016 through 2018 was defined by a stabilization in the market before the new bull market began in 2019. The primary driver of the new bull market has been Chinese steel production which can be seen in the following chart from tradingeconomics.com.
Source: tradingeconomics.com / World Steel Association
Steel production in China stagnated from 2013 through 2017 before breaking out to the upside in 2018. The powerful effect of Chinese demand on iron ore prices is self-evident and presents both the greatest opportunity and greatest risk for Rio Tinto. Notice that Chinese steel production turned materially lower after peaking in the middle of 2021.
The spike in the price of iron ore to an all-time high near $216 per ton created an economic disincentive for steel production. By some estimates, every $10 spike in the price of iron ore costs Chinese steel producers an additional $10 billion as China imports 80% of its iron ore demand. Another factor at play in the short term is China’s desire to reduce emissions and improve air quality for the upcoming 2022 Winter Olympics in Beijing.
Levered to Asian Demand
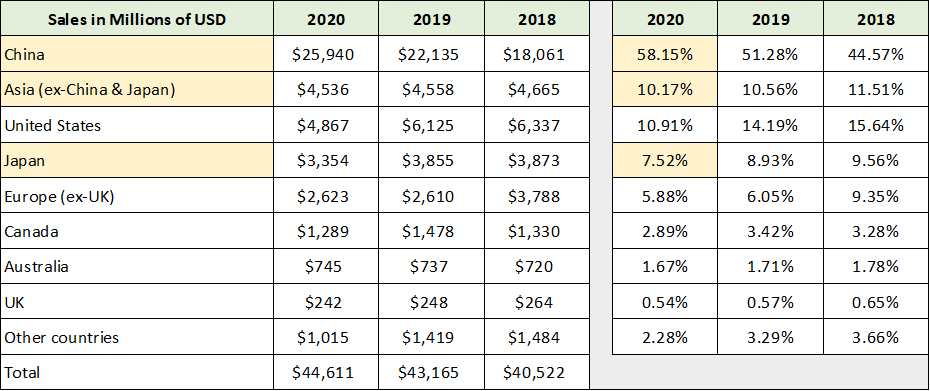
Rio Tinto offers one of the highest exposures to Chinese and Asian industrial demand in the equity market. The following table was compiled from Rio Tinto’s Annual Report 2020 and provides an overview of sales by region. Sales to the Asia Pacific market (highlighted in yellow) account for 76% of total revenue. The Asia Pacific region is the manufacturing center of the world and thus offers the highest growth potential for iron ore and industrial commodities generally.
Source: Created by Brian Kapp, stoxdox
Given China’s 58% share of Rio Tinto’s revenue and its competitive positioning at the core of the world’s industrial supply chain, the greatest risk facing the Rio Tinto investment case is Chinese trade tensions. The following passage from Rio Tinto’s Annual Report 2020 summarizes the situation well (emphasis added):
Tensions between the United States and China have become more structurally ingrained… Still, the economies of the United States and China remain closely intertwined and, despite growing talks of decoupling, this new era of competition will be shaped as much by how and where both countries agree to co-operate.
China’s competitive advantage is its ability to execute industrial projects at scale in a condensed time frame. This ability enables higher global economic growth than would otherwise be possible via increased productivity. China’s industrial capabilities are likely to remain advantageous for all members of the global economy. As a result, it is reasonable to expect China to continue to be the leading industrial producer going forward, which bodes well for Rio Tinto.
China’s Belt and Road Initiative or BRI best encapsulates Rio Tinto’s growth opportunity in Asia as well as the geopolitical tensions. The following excerpt from a January 2020 Council on Foreign Relations article, “China’s Massive Belt and Road Initiative” by Andrew Chatzky and James McBride, highlights the growth opportunity (emphasis added).
China’s Belt and Road Initiative sometimes referred to as the New Silk Road, is one of the most ambitious infrastructure projects ever conceived… (The Asian Development Bank estimated that the region faces a yearly infrastructure financing shortfall of nearly $800 billion.)… To date, more than sixty countries—accounting for two-thirds of the world’s population—have signed on to projects or indicated an interest in doing so.
Western governments are rightfully concerned about China’s rapidly expanding geopolitical influence. That said, the economic reality is that China is the only country capable of executing on the industrial production requirements of the world at scale. The differences between China and the West lie in the financing and geopolitical aspects of the Belt and Road concept rather than in whether or not it should or will happen.
Global Growth Opportunity
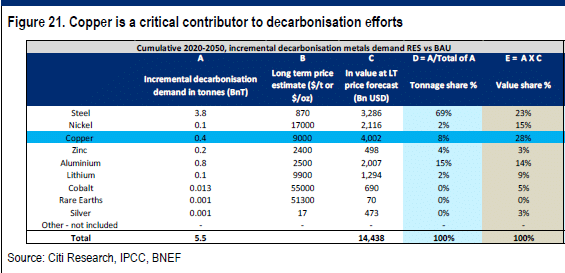
As a result, the coming global infrastructure boom and energy transition are highly likely to feature China at the core of global industrial production. The following table from Citi Research’s Copper Book: 2021-2030 Outlook highlights the growth opportunity for industrial metals resulting from the global energy transition.
While the Citi Research report focuses on the incredible growth opportunity for copper, it also highlights the larger opportunity for Rio Tinto emanating from incremental steel (iron ore) and aluminum demand as a result of global decarbonization. The most important columns are the final two on the right.
Steel (iron ore) is projected to make up 69% of the incremental total metal tonnage demand from global decarbonization policies. This may appear unusual at first glance; however, green energy technologies are surprisingly steel-intensive. The following quote from ArcelorMittal’s website offers a glimpse into this reality. ArcelorMittal (NYSE:MT) is the world’s second largest steel producer.
Steel will play an important role in all renewables, including and especially solar and wind. Each new MW of solar power requires between 35 to 45 tons of steel, and each new MW of wind power requires 120 to 180 tons of steel.
Steel is slated to comprise 23% of the incremental metal value created by decarbonization plans. The average annual incremental steel value is estimated to be $110 billion. Rio Tinto’s second and third largest business lines are aluminum and copper which account for 14% and 28% of the estimated incremental value creation from decarbonization demand. The average annual incremental aluminum and copper value opportunity is forecasted to be $67 billion and $133 billion, respectively.
Please keep in mind that these estimates are for incremental demand from decarbonization between 2020 and 2050. This is in addition to baseline demand which closely tracks global GDP growth. Prior to the 2021 iron ore price spike to all-time highs, Rio Tinto’s annual sales averaged $42 billion between 2017 and 2020. The additional $300 billion plus of annual revenue opportunity for Rio Tinto’s key industrial metals is an extraordinary growth opportunity. Also note that this is prior to accounting for material growth opportunities in other metals such a lithium. For example, Rio Tinto is on track to become the largest lithium producer in Europe with first production slated for 2026 from its high-quality Jadar project in Serbia.
The Commodities
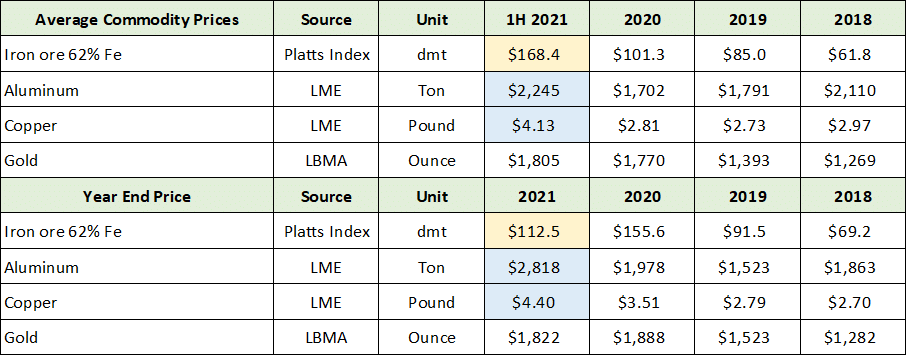
The growth outlook for Rio Tinto’s primary commodities is robust given the incremental demand from the global infrastructure buildout and energy transition. These metals comprise the majority of the investment case for Rio Tinto and will be viewed separately below in building the investment case. To set the stage, the following table summarizes key commodity prices since 2018. It was compiled from Rio Tinto’s Annual Report 2020 and Half Year Results 2021 as well as publicly available metal prices. Please note that dmt stands for dry metric ton.
Source: Created by Brian Kapp, stoxdox
Iron Ore: Core Business
Through the middle of 2021, the iron ore business was running at an annualized EBITDA rate of $32 billion compared to a current enterprise value of $123 billion. If this performance were sustainable, Rio Tinto would be trading at a deep discount to fair value. The average iron ore price in the first half of 2021 was $168 per ton compared to the current price of $126 per ton.
In reviewing Rio Tinto’s sustainable iron ore business, I have chosen to exclude the incredible performance in 2021 resulting from the spike in iron ore prices discussed previously. This approach is appropriate in light of the iron ore market returning to a more balanced supply and demand situation after the COVID supply disruptions.
Consensus iron ore price forecasts through 2025 reflect expectations for the market to stabilize at the upper end of the trading range between 2016 and 2020. The following table is from “Iron ore price rally is over, prices to follow multi-year downtrend — report” on mining.com, and displays the consensus iron ore price estimate for each year as well as Fitch estimates (which are more bearish).
I have highlighted in yellow what I believe to be the best forecast for iron ore prices through 2025 using consensus analyst estimates supplied by Bloomberg. The Fitch forecast is included to emphasize the potential downside risks and the generally subdued outlook for iron ore prices.
The central forecast tendency toward the mid-$80 range through 2025 looks like an appropriate baseline expectation going forward. Given that this forward price estimate is at the top end of the trading range between 2016 and 2020, it is likely to be a strong support zone for iron ore prices. As a result, Rio Tinto’s iron ore performance in recent years offers a high confidence estimate of sustainable iron ore earnings. The following table was compiled from Rio Tinto’s Annual Report 2020 and details its iron ore earnings between 2018 and 2020.
Source: Created by Brian Kapp, stoxdox
I have highlighted in yellow Rio Tinto’s 2019 iron ore earnings and the average iron ore price for 2019. The $9.6 billion of iron ore earnings in 2019 at an average iron ore price of $85 is an excellent sustainable earnings estimate given the iron ore price forecast. Using the consensus estimates as a baseline price for iron ore allows for upside surprises emanating from the global energy transition and the various Belt and Road initiatives.
Iron Ore: Valuation
I have selected a leading comparable iron ore producer for a relative valuation approach to Rio Tinto’s iron ore operations. Vale S.A. (NYSE:VALE) is one of the world’s largest iron ore producers and is the closest pure iron ore comparable for Rio Tinto. The iron ore production profile for each company is nearly identical. Vale is currently valued at 12.5x its 2019 normalized earnings estimate. This approach places a $74 valuation on Rio Tinto’s iron ore business (highlighted in blue in the above table).
Please keep in mind that Rio Tinto’s iron ore operations carry substantially lower ecological and social risk than Vale’s operations. Vale’s primary mine assets are located in ecologically sensitive regions in Brazil, as evidenced by its two major tailings dam failures in 2015 and 2019. As a result, I view the comparable Vale valuation approach as an excellent conservative estimate for the value of Rio Tinto’s operations in the Pilbara region of Australia. Nonetheless, with Rio Tinto trading in the $74 range today, this rough estimate of the iron ore business appears to account for much of Rio Tinto’s current valuation.
Importantly, I also view 12.5x the sustainable iron ore profitability of Rio Tinto as a very conservative valuation relative to the broad equity markets. Broad US equity markets, for example, are trading between 22x and 38x trailing earnings (Dow Jones Industrial Average: 22x, S&P 500: 29x, Nasdaq 100: 38x). There is significant upside potential from multiple expansion alone with Rio Tinto trading at 7x the 2022 consensus earnings estimate.
Copper: Future Growth
While Rio Tinto is best known for its iron ore business, the company has created a formidable copper portfolio of world class assets. For example, Rio Tinto owns a 30% interest in the world’s largest copper mine, Escondida in Chile. Rio Tinto owns 55% of the Resolution Copper mine in Arizona. If brought online, the Resolution Copper mine could produce 25% of the United States’ annual copper demand for forty years. In Mongolia (next door to China) Rio Tinto owns 34% of the Oyu Tolgoi mine which is capable of producing an estimated 1 billion pounds of copper per year and would place it in league with the world-leading Escondida mine. Finally, the company owns the Kennecott copper mine in Utah, which is the world’s deepest open pit mine. It has produced since 1906 and has been upgraded for at least another decade of production.
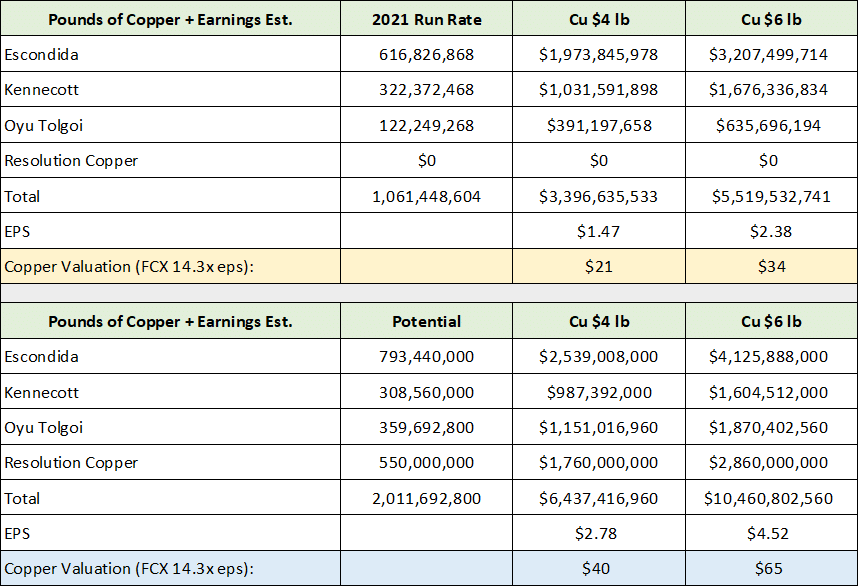
The following table summarizes Rio Tinto’s current and potential copper production and several earnings estimates for the copper business. The potential copper production in the lower section looks to be achievable in the second half of the current decade. The data was compiled from Rio Tinto’s Annual Report 2020 and Turquoise Hill Resources’ (NYSE:TRQ) Third Quarter 2021 Financial Results, and are solely my estimates based on the available information. Rio Tinto owns its Oyu Tolgoi interest via 50.8% ownership of Turquoise Hill Resources.
Source: Created by Brian Kapp, stoxdox
I have taken the same comparable approach to copper as was done with iron ore. For copper, I have selected Freeport-McMoRan Inc (NYSE:FCX) as the best comparable company given that it trades as a copper bellwether and is most similar jurisdictionally. Additionally, Freeport-McMoRan has a strong copper growth profile which improves its use as a comparable copper company for Rio Tinto. Freeport-McMoRan is currently valued at 14.3x the 2021 consensus earnings per share estimate.
To arrive at estimates of Rio Tinto’s copper earnings potential, I assume a $4 and then a $6 per pound copper price, while applying the top end of Rio Tinto’s 2021 per unit copper cost estimate of $.80 per pound. At the current production run rate, Rio Tinto’s copper business valuation is estimated at between $21 and $34 per share. Looking to future production potential, the valuation rises to between $40 and $65 per share. Given that the current share price appears to only account for the iron ore business, these estimates represent pure upside potential.
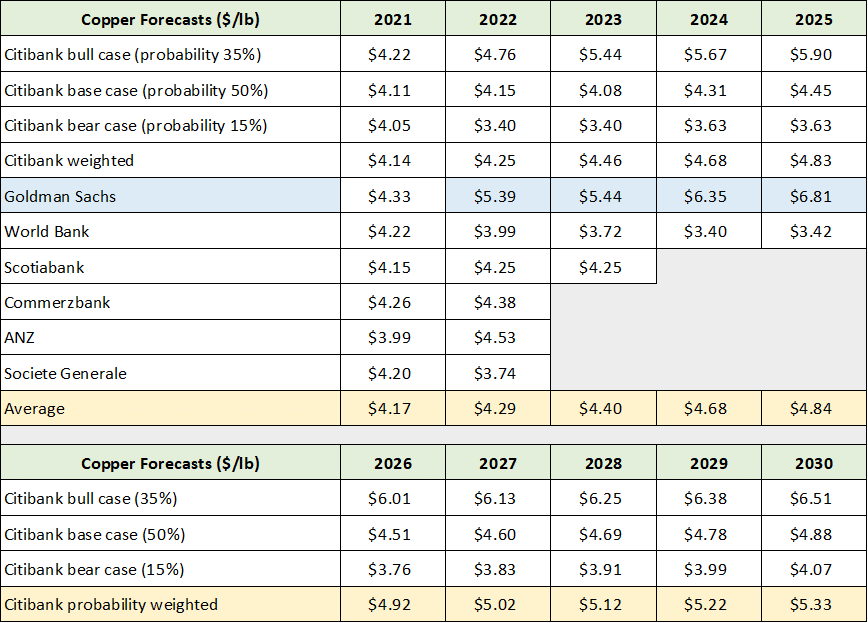
My choice of $4 and $6 per pound for the price of copper is well supported by analyst estimates and is reinforced by current projections for a potential copper supply shortfall near mid-decade. The following table provides a breakdown of the copper price estimates used for this analysis. The data was compiled from Citi Research’s Copper Book: 2021-2030 Outlook and “Copper price forecast: Will it surpass its all-time high?” by Nicole Willing on capital.com.
Source: Created by Brian Kapp, stoxdox
I have highlighted the summary price forecasts in yellow which offer an excellent baseline estimate through 2030. The Goldman Sachs forecast through 2025 offers a reasonable upside scenario as the copper supply and demand balance is tenuous given the explosion in alternative energy (highlighted in blue). Copper is the top beneficiary of the coming energy transition.
Aluminum: Future Growth
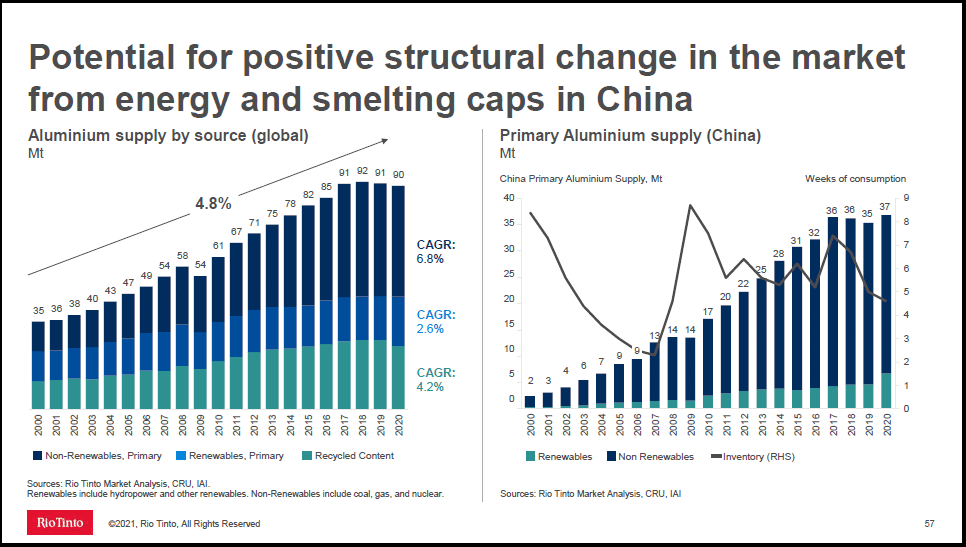
The aluminum market is undergoing the most bullish structural change in decades. China has halted aluminum supply growth which has been stagnant since 2017 as can be seen in the following slide from Rio Tinto’s October 2021 Investor Seminar. This seismic shift is creating a more economically robust supply dynamic for the global aluminum market and is likely to support higher prices over the intermediate term.
Source: Rio Tinto’s October 2021 Investor Seminar
Aluminum prices have responded strongly to this structural change and are currently up 75% from the average price during 2019 and 2020. At $2,964 per ton, aluminum is fast approaching the all-time high price of just over $3,100 first reached in 2006 and again in 2008. Given that the majority of China’s aluminum supply is powered by burning coal, it is highly likely that this structural supply constraint will remain in place given emissions targets and trade disputes. This is incredibly bullish for Rio Tinto’s aluminum operations.
Rio Tinto operates one of the most efficient aluminum businesses in the world from a carbon footprint perspective. With carbon prices skyrocketing and carbon increasingly becoming a cost, Rio Tinto has a competitive cost advantage. The global aluminum industry is powered 60% by coal. As the cost of these coal operations continues to increase, they will place upward pressure on aluminum prices. Rio Tinto should experience substantially higher profit margins as a result.
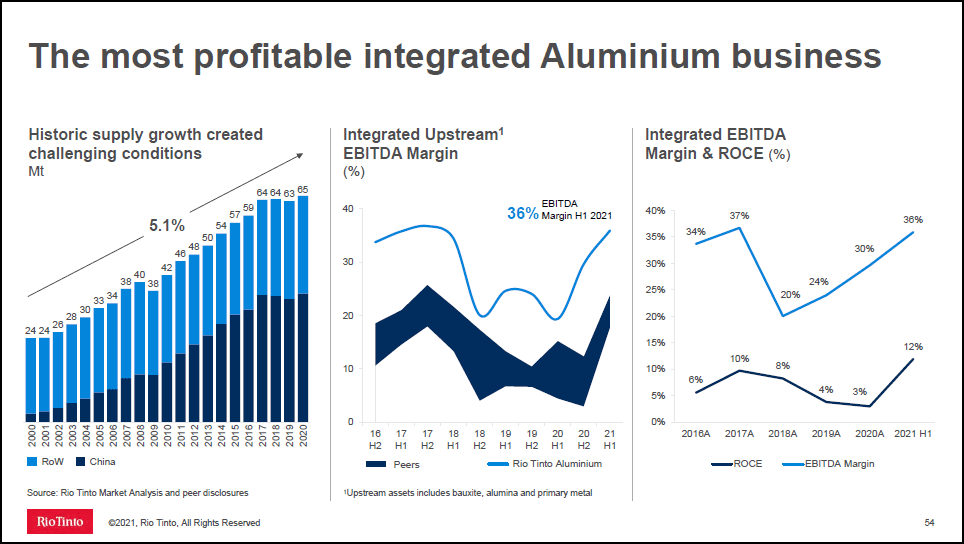
In fact, from a profitability perspective, Rio Tinto produces a peer-leading EBITDA margin which is currently at 36%. The following slide from the same investor presentation summarizes the profitability situation. For reference, Alcoa (NYSE:AA) produced 20% adjusted EBITDA margins in the first half of 2021.
Source: Rio Tinto’s October 2021 Investor Seminar
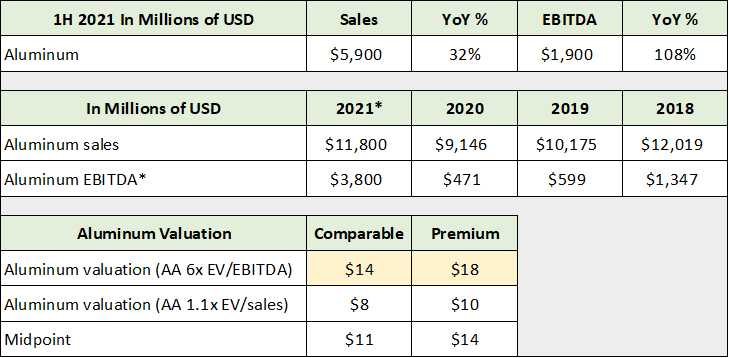
I view Alcoa as an excellent comparable company for Rio Tinto’s aluminum business. They are roughly the same size from a revenue perspective. In the table below, I have annualized Rio Tinto’s first half 2021 results which are displayed in the upper portion of the table below (2021* represents the annualized estimates). The data was compiled from the company reports used thus far.
Source: Created by Brian Kapp, stoxdox
I have highlighted in yellow what I believe to be the best valuation estimate. In each column I apply Alcoa’s current valuation on EBITDA (6x) and sales (1.1x) to that of Rio Tinto’s aluminum business. In the premium column I apply a 25% valuation premium to the comparable column. I view the premium valuation scenario as reasonable given Rio Tinto’s superior profitability.
Valuation Summary
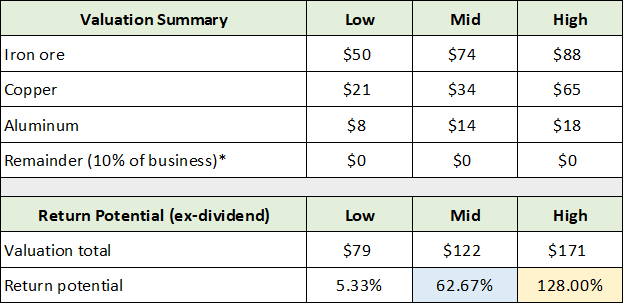
In the following table I have summarized the comparative valuations arrived at in reviewing Rio Tinto’s three primary business lines. I have chosen to disregard all other business lines and treat them as additional margin of safety. While meaningful operations, they account for only 10% of the business. As a result, they do not move the needle materially from a valuation perspective. It is important to note, however, in that they are valuable and provide further downside support for the shares.
Source: Created by Brian Kapp, stoxdox
I have highlighted in blue what I believe to be a very reasonable estimate of near-term return potential, ignoring the dividend. It is important to keep in mind that the current dividend yield is 9% and is additive to the above estimates. The yellow highlighted cell is a reasonable estimate looking out three years, which the dividend payment would further amplify.
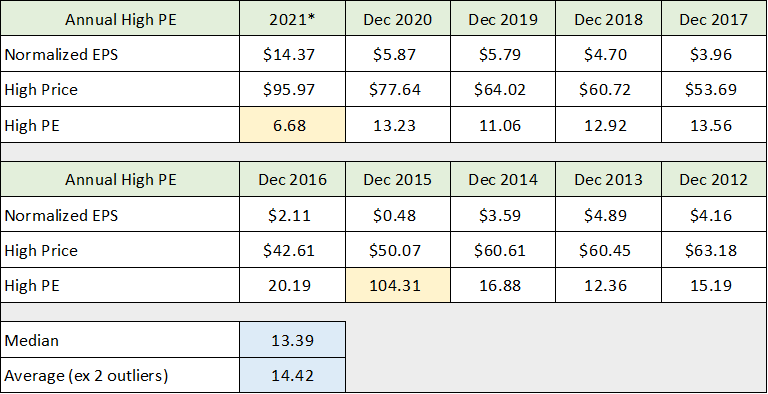
Looking at Rio Tinto’s historical valuation offers further support for the upside return potential calculated above. In the following table I have compiled the high PE ratio each year for Rio Tinto based on its normalized earnings per share which were compiled from Seeking Alpha. The critical information is highlighted in blue while the outliers are highlighted in yellow.
Source: Seeking Alpha. Created by Brian Kapp, stoxdox
The median and average historic PE ratio for Rio Tinto strongly supports a valuation of 13x to 15x earnings. In the following table I apply the historical PE multiples to the consensus earnings estimate for 2022 which was compiled from Seeking Alpha. Please keep in mind that iron ore prices near $100 should be well ingrained in the 2022 consensus earnings estimate at $10.41 per share.
Source: Seeking Alpha. Created by Brian Kapp, stoxdox
The price targets and return potential from applying the historic PE multiples are shown in the lower half of the table. The 86% to 100% return estimate fits perfectly inside the 63% to 128% return range arrived at in the sum-of-the-parts relative valuation approach above.
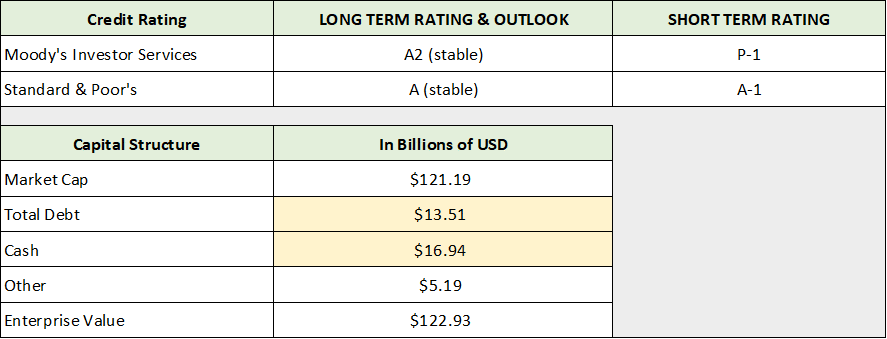
The return estimates above assign no premium for quality outside of the aluminum business. Nonetheless, it is an important piece of the value proposition and offers further margin of safety. As can be seen in the following table, Rio Tinto is a very high-quality company. The long-term credit rating is in solid investment grade territory while the short-term credit rating is the highest possible. This is important because Rio Tinto has access to global capital markets which materially lowers the cost capital thereby increasing the potential return on equity. Quality may be increasingly important in the coming cycle. The capital structure information was compiled from Seeking Alpha.
Source: Seeking Alpha. Created by Brian Kapp, stoxdox
Technicals
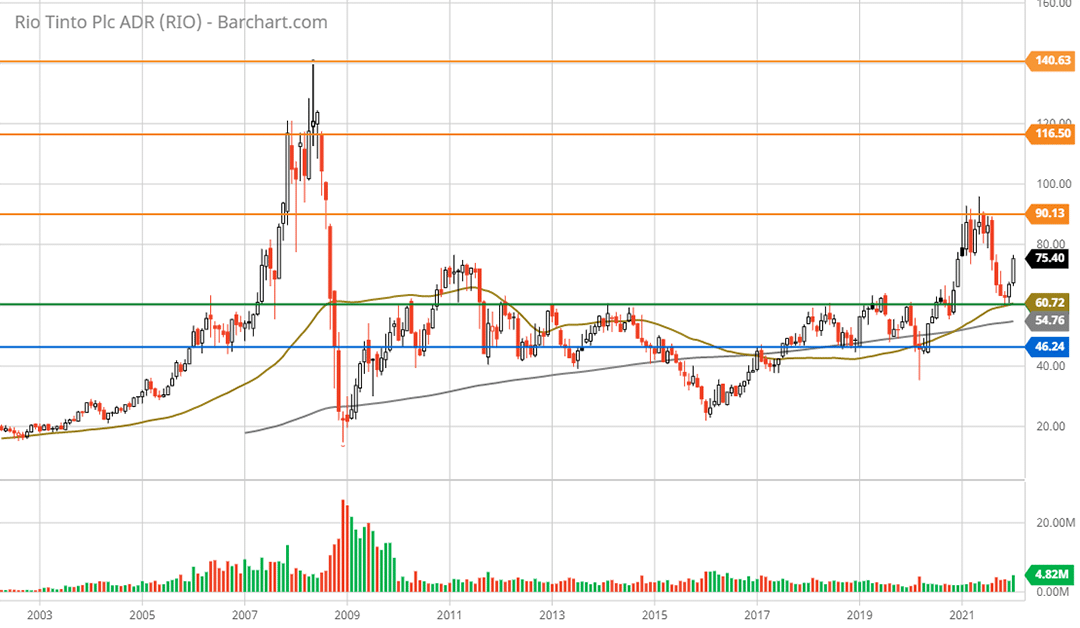
Rio Tinto’s technical backdrop is best described as strong long-term support with upside potential to the price targets arrived at in the fundamental valuation discussion. The strong support zone is highlighted by the green and blue horizontal lines on the 20-year monthly chart below.
Rio Tinto 20-year monthly chart. Created by Brian Kapp using a chart from Barchart.com
The decade-long inverse head and shoulders pattern suggests a major bottom is in place with incredibly strong support near the green line at $60. This represents 20% downside from current levels and is in the realm of possibilities given short term dynamics. I view this level to be very well-supported.
Upside resistance levels are highlighted by the orange horizontal lines. The return potential to each level is as follows: 20% ($90), 55% ($116), and 87% ($140). The 55% to 87% technical return potential aligns well with the 63% to 86% arrived at as the midpoint projections in the fundamental discussion.
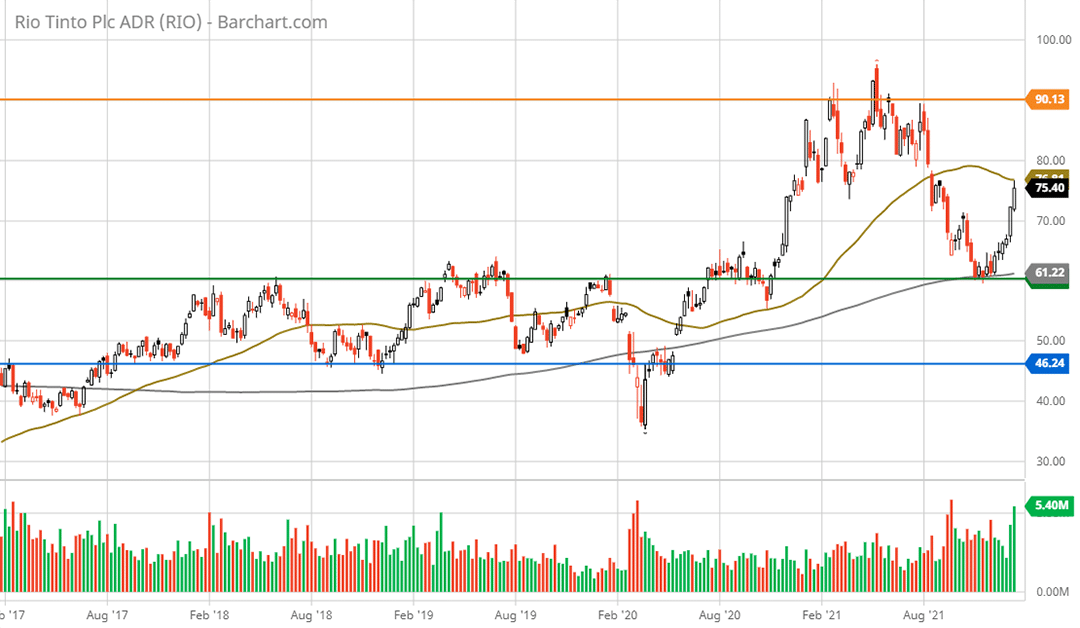
Zooming into the 5-year weekly chart below, things begin to look more bullish technically.
Rio Tinto 5-year weekly chart. Created by Brian Kapp using a chart from Barchart.com
Rio Tinto has clearly broken out of the sideways consolidation pattern and is rallying strongly off the long-term support level. The lack of technical overextension combined with incredibly strong long-term support nearby creates an excellent accumulation zone from a technical perspective.
Summary
With what looks to be a solid support base at $60, Rio Tinto offers an incredibly asymmetric risk/reward profile considering its 100% plus price appreciation potential and current 9% dividend yield. The coming global infrastructure and energy transition boom is highly likely to support robust industrial metals markets over the coming decade. As a result, Rio Tinto is a top choice for global growth.
Price as of report date 1-18-22: $75
Rio Tinto Investor Relations Website: Rio Tinto Investor Relations

