Risk/Reward Rating: Negative
PayPal Holdings is a market leader in the digital payments industry serving both consumers and merchants. The PayPal platform includes core PayPal, PayPal Credit, Braintree, Venmo, Xoom, iZettle, and Hyperwallet products and services. Being the market leader has created lofty expectations which were not met in the second quarter sending the stock 6% lower on the earnings report.
Investors were likely disappointed by the forecast for the third quarter of 2021 in which the company projects flat to mildly lower revenue versus the just completed second quarter. The flat to lower quarterly forecast amounts to 13.5% growth over 2020 which was exceptionally strong due to the boom in online commerce during COVID. It should be noted that PayPal has consistently grown revenues by 18% per year on average and is forecasting growth for the full year of 2021 to be 20% including 19% in Q4 of 2021.
Adding to the concerns over slowing revenue growth for Q3 is the projection for earnings to be stagnant versus Q3 2020 on a non-GAAP (generally accepted accounting principles) basis and to decline on a GAAP basis after removing one-off investment gains from Q3 2020. Also disappointing is the 4% decline in cashflow and 7% decline in free cash flow through the first half of 2021 compared to 2020. The company chalks this up to increased cash tax payments in 2021 versus 2020 which saw historically rock bottom corporate tax rates.
All told, the current trends are in line with historical results including slower growth in the third quarter in prior years. As a result, there are no major red flags for the business at the moment. The primary concern regarding PayPal is the intense competition surrounding the payments space and the extraordinary valuation for a company as large as PayPal which sports a $332 billion market value.
On the valuation front, PayPal trades at 59x non-GAAP earnings estimates for 2021 and 48x estimates for 2022. The non-GAAP earnings estimates ignore a large employee stock-based compensation expense. On a GAAP basis, the company is valued at 80x 2021 earnings estimates. Additionally, PayPal is valued at 66x estimated free cash flow for 2021 and 13x estimates sales.
On all metrics, the current valuation is extreme versus historical market averages. Estimates for 2022 call for 23% earnings growth, however, this is already reflected in the current share price. Growth will become more difficult with each year given PayPal’s growing size (law of large numbers).
Competition will also challenge growth as everyone wants to become a payment provider nowadays. The list of competitors spans the spectrum from existing industry players like Visa and Mastercard to upstarts such as Square, Stripe, and the venture capital industry. Competitors also include technology behemoths like Apple and Google. It should be noted that payments are a primary use case for the booming cryptocurrency industry as well. This industry backdrop points toward intense competition and the likelihood of profit margin pressure that accompanies such competition.
In summary, PayPal is a great company that is fully priced leaving little on the table for new investors in terms of excess return potential. This opens the door to a heightened level of risk in the event of disappointment as was seen in the just completed second quarter. The extraordinary competitive landscape that is forming adds an additional layer of risk.
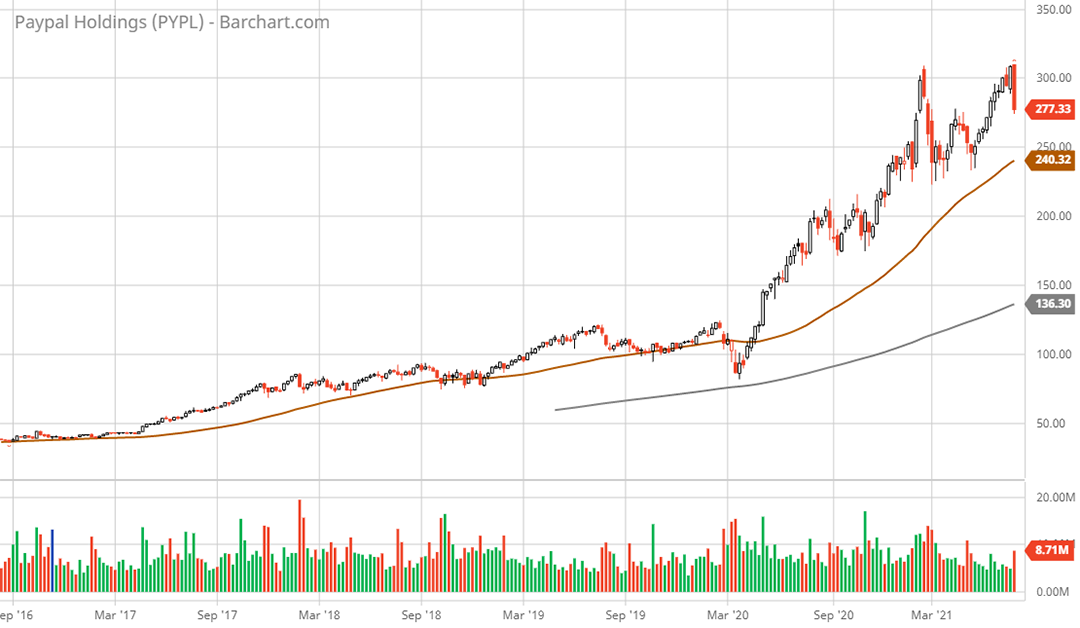
Technical backdrop: PayPal stock experienced a parabolic uptrend off the COVID crash bottom rallying from $85 to a peak of $310 in July 2021. The selloff after the Q2 earnings report this past week has created a double top (February and July 2021) and what is known as a bearish engulfing pattern on the weekly chart (when a stock achieves a new high and then takes out the prior weekly low). In fact, at the time of this report the weekly reversal is taking out the last six weeks of gains. The 50-week moving average (brown line on the 5-year weekly chart) stands at $239 which has been the weekly support level throughout 2021. The next lower weekly support level is in the $206 area which served as resistance during the second half of 2020.
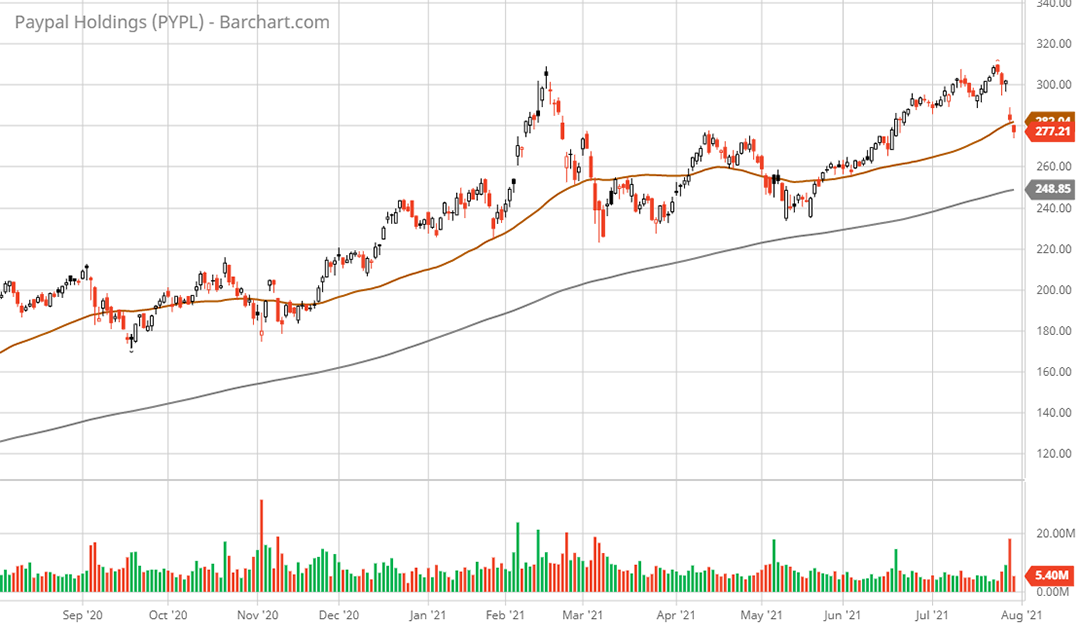
Zooming in to the daily chart, PayPal is currently testing support at the 50-day moving average (brown line on the 1-year daily chart) at $282 which aligns with the resistance levels experienced in April 2021. The 200-day moving average (grey line on the 1-year daily chart) is at $248. Daily support has been found beneath here in the $230 area throughout 2021.
Technical resistance: At current levels up to the Q2 earnings report gap lower at $300.
Technical support: $240 and $205 are the support levels on both a daily and weekly basis. The next lower support level is in the $180 area.
Price as of report date 7-30-21: $280.24
PayPal Holdings Investor Relations Website: PayPal Investor Relations
All data in this report is compiled from the PayPal Holdings investor relations website and SEC filings, and where applicable publicly available information regarding consensus earnings estimates.


