
Risk/Reward Rating: Negative
UiPath (NYSE: PATH) reported its Q2 fiscal 2022 earnings after the market closed on September 7, 2021, sending the shares down 9.5% the following day. This was UiPath’s second quarterly report as a public company. Following the company’s first quarterly report after the market closed on June 8, 2021, an identical selloff of 9.5% occurred the following day. The company is batting 100% in terms of disappointing investors since its IPO on April 21, 2021.
For those unfamiliar with UiPath, the company’s slogan is: “We make software robots, so people don’t have to be robots.” In essence, UiPath creates software to automate business processes alleviating the need for manual intervention in the management of information. The company was founded in Romania in 2005 and incorporated in Delaware in 2015 before coming public. Of note, the stock is a large ‘innovation’ holding of Cathie Wood’s ARK Investment Management at the time of this article.
Troubling Revenue Trends
The large selloffs after UiPath’s first two quarterly reports as a public company are in reaction to several troubling trends. The primary concern relates to the company’s slowing revenue growth, and to the revenue mix in particular. The following Risk Factor from UiPath’s S-1 Registration Statement filed with the SEC prior to the IPO sets the stage for the primary revenue concern:
Our business depends on our existing customers renewing their licenses and purchasing additional licenses and products from us and our channel partners. Declines in renewals or the purchase of additional licenses by our customers could harm our future operating results.
UiPath reports revenue in three categories: licenses, maintenance and support (support), and services and other (services). The following tables were compiled using data from the company’s Q2 2022 10-Q quarterly report and S-1 filed with the SEC. I will begin with the overall revenue trend then analyze the revenue mix between the reporting segments. Please note that ‘YOY’ stands for year-over-year growth or growth compared to the same quarter in the prior year (annual), while ‘QOQ’ stands for quarter-over-quarter growth or growth from the preceding quarter (sequential). All columns are for the fiscal year quarter (the company’s 2022 fiscal year ends on 1-31-22).
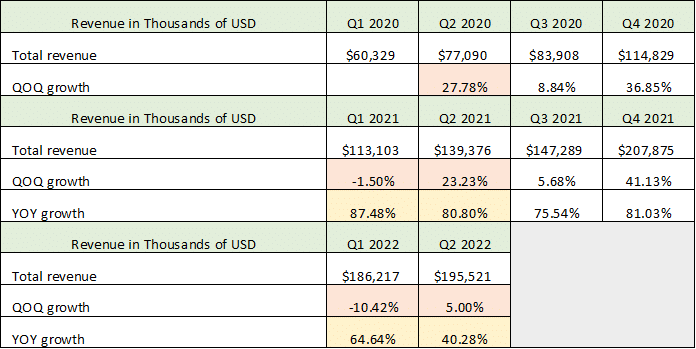
I will focus on Q1 2022 and Q2 2022 trends which are the first two quarterly reports filed as a public company. Orange highlights the quarter-over-quarter growth rates while yellow highlights the year-over-year growth rates. Beginning with the annual growth trends, revenue growth has decelerated rapidly to 40% in Q2 2022 from 65% in Q1 2022, and over 80% revenue growth in Q1 and Q2 of fiscal 2021 (calendar year 2020).
Turning to sequential growth, Q1 is historically a seasonally weaker period due to the concentration of year-end contract signings in Q4, while Q2 is normally a robust growth quarter sequentially. As can be seen in the Q2 column highlighted in orange, sequential growth has slowed rapidly to only 5% in Q2 2022 compared to 23% in Q2 2021 and 28% in Q2 2020. The seasonally weak Q1 was also much weaker than normal in Q1 2022, registering a 10% sequential revenue decline compared to a decline of 1.5% in Q1 2021.
License Revenue
Overall revenue growth is displaying a troublesome trend. This requires a look under the hood at the revenue mix between categories to discern the source of the weakness, starting with the all-important license revenue category (compiled using data from the Q2 10-Q and S-1 filed with the SEC).
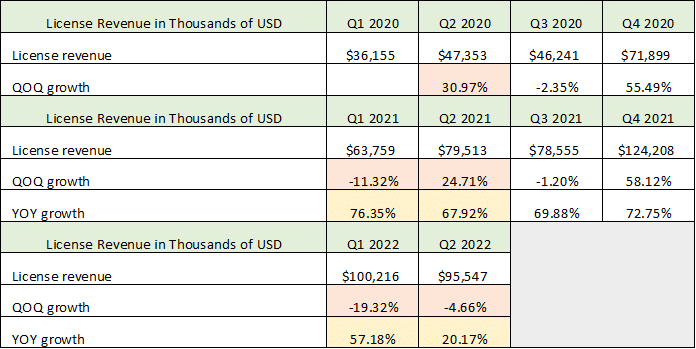
Focusing again on Q1 and Q2, orange highlights the sequential growth trends while yellow highlights the annual growth trends. Beginning with the annual growth trends, Q2 2022 registered an incredible deceleration to 20% annual growth from 68% in Q2 2021. This is also a rapid deceleration from the 57% annual growth reported in Q1 2022, which slowed from 76% growth in Q1 2021.
Turning to sequential growth, Q2 2022 actually registered a decline of nearly 5% from Q1 2022. Historically Q2 has been a robust license growth quarter sequentially (25% growth in Q2 2021 and 31% growth in Q2 2020). This follows a larger than normal sequential decline of 19% in the seasonally weak Q1 in 2022 compared to an 11% decline in Q1 2021. The annual license revenue growth deceleration combined with two quarters of sequential declines is the primary driver of the rapid revenue growth deceleration seen in the first table.
Licenses are a key part of UiPath’s business model as they are an indicator of the number of software ‘robots’ deployed and in use within the company’s customer base. The criticality of license sales is evidenced by the S-1 risk factor quote at the beginning of the revenue section above, and further punctuated by the following quote from UiPath’s S-1 filed with the SEC:
Part of our growth strategy relies on our ability to deliver significant value in a short time to our customers, so that our customers will scale the use of our platform throughout their enterprise. Accordingly, our future success depends in part on our ability to exhibit this value and sell additional licenses and products to our existing customers, and our customers renewing their licenses with us and our channel partners when the contract term expires.
Maintenance and Support Revenue
Growth in maintenance and support revenue is holding up much better than license revenue as can be seen in the following table (data compiled from UiPath’s Q2 10-Q and S-1 reports filed with the SEC). The table utilizes the same highlighting scheme (orange = sequential growth, yellow = annual growth).
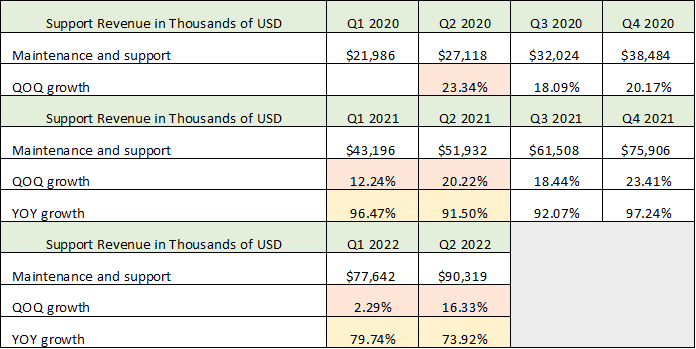
On an annual basis, growth remains robust at 74% in Q2 2022 and 80% in Q1 2022. The sequential revenue growth was very weak in Q1 2022 at 2% compared to 12% in Q1 2021 and rebounded somewhat to 16% sequential growth in Q2 2022. Bear in mind that the 16% sequential growth in Q2 2022 is coming off of a historically weak Q1 2022, lessening its impact.
When the license revenue weakness is combined with the more resilient support revenue, a ‘pause’ narrative begins to emerge. ‘Pause’ is my descriptor for these trends. Customers are reducing their licenses sequentially in the first two quarters of 2022 while maintaining support. This suggests UiPath’s customers require further clarification and guidance regarding the use cases and value-add potential of UiPath’s software licenses.
Gross Profit Deceleration
The ‘pause’ narrative is confirmed by the third revenue category: services and other (services). For this category, I will bypass the quarterly revenue numbers table (as was done above for total revenue, licenses, and support revenue) as services are an immaterial revenue source. Instead, I will focus on the cost of services revenue and the cost of support revenue and their impact on UiPath’s gross profit. The gross profit trend reinforces the ‘pause’ narrative that looks to be unfolding. The following table presents UiPath’s gross profit and was compiled using data from the Q2 10-Q and S-1 filed with the SEC for the same periods as the above tables, utilizing the same highlighting scheme (orange = sequential growth, yellow = annual growth).
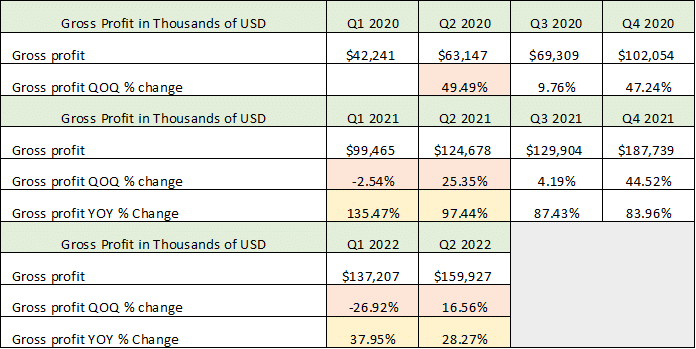
I will focus on the annual gross profit growth. On an annual basis, a rapid deceleration of gross profit growth is unfolding in the first two quarters of 2022. Q1 2022 slowed to 38% growth compared to 135% growth in Q1 2021. Likewise, Q2 2022 slowed further to 28% compared to 97% growth in Q2 2021.
These are incredible deceleration figures. Recall from the total revenue table (first table) that revenue growth in Q1 2022 was 65% compared to gross profit growth of only 38%, and revenue growth was 40% in Q2 2022 compared to gross profit growth of only 28%. Gross profit is decelerating much more rapidly than revenue pointing toward a rapid acceleration in the cost of revenue expense for UiPath.
The cost of revenue acceleration is a result of rapid increases in cost of services and support revenue. In the first half of 2022, these costs skyrocketed 215% compared to the first half of 2021. Essentially, UiPath is having to spend increasing amounts of money working with its sales partners and end customers on educating them as to the use cases and value proposition of UiPath’s software. UiPath relies heavily on third party partners to sell its software and services to their end customers (which includes thousands of partners such as the big accounting and business advisory firms).
This ‘pause’ narrative is evidenced by the declining sequential license revenue through the first two quarters of 2022, and the rapidly decelerating gross profit growth compared to the revenue growth rate. Final confirmation of a fundamental business ‘pause’ comes from the sequential gross profit figures in the above table.
Gross profit became wildly unstable in Q1 2022 declining an incredible 27% sequentially. While Q1 is sequentially weak due to contract signings being heavily weighted to Q4, a 27% sequential decline in Q1 2022 raises a red flag. The decline was only 2.5% in Q1 2021.
Gross profit stabilized sequentially by growing 17% in Q2 2022, however, this remains a rapid deceleration sequentially compared to Q2 in the prior two years (25% growth in Q2 2021 and 49% growth in Q2 2020). The 17% sequential gross profit growth in Q2 2022 is especially weak when viewed in the context of the unusual 27% sequential plunge in Q1 2022.
Valuation
With revenue and gross profit trends moving in the wrong direction, the valuation of UiPath takes on heightened importance for the share price and prospective shareholders. UiPath generated an operating loss of -$334 million through the first six months of fiscal 2022 and is not expected to be profitable in the foreseeable future. Additionally, the company produced negative -$23 million of cash flow from operations through the first six months of 2022. Both the operating loss and negative cash flow from operations are materially worse than in the first six months of 2021.
Given the operating loss and negative cash flow from operations, a valuation for UiPath must rely on revenue which is rapidly decelerating. Based on the company’s guidance of $208 million of revenue for Q3 2022, and annualizing this figure (x4), the current annual revenue run rate is $832 million. With a current market capitalization of $29.3 billion, the price-to-sales ratio is over 35x sales. This is extreme in a historical market context, and it is amplified by the negative revenue and gross profit trends in place as discussed above.
To place the valuation in a current relative context, the market averages today range from 22x to 32x expected earnings for the next twelve months (S&P 500: 22x, Nasdaq 100: 29x, and Russell 2000: 32x). Keep in mind the market averages are valuations on expected earnings rather than sales, as is the case for UiPath at 35x sales. As things stand, the valuation is extreme on all counts.
Annualized Renewal Run-Rate (ARR)
While not used here, UiPath focuses on Annualized Renewal Run-Rate as its primary business metric internally and when presenting to investors, as opposed to focusing on revenue, profitability, and cash flow. I chose to rely on the latter accepted and traditional business metrics as ARR can be problematic if the assumptions underlying the calculation are shown to be unreliable. Please see the note at the end of this report for the description of Annualized Renewal Run-Rate (ARR) as provided in the company’s S-1 registration statement filed with the SEC.
Other Notable Risk Factors
There are other risk factors identified by UiPath in the S-1 SEC filing that deserve mention. The company and its independent registered public accounting firm identified a material weakness in UiPath’s internal control over financial reporting in regard to revenue recognition for the year ended December 31, 2018. Since then, neither UiPath nor its independent registered public accounting firm have tested the effectiveness of the company’s internal control over financial reporting. This risk factor could become relevant given the recent instability in gross profits and revenue by category in 2022.
Additionally, UiPath’s Chairman, Co-Founder, and CEO controls over 88% of the voting shares. This means that he controls the company for all intents and purposes rather than public shareholders. Additionally, he may have a conflict of interest between serving as a fiduciary on behalf of all shareholders and serving his own personal interests as the largest shareholder.
Finally, there was a lockup period for existing shareholders as part of the IPO which prevented them from selling their shares for a period of time after the IPO was completed. This lockup is now expiring which may lead to a significant increase in share sales and a materially higher share count in the public markets and could then exert pressure on the stock price. I will now turn to the technicals before summing things up to place this fundamental analysis into the context of UiPath’s share price behavior.
Technicals
Technical backdrop: UiPath came public on April 21, 2021, near $65 per share and has trended lower following a brief rally to $90. Given the short trading history, lack of valuation support, and the stock trading at all-time lows, technical analysis is limited in its application for UiPath stock today. What can be said is that $59 was lower support prior to the selloff following the Q2 2022 earnings report (blue horizontal line on the daily chart below) and should offer stiff resistance on any rally attempts. The green horizontal line at $65 represents the upper limit of the recent trading range as well as the IPO price level. Should UiPath overcome the $59 area, $65 is likely to serve as the ceiling for the stock price.
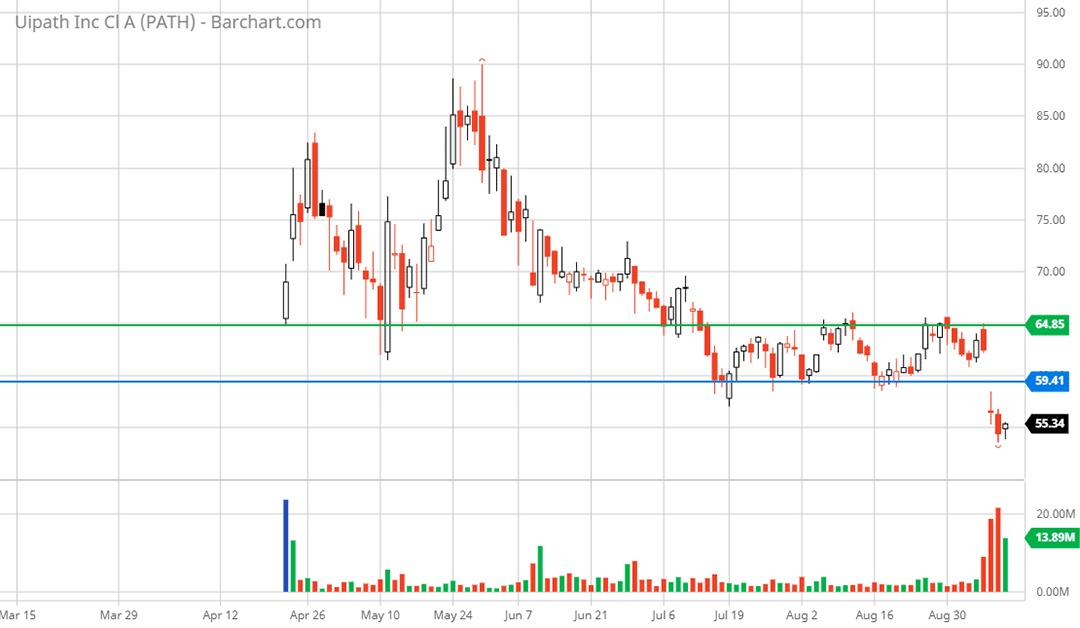
UiPath 6-month daily chart
Technical resistance: $59 should offer stiff resistance followed by $65.
Technical support: There is no support visible as UiPath is at all-time lows and the valuation is extreme.
Price as of this report 9-13-21: $55.10
Summary
UiPath operates in an interesting and exciting software sector, automation. The application of artificial intelligence and machine learning to automate business processes has a bright future. Whether UiPath will be a leader in the field remains to be seen as the company faces intense competition from well-established technology providers including a Who’s Who of the world’s blue-chip technology companies. Additionally, the underlying business trends suggest caution is in order regarding the shares.
The cautionary tale is punctuated by the extreme valuation at the current share price. The risks heavily outweigh the rewards. Given the exciting industry backdrop, UiPath deserves to be on the watch list for high-risk, high-reward growth-stock investors. A substantial share price decline coupled with improving revenue and gross margins trends could offer an attractive long-term investment opportunity.
Note: Annualized Renewal Run-Rate from UiPath’s S-1 Registration Statement
ARR is the key metric we use in managing our business because it illustrates our ability to acquire new subscription customers and to maintain and expand our relationship with existing subscription customers. We define ARR as annualized invoiced amounts per solution sku from subscription licenses and maintenance obligations assuming no increases or reductions in their subscriptions. ARR does not include the costs we may incur to obtain such subscription licenses or provide such maintenance, and does not reflect any actual or anticipated reductions in invoiced value due to contract non-renewals or service cancellations other than for specific bad debt or disputed amounts. For the fiscal years ended January 31, 2020 and 2021, our ARR was $351.4 million and $580.4 million, respectively, representing a growth rate of 65%. Approximately 30% of this growth rate was due to new customers and 70% of this growth rate was due to existing customers. In each of the fiscal years ended January 31, 2020 and 2021, our ARR was approximately 1.0x of our total revenue. Our ARR may decline or fluctuate as a result of a number of factors, including customers’ satisfaction or dissatisfaction with our platform and professional services, pricing, competitive offerings, economic conditions, or overall changes in our customers’ spending levels. ARR should be viewed independently of revenue and deferred revenue as ARR is an operating metric and is not intended to be combined with or replace these items. For clarity, we use annualized invoiced amounts per solution sku as compared to revenue calculated in accordance with accounting principles generally accepted in the United States, or GAAP, to calculate our ARR. Our invoiced amounts are not matched to the performance obligations associated with the underlying subscription licenses and maintenance obligations as they are with respect to our GAAP revenue. This can result in timing differences between our GAAP revenue and ARR calculations. Our ARR calculation simply takes our invoiced amounts per solution sku under a subscription license or maintenance agreement and divides that amount by the invoice term and multiplies by 365 days to derive the annualized value. In contrast, for our revenue calculated in accordance with GAAP, subscription license revenue derived from the sale of term-based licenses hosted on-premises is recognized at the point-in-time when the customer is able to use and benefit from our software, which is generally upon delivery to the customer or upon the commencement of the renewal term, and maintenance revenue is recognized ratably over the term of the arrangement. ARR is not a forecast of future revenue, which can be impacted by contract start and end dates, duration, and renewal rates, and does not include invoiced amounts reported as perpetual licenses or professional services revenue in our consolidated statements of operations. In addition, investors should not place undue reliance on ARR as an indicator of our future or expected results. Moreover, ARR may differ from similarly titled metrics presented by other companies and may not be comparable to such other metrics. See the section titled “Risk Factors—Risks Related to Our Business, Products, Operations, and Industry—Our key operating metric, ARR, and certain other operational data in this prospectus are subject to assumptions and limitations and may not provide an accurate indication of our future or expected results.”