Risk/Reward Rating: Negative
Netflix (NFLX) was a COVID winner in 2020 as the lockdowns drove new membership growth of over 20%, peaking in Q2 2020 at 27%. The question for Netflix is whether 2020 was as good as it gets for the business. It is hard to imagine a better operating environment for the company than locking down the world’s population. Membership growth has slowed rapidly in the first six months of 2021 falling to 13% in Q1 and only 8% in Q2. The company is forecasting 9% growth for Q3 of 2021.
The Netflix business model has been in question for much of its history given its recurring negative cash flow. In fact, 2020 was rare in that Netflix produced $2.4 billion of cash flow from operations and $1.9 billion of free cash after subtracting capital expenditures. The previous five years reflect the historical trend:

The trend has been one of increasing negative cash flows as Netflix has grown, driven by content acquisition costs and content creation expenses. The operating leverage Netflix gained with the massive membership additions in 2020 is unlikely to repeat. This is evidenced by the rapidly slowing membership additions so far in 2021. For the first six months of 2021, free cash flow has come in at $522 million which is a substantial decrease from the $899 million in the first six months of 2020.
Fresh content is a critical factor for future success in attracting and retaining membership. Given the wave of competition coming from content owners streaming directly to customers, such as Disney+, Netflix will have to ramp up investments in original content. On the content front Netflix has announced they are entering the gaming market. The gaming market is a crowded space and is likely to be a drag on cash flows in the near-term. Likewise, the content streaming space is becoming more crowded by the day which is likely to crimp pricing power and challenge membership acquisition and retention.
Netflix is currently valued at 122x 2020 free cash flow and 97x 2020 cash flow from operations. The cash outflows for content acquisition and creation are amortized for accounting purposes creating a more favorable valuation based on earnings per share (eps): 85x 2020 eps, 50x estimated 2021 eps, and 40x estimated 2022 eps. Earnings growth expectations are high for 2021 and 2022 creating a risk of disappointment. All told, these are high valuation multiples for a large cap stock with a market value of $234 billion. It should be noted that the company has accumulated $15 billion of long-term debt on its balance sheet.
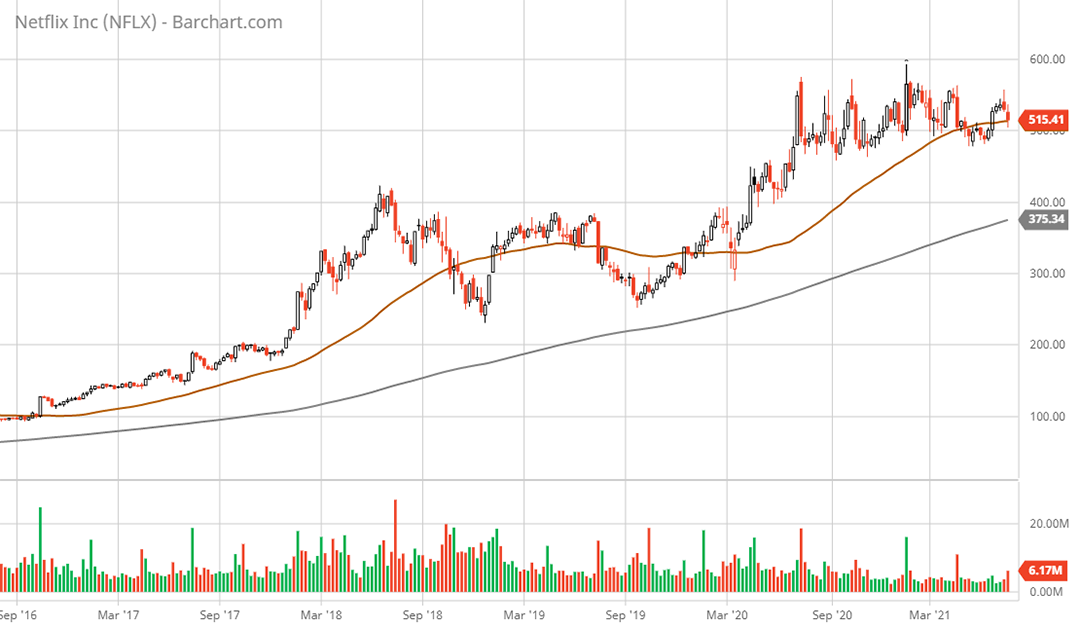
Technical backdrop: Netflix peaked out at $422 in June of 2018 and was in a correction until the onset of COVID, which breathed new life into the stock as a lockdown play. The stock peaked near $600 in January of 2021 coincident with the vaccine rollout and is currently testing the 50-week moving average (brown line in 5-year weekly chart).
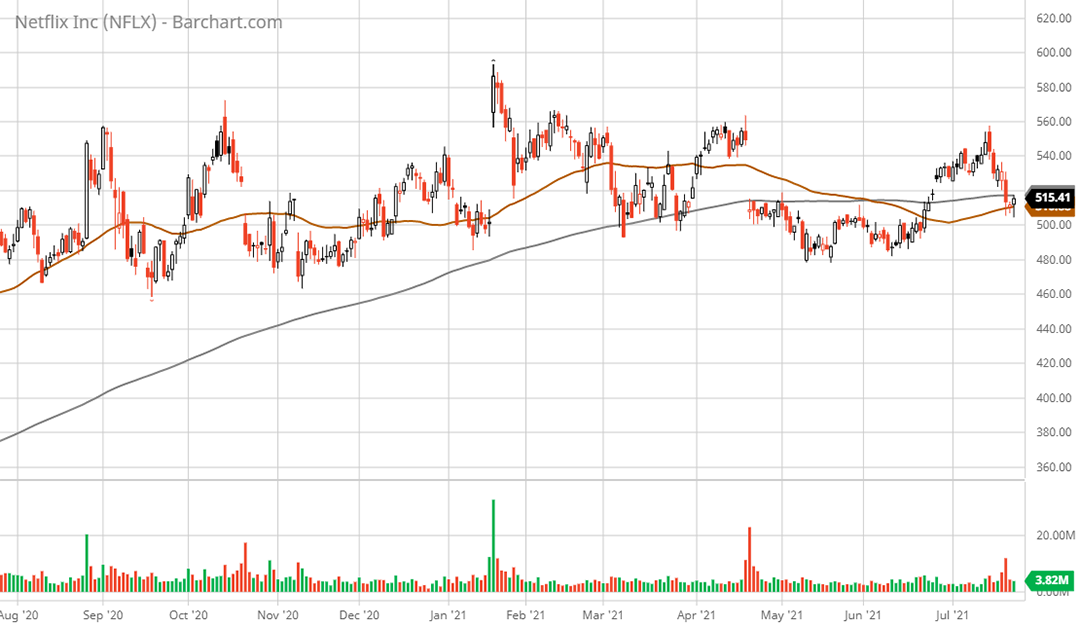
Upward momentum for the stock actually peaked back in July of 2020 and Netflix has been stuck in a sideways pattern ever since with $460 as the bottom and $600 as the top for the past year. An ominous ‘death cross’ technical pattern has since formed with the 50-day moving average (brown line on the 1-year daily chart) crossing beneath the 200-day moving average (grey line on the 1-year daily chart) on June 1, 2021. This suggests a downward trend is more likely in the near term.
Technical resistance: $550 area which is the gap lower on April 21, 2021, coincident with the disappointing Q1 earnings membership growth.
Technical support: The $480 area has served as support over the past year. Next lower levels are $450 and $400.
Price as of report date 7-26-21: $517.67
Netflix Investor Relations Website: Netflix Investor Relations
All data in this report is compiled from the Netflix investor relations website and SEC filings, and where applicable publicly available information regarding consensus earnings estimates.


