Netflix (NASDAQ:NFLX) has rallied over 60% since my May 4, 2022 report, “Netflix: Show me the money,” compared to a -3% decline for the S&P 500 index. As a result, it is an excellent time to review the Netflix investment case. The May report opened with the following:
I am assigning Netflix (NASDAQ:NFLX) a positive risk/reward rating based on its leadership position in the global streaming market, discounted valuation, above-average growth potential, and its deeply oversold technical position coinciding with an incredibly strong long-term support zone.
The question is whether these central tenants still hold or has the risk/reward asymmetry shifted?
- A Leadership position in the global streaming market.
- A discounted valuation.
- Above-average growth potential.
- Technically oversold and near long-term technical support.
Risk/Reward Rating: Neutral
While Netflix remains a leader in the global streaming market and still possesses above-average growth potential, The Walt Disney Company (NYSE:DIS) is now the streaming leader in total subscribers. This was outlined in my recent report “Has the magic returned to Disney?” Disney’s growing leadership position exemplifies the new reality facing Netflix, which is the most competitive and challenging industry conditions since the advent of streaming.
Valuation and Growth
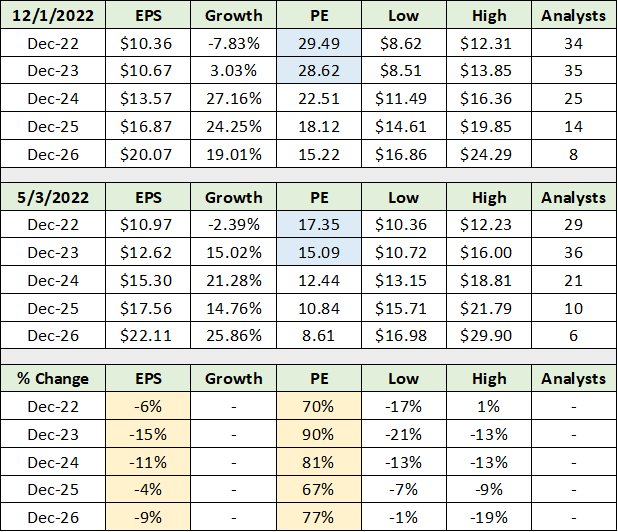
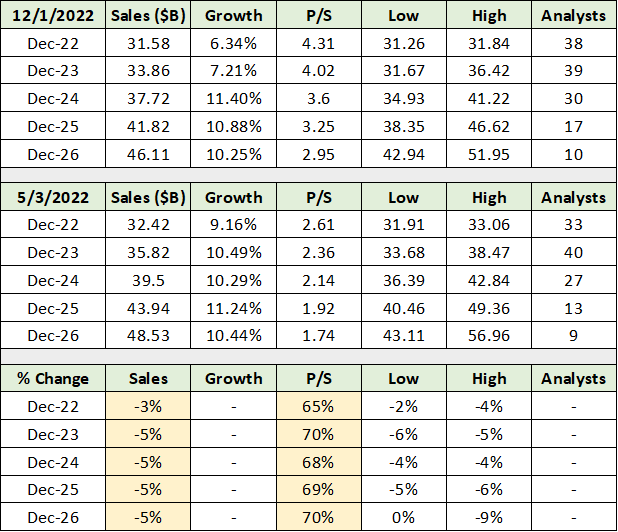
Turning to the question of Netflix’s valuation and growth potential, growth estimates have been reduced since the May report. The company’s earnings and sales estimates have been lowered while the valuation has moved substantially higher. The following two tables were compiled from Seeking Alpha and display consensus earnings and sales estimates as of December 1 compared to those as of the May report. The percentage change in estimates since May is in the lower section of each table.
I have highlighted in yellow the percentage changes to consensus earnings estimates over the past six months. Earnings estimates have trended materially lower with a reduction in the mid-teens for 2023 and low teens for 2024. The driver of Netflix’s 60% return can be found in the PE column. Netflix’s valuation multiple has exploded and is higher by 90% based on 2023 earnings estimates.
Consensus Sales
Downward revisions to sales estimates have been less extreme at -5%. This is somewhat concerning given that consensus sales estimates appeared rather conservative in May and pointed to the possibility of upside surprises. From the May report:
Importantly, consensus estimates now look to be rather conservative. I say this because there appears to be little, or no benefit factored in for the monetization of nonpaying users, and the embedded 5% pricing growth is well-below recent trends.
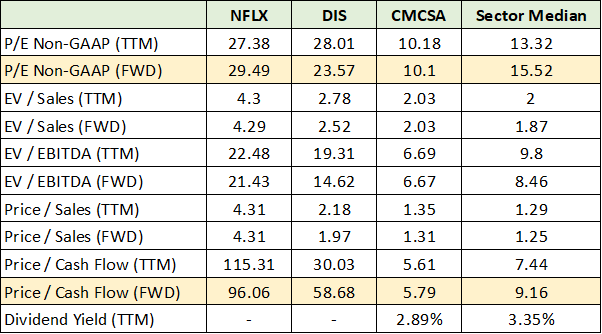
Negative revisions to conservative growth forecasts are not supportive of the extraordinary valuation multiple expansion over the past six months. Furthermore, Netflix’s valuation premium has become quite impressive compared to its communication services peers, as shown in the following table compiled from Seeking Alpha.
In the above table I compare Netflix’s valuation to the sector median, Disney, and Comcast (NASDQ:CMCSA). I include Disney as it is a sector leader and was flagged for its valuation compression risk in the last report. Comcast is included as it is a high-quality comparable company in the sector and provides a glimpse into the diverse opportunity set available in the group.
Netflix trades at a substantial premium to Disney on nearly all measures. The valuation premium is multiples of the sector median and Comcast across all metrics. I have highlighted in yellow what I view as the most important valuation metrics for Netflix going forward. From the May report:
On the profitability front, Netflix is a tale of two financial statements. From an income statement perspective, Netflix is rapidly growing its profitability… Looking at Netflix’s cash flow statement… Netflix has historically generated negative free cash flow with the exception of 2020.
The wide discrepancy between reported earnings and cash flow is often a red flag when viewing investment opportunities. Earnings and cash flow from operations should generally converge over time, with volatility between the two from year-to-year. If cash flow from operations consistently comes in well-below reported earnings, it is a sign that reported earnings may be of low quality. From the conclusion of the May report:
Whether the company can ultimately succeed in showing shareholders the money, positive free cash flow, remains to be seen.
While the case of Netflix’s missing cash flow remains an open question, this is decidedly not the case for Comcast, which is trading at just over 5x cash flow from operations and 10x earnings. Comcast will be covered in the next report as the deeply discounted valuation hints at an asymmetric risk/reward opportunity.
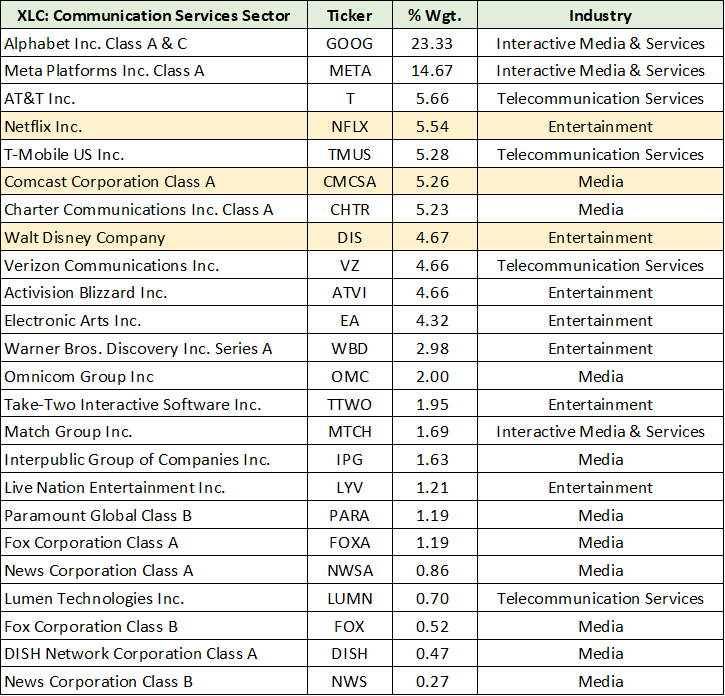
Interestingly, Comcast’s expected earnings growth is quite competitive with that of Netflix and Disney. The opportunity cost of holding Netflix today compared to holding other companies in the sector appears to be quite large. For reference, the full sector list from The Communication Services Select Sector SPDR® Fund (NYSE:XLC) is displayed below and was compiled from State Street Corporation.
Technicals
With the fundamental trends deteriorating for Netflix, the 60% move higher in its share price over the past six months is likely comprised of the following technical factors summarized below from the May report (emphasis added).
Netflix’s 50-day moving average is near $342 per share or 73% higher from current levels. The 200-day moving average stands near $512 or 152% higher. These figures speak powerfully to the oversold technical condition and the potential for an explosive countertrend rally.
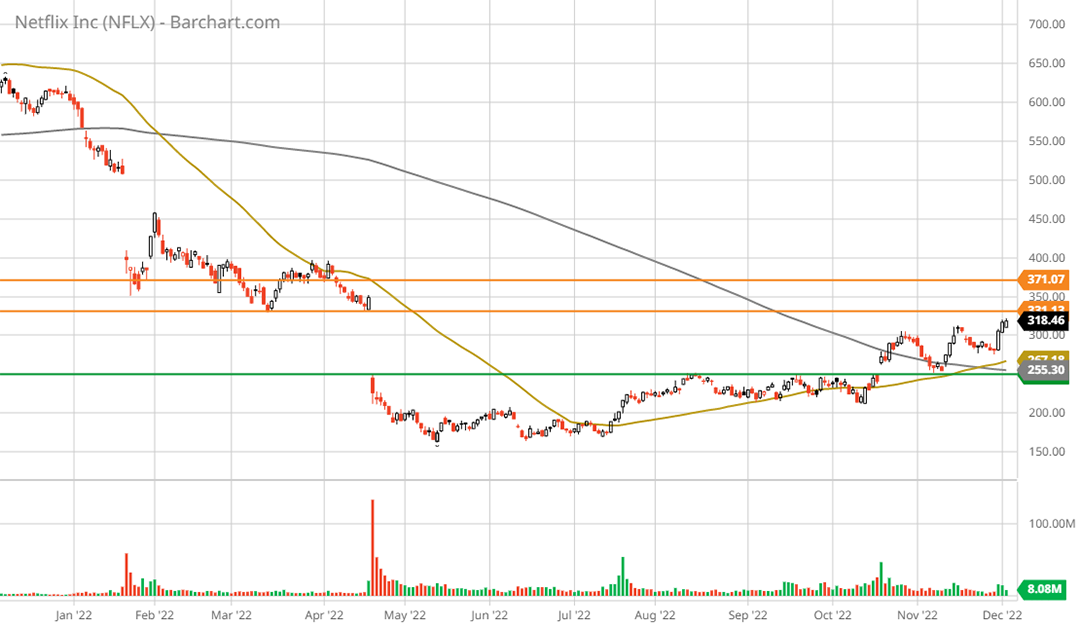
The following 1-year daily chart places the previous oversold condition into the current context. Note that the grey line is the 200-day moving average and the gold line is the 50-day moving average. Each moving average is in the $255 area today. Netflix was trading 73% below its 50-day moving average in May and is now 25% above it. The share price was 152% below the 200-day moving average in May and is now 25% above it.
I have outlined the primary resistance zone with orange horizontal lines. The zone between $330 and $370 should elicit significant overhead supply from many of the dip buyers between Q1 and Q2 2022. A contributing resistance factor, as outlined above, is that Netflix’s valuation has exploded and is many multiples of the sector.
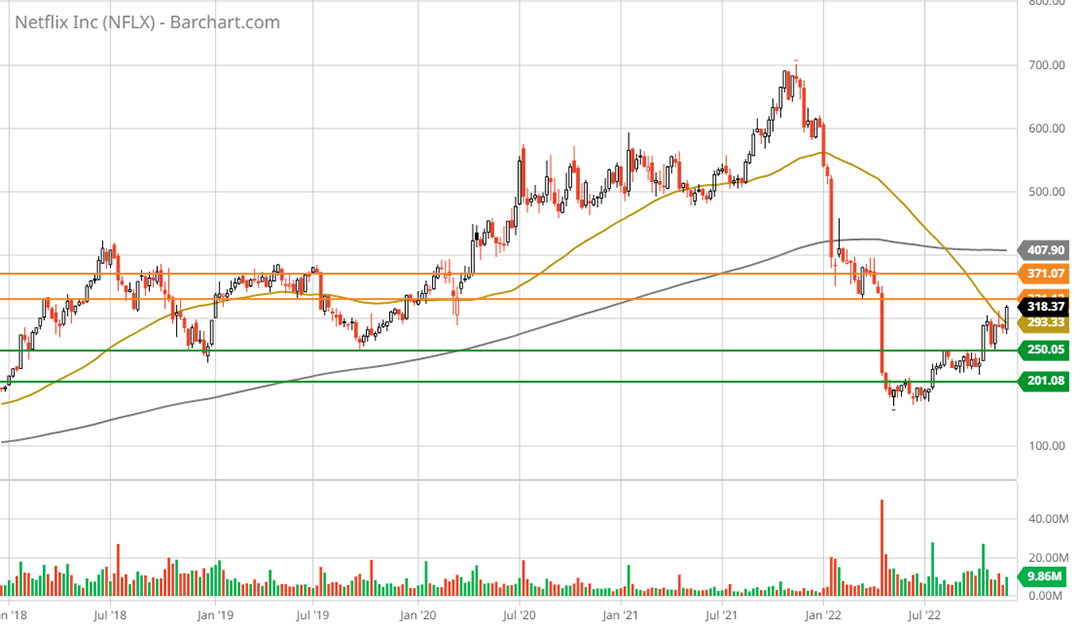
Netflix’s valuation expansion to 30x reduced earnings estimates and just under 100x expected cash flow for next year has occurred during a period of valuation normalization across the market. Valuation normalization is an ongoing feature of the current phase change in the markets. The market backdrop today is not conducive to extreme valuations. The following 5-year weekly chart offers a birds-eye view of the technical backdrop.
Notice that the key resistance zone bracketed by the orange lines includes a large support base, or sideways consolidation, which lasted from 2018 to 2019. The orange resistance zone outlined above is likely to include investment reconsideration by the 2018 to 2019 buyer cohort. Netflix could soon be dancing in the rain of overhead supply.
Please note that the grey line in the above 5-year weekly chart is the 200-week moving average and the gold line is the 50-week moving average. The 200-week moving average is near $400 and should represent an upside limit given the reduced growth forecasts and increasingly extended valuation.
Potential Return Spectrum
The technical backdrop has shifted from extremely oversold to materially overextended to the upside. With reason to expect significant resistance overhead, the technical setup is now negative on short-to-intermediate-term time frames.
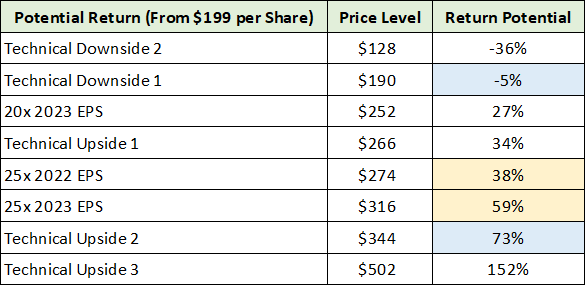
In fact, Netflix is in the vicinity of the most likely potential return targets outlined in my May report. The following table displays the return potential to each of the upside and downside price targets at the time.
The following was my commentary on the above potential return spectrum from the report:
I have highlighted in blue what I view as the most likely near-term return potential. The yellow highlighted cells represent high confidence return potential based on Netflix trading in line with its peer group’s valuation multiples.
Summary
With Netflix trading near $320 today, the shares have captured over 90% of the most likely return potential over the intermediate term, using $344 as the upper target. When combined with intensifying competitive pressures, declining growth estimates, an elevated valuation, and upside technical overextension, the risk/reward asymmetry is neutral at best. Over shorter time frames, the asymmetry is increasingly skewed to the downside.
While there is little visible opportunity in Netflix at the current price, a glimpse at Comcast’s valuation in the above table points to potential upside asymmetry. Unlike Netflix and Disney, a bright future is not embedded in Comcast’s valuation. As we will see in the next report, Comcast also differs in its consistent and substantial free cash flow generation.
Price as of this report: $320.41
Netflix Investor Relations Website


