Following on the heels of the Protolabs report on November 13, 2023, “Protolabs is sculpting the supply chain,” is a brief update on Materialise, which rounds out the top two opportunities in the 3D printing industry. In the June 2, 2023 report “3D printing is a razor and blade opportunity,” I described Materialise as follows:
In my experience, having followed the group throughout the years, Materialise and Protolabs have consistently stood out as the top two opportunities in the industry… I view Materialise as the top opportunity in the group given its superior business model, margin structure, and its peer-leading growth outlook.
Technicals: Plumb Line
A plumb bob is a simple device, a weight suspended from a string, which is used to establish vertical direction known as a plumb line. The mental image of a plumb bob at rest (thus establishing vertical direction) is apt for describing the price action of Materialise since the June 2, 2023 report.
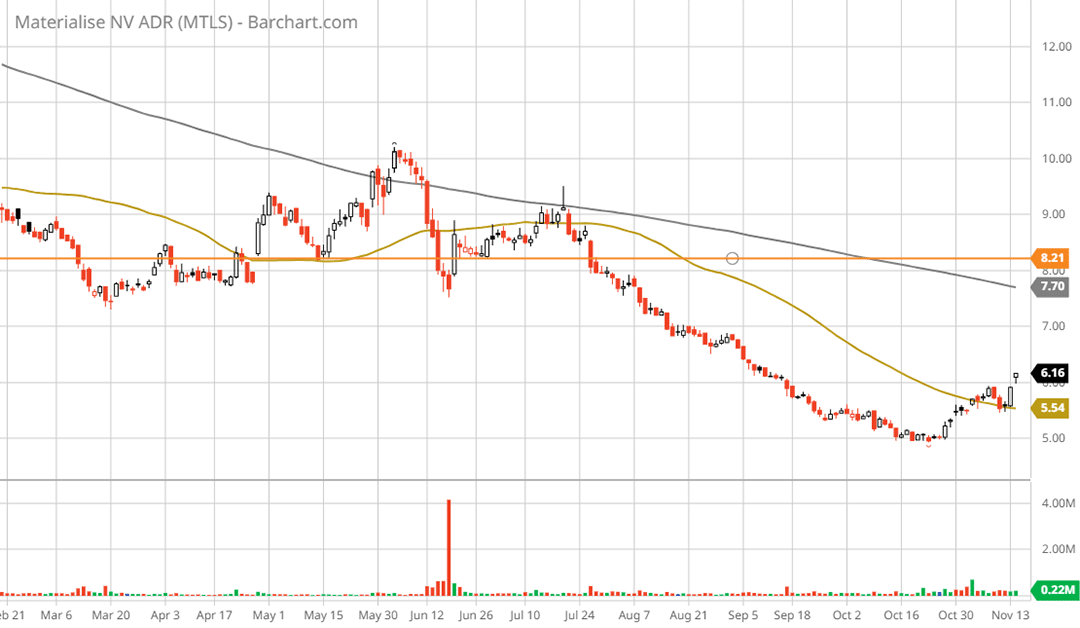
Using the plumb bob analogy, notice on the following 6-month daily chart that Materialise’s share price came to a complete stop between October 16 and October 25, near $5 per share.
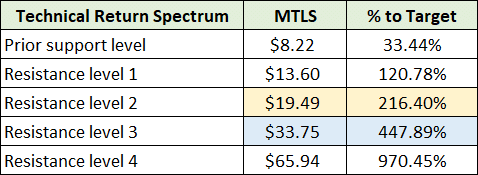
Please note that the grey line is the 200-period moving average and the gold line is the 50-period moving average. The orange line denotes the prior support level identified in the technical return spectrum of the June 2, 2023 report “3D printing is a razor and blade opportunity,” and is included below with updated percentages (% to Target):
The support level near $8 was breached beginning in August 2023, leading to an uninterrupted downtrend which came to a stop near $5 in late October 2023 (the plumb bob). Anecdotally speaking, what I refer to as the plumb bob price pattern is likely to prove a bullish price signal. The inference is the shares are being actively accumulated at the level and thus supported.
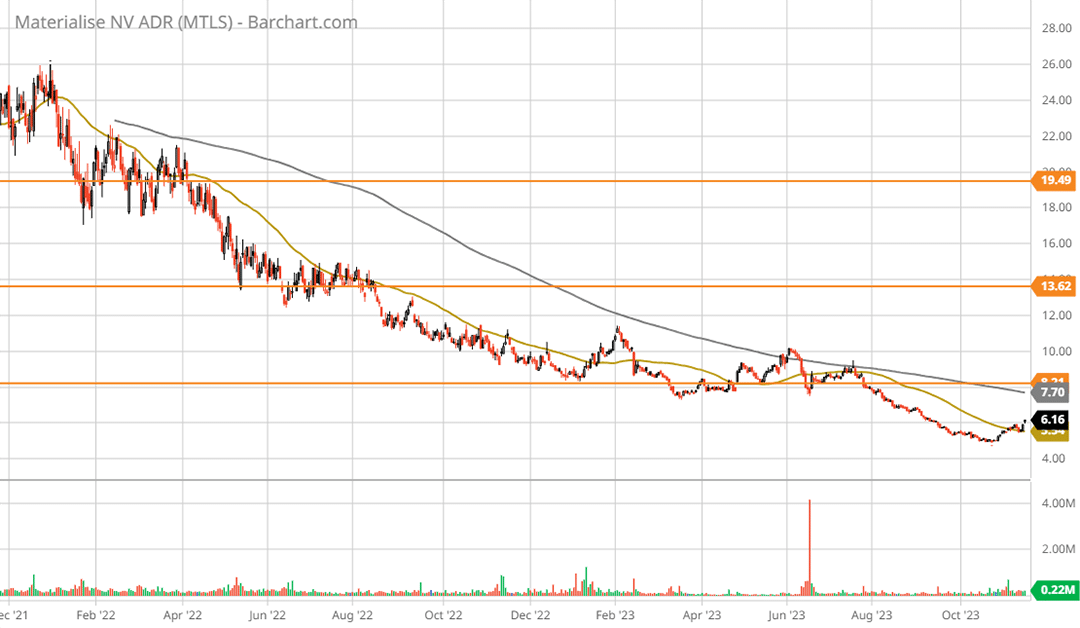
In the above table, I have highlighted the technical targets which I view to be the most probable. The following 2-year daily chart places the recent price bottom in greater context. Note that I have added several technical price targets which are denoted by the orange lines.
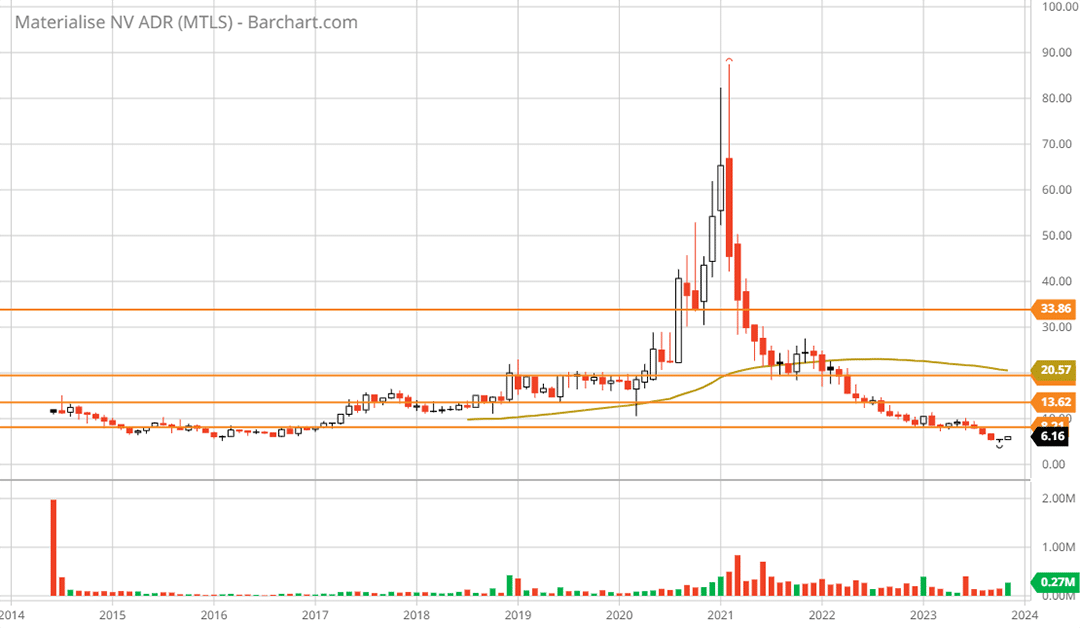
As Materialise’s shares have not sustainably traded below $8 since late 2016, resistance at the prior support level near $8 is likely to prove minimal. If true, the first major resistance level is 120% higher near $13.60 per share.
Technically speaking, Materialise’s shares offer an extremely positive risk/reward asymmetry. The following 10-year monthly chart places the recent price action in the context of Materialise’s full trading history.
Fundamentals
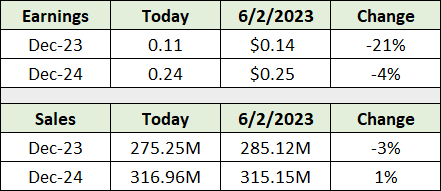
Turning to fundamentals, what is most notable about Materialise breaching key support near $8 is that consensus earnings and sales estimates remain largely unchanged since the 3D printing report on June 2, 2023. The following table displays consensus earnings and sales estimates as of today compared to those at the time of the June report.
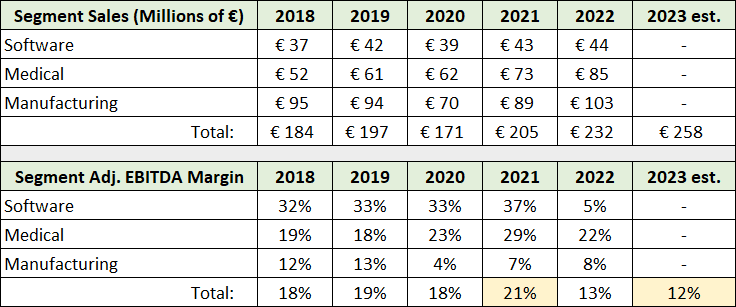
While earnings estimates were reduced materially for 2023, Materialise has a history of erratic margins across its three business segments: Software, Medical, and Manufacturing. This can be seen in the following table compiled from Materialise’s August 2023 investor presentation, its Q3 2023 earnings presentation, and its Q1 2023 earnings release.
I have highlighted in yellow Materialise’s high and low total adjusted EBITDA margin since 2018. Though the adjusted EBITDA margin was 16% through the first three quarters of 2023, the company is guiding for roughly breakeven adjusted EBITDA in the final quarter of 2023.
While Materialise’s margin volatility is a yellow flag at this stage, the company is a pure play 3D printing company at an early stage of its (and the industry’s) development. As such, using denominators other than earnings for valuation purposes provide additional color.
The following table displays various valuation metrics for Materialise in comparison to that of its sector (information technology) and Materialise’s 5-year averages. Growth rates are compared in the lower portion of the table. Note that earnings, or PE, is too unstable to serve as a useful guide for Materialise at this time.
On a price-to-sales basis and EV/EBITDA basis, a reversion to the sector median translates into roughly 100% upside potential. A reversion to Materialise’s 5-year average valuation on each measure translates into 317% and 472% upside, respectively. On a per share basis, a 5-year mean reversion translates into $26 to $35 per share.
Summary
The per share figures above align well with resistance levels 1 ($13.60) and 3 ($33.75) in the technical return spectrum table. Resistance level 3 is the upper end of the most likely potential return spectrum of 216% to 448%, or $19.49 to $33.75 per share looking through the mid-decade timeframe.
As Materialise has plumbed the depths at all-time lows, coming to a complete standstill near $5 per share in late October, the technical risk/reward asymmetry is highly skewed to the upside while being well supported by fundamentals. The next plumb line measurement is likely to be materially higher for Materialise.
Materialise price as of this report: $6.16
Materialise Investor Relations website


