With the stock and bond markets remaining highly volatile and in search of a bottom, a concept born in more recent times may serve as a qualitative signpost as to where we are in the current cycle: “risk-on, risk-off.”
When I entered the investment industry in the latter half of the 1990s, investors did not speak of risk-on or risk-off markets. The markets were always a place of risk-on, there was no risk-off mode. Prior to the recent cycle, risk was generally everywhere at all times, which is the natural state of markets.

The challenge with a prolonged period of risk-on is that it was not just stocks that were risk-on investments. The global zero interest-rate policy turned everything into risk-on ─ stocks, bonds, real estate, etc. Diversification became increasingly difficult as highlighted by the following quote from my March 2022 market outlook, “SPY: The death cross and what you need to know.”
In essence, stocks and bonds are now positively correlated leading to synchronized gains and losses. This is problematic from a systemic risk perspective as there is less ability to diversify portfolios…
Phase Change
Central banks are well advanced in transitioning from the above conditions. The absolute size and velocity of the change in interest rates has been historic.
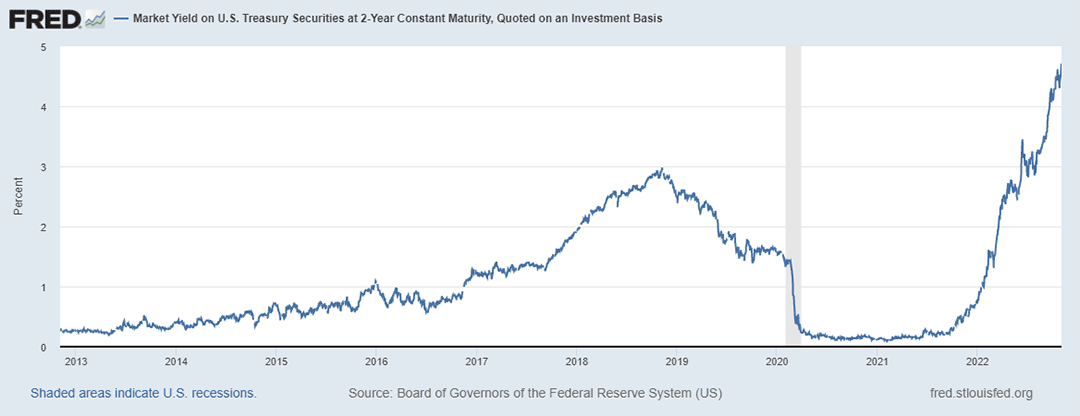
The following chart courtesy of the St. Louis Federal Reserve displays the recent move higher for the 2-year Treasury bond. The 2-year yield was just above 0% from March 2020 until October 2021, and it is now at 4.66%.
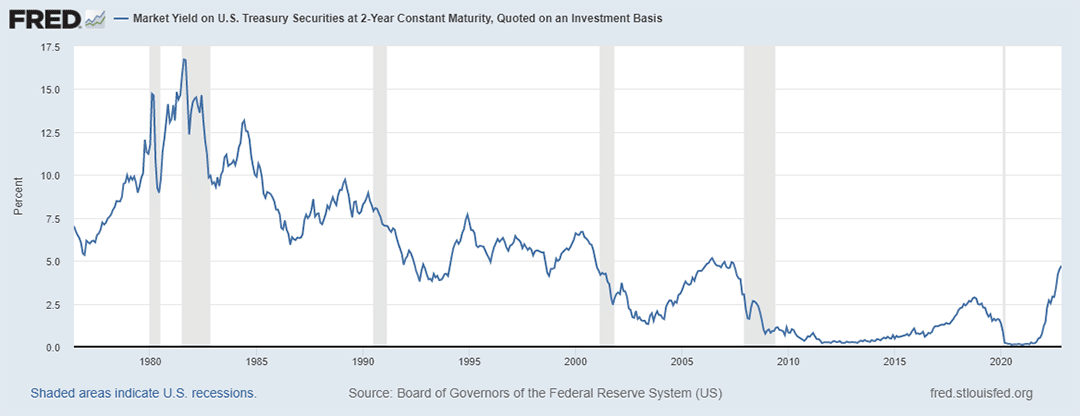
The next chart from the St. Louis Federal Reserve displays the 2-year Treasury bond yield in a historical context following the 1970’s period of inflation.
There are seven material rate increase cycles in the historical chart above, which are summarized in the table below. I have highlighted in blue the current rate hike cycle and in yellow similar duration cycles (Months) for ease of comparison.
While the current rate hike cycle is the largest percentage change of the seven, there were three similar cycles in terms of duration. From this perspective, the current rate hike cycle is not as extreme as appears to be the case in the first chart above.
The Federal Reserve has acted swiftly but not out of character from a historical perspective. Furthermore, the absolute size of the current rate increase cycle is largely a function of extreme initial conditions, with the 2-year Treasury yield starting near 0%.
The Bond Market
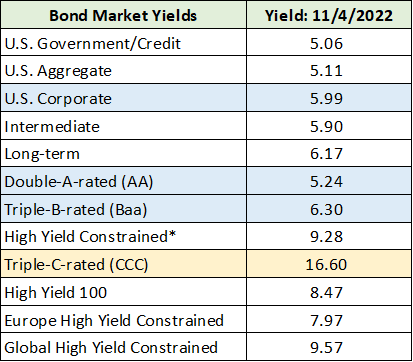
In the above context, the rate hike cycle looks to be in a mature stage, if not yet complete. Short-term risk-free yields offer a competitive investment alternative, nearing 5% guaranteed. The broad bond market offers additional color. The table below was compiled from The Wall Street Journal and displays yields across the major bond market sectors.
I have highlighted in blue the yields across several investment grade corporate bond market sectors. Investment grade intermediate-term bond yields are in the low 5% to 6% range. The lowest quality corporate bond sector is flashing a red light for the economy at 16.6%, highlighted in yellow.
The return available in higher-quality bonds is becoming competitive with other asset classes. Portfolio diversification via high-quality bonds is back on the table.
The following table compares current rates to those as of my August market outlook, S&P 500: Where we go after Jackson Hole, and places the above corporate rates in the context of recent trends.
At the time of the August market outlook, the 2-year Treasury yield was 3.4%. Today, the 2-year Treasury yield is 4.66%. This is a 1.26% rate increase. When compared to the Change column above, yields in the corporate bond market increased in line with the 2-year Treasury yield.
The 5-year Treasury yield was 3.21% as of the August market outlook and is now 4.33%. This is a change of 1.12%. Similarly, the 10-year Treasury yield increased by 1.16% since the August update. Compared to the Change column above, there are no signals of broad-based corporate stress outside of the Triple-C-rated segment (highlighted in yellow). The rate increases are generally in line with the increase in risk-free yields.
Systemic Risk
The message being sent from the bond market appears to be an across-the-board interest rate increase with little signs of stress outside of the lowest quality bonds. This is informative in light of recent statements from leaders in the financial sector. They have direct access to what is happening on the ground and broadly throughout the economy. The following passage is from a June CNBC article by Hugh Son, entitled “Jamie Dimon says ‘brace yourself’ for an economic hurricane caused by the Fed and Ukraine war.”
“We’ve never had QT like this, so you’re looking at something you could be writing history books on for 50 years,” Dimon said. Several aspects of quantitative easing programs “backfired,” including negative rates, which he called a “huge mistake”.
The following is another passage from the article:
Central banks “don’t have a choice because there’s too much liquidity in the system,” Dimon said, … “They have to remove some of the liquidity to stop the speculation, reduce home prices and stuff like that.”
I have found Dimon to be refreshingly direct and amongst the most widely respected leaders in the financial markets. Given that publicly traded corporate bonds are not signaling stress, Dimon’s statements get to the heart of the matter. In terms of systemic risk, Quantitative Tightening has never been attempted at the current scale.
Given the lack of stress in the public bond markets, I infer that we cannot quantify the interconnections and leverage throughout the non-public markets. These connections are likely to be stressed as liquidity is removed via QT. The following passage is from a recent Financial Times article, “Amundi warns on hidden leverage in the financial system.”
Amundi warns on hidden leverage in the financial system. Investment chief Vincent Mortier says UK pension debacle highlights ‘shadow banking’ risks. Vincent Mortier: ‘The issue is that we don’t know exactly where [leverage] is. When you can’t measure something it’s difficult to act upon it…’
In a recent CNBC article by Hugh Son, ”Bank of America CEO says latest spending and savings data show that the U.S. consumer is healthy,” Brian Moynihan confirms that US consumers remain generally strong. From the article:
“Analysts might wonder whether the talk of inflation, recession and other factors could [result] in a slower spending growth,” Moynihan said Monday during a conference call to discuss third-quarter results that topped analysts’ expectations. “We just don’t see [that] here at Bank of America.”
Moynihan’s observation regarding US consumers is in alignment with the message from the bond market. There are no systemic stresses visible in public markets. Systemic risks appear to be in the shadow banking system which are only visible when something breaks. Such a break, if it occurs at scale, is highly likely to spillover into the public markets.
Yield Curve Inversion
The public markets are generally signaling that a recession has arrived as discussed recently in FedEx and the recession and The recession is here, filter the noise. My focus in those reports was on companies and the recession signal they are sending in recent earnings reports. A recession interpretation is also supported by the bond market.
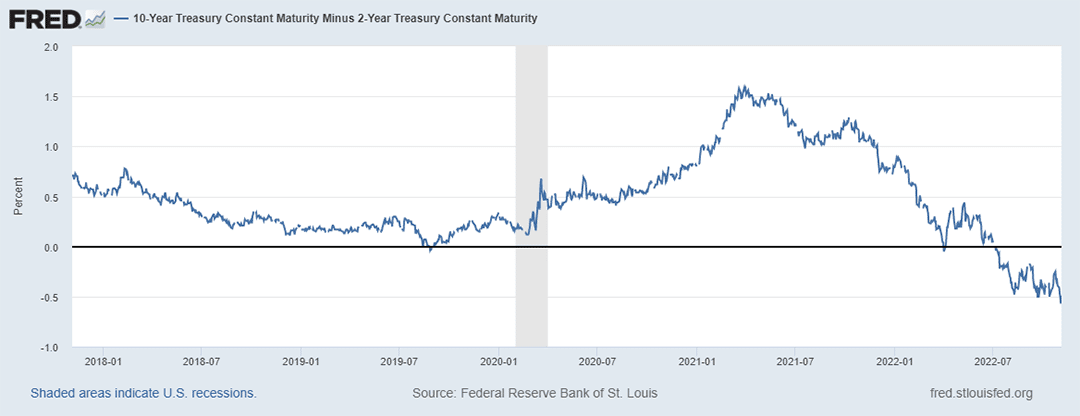
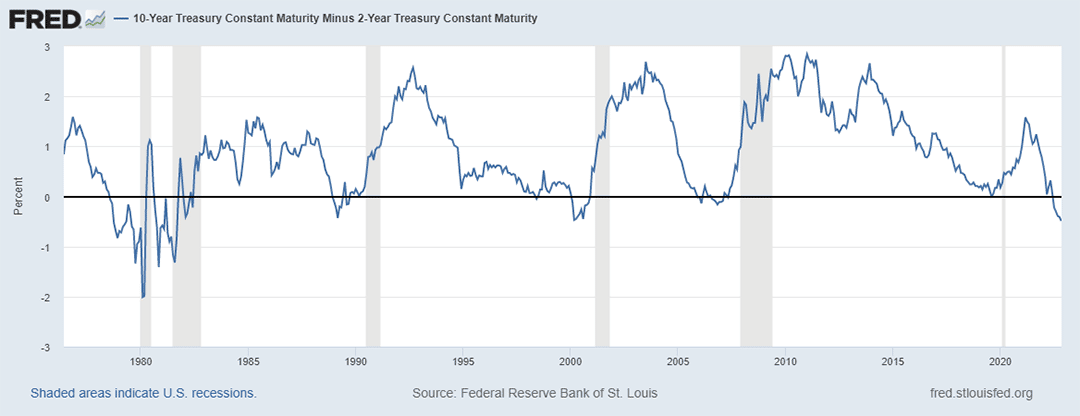
The yield curve inverted during the first week of July 2022 and remains so today. The following chart courtesy of the St. Louis Federal Reserve displays the difference between the 10-year Treasury yield and the 2-year yield. When negative, the 10-year yield is lower than the 2-year yield. The duration of the inversion, at 5 months, is a strong recession signal when combined with corporate results.
The following chart displays the history of the yield curve going back to the 1970s.
Notice the inversion that occurred during the late 1970s and early 1980s. The inversion peaked at -2% during Q1 1980, and the inversion did not sustainably end until Q4 1982. This inversion period is summarized in the table below from the June market outlook, S&P 500: The path forward.
Such an extreme inversion period, at 42 months, appears highly unlikely today. What looks likely from my perspective can be found in the 10-Year Yield column above. Notice that when the inversion ended, the 10-year yield was higher than where it was at the beginning of the inversion period.
With the 10-year Treasury bond yielding 4.16% today, and the Fed targeting near 5% on the short end of the curve, there appears to be material room for higher rates on longer-term bonds. Additionally, from my perspective, there is a meaningful probability that the Fed could pause before resuming rate increases, as seen in the 1978 to 1982 inversion.
In light of this interpretation, longer-term bonds carry much higher risk while the intermediate-term corporate bond market offers the most attractive risk/reward opportunity.
Summary
Given the above, a qualitative signpost as to where we are in the current cycle may be the use of the phrase: “risk-on, risk-off.” When I entered the investment industry in the latter half of the 1990s, investors did not speak of risk-on or risk-off markets. Markets were always a place of risk-on, there was no risk-off mode.
Prior to the recent cycle, risk was generally everywhere at all times, which is the natural state of markets. From my perspective, usage of “risk-on” and “risk-off” to frame the investment climate is likely to be an excellent qualitative signal. If it loses appeal, the markets are more likely to be near a bottom.
In light of the bond market discussion above, “risk-on/risk-off” investing is unlikely to work well. With signs pointing toward an inflationary recession in progress, the Fed may not respond to market demands for lower short-term rates as this could amplify a recession with higher inflation.
The good news is that meaningful returns and diversification have returned to the bond market. Diversification is extraordinarily valuable for the vast majority of portfolios. The intermediate-term corporate bond market offers the most attractive risk/reward opportunity.


