I am assigning Lululemon Athletica (NASDAQ: LULU) a negative risk/reward rating based on a heightened risk of disappointing earnings growth in 2022, with the caveat that the recent fundamental and technical backdrop is bullish. In this article I breakdown Lululemon’s segment sales to illuminate the source of potential disappointment in 2022. I then place the company’s performance in the context of its valuation, competitive backdrop, and technical setup. The objective is to formulate an investment strategy for the shares as the company is still early in its secular growth story.
Risk/Reward Rating: Negative
Lululemon continues to execute ahead of its original growth plans. The company reported excellent Q2 2021 results after the market closed September 8, 2021 and provided strong guidance for the remainder of the year. During the conference call, management emphasized that the 25% annualized revenue growth rate the past two years has been well above the 19% growth rate experienced in the three years preceding COVID. The company guided for this to continue for the full year of 2021. Sales are expected to grow 25% annualized compared to 2019 and 42% compared to the COVID-reduced sales of 2020.
The news sent the shares soaring over 10% the following day and they are now up 12% since the report. While growth has been impressive in recent years, there are some clouds on the horizon which warrant caution regarding the sustainability of the recent above-trend growth. The primary concern revolves around direct-to-consumer sales (used interchangeably here with E-commerce) which have exploded in recent times. E-commerce sales contributed to most of the upside surprise above the pre-COVID growth trajectory with sales growing 100% in 2020 alone. The direct-to-consumer surge began to show signs of rapid deceleration in the Q2 2021 earnings report.
Q2 Segment Sales Analysis
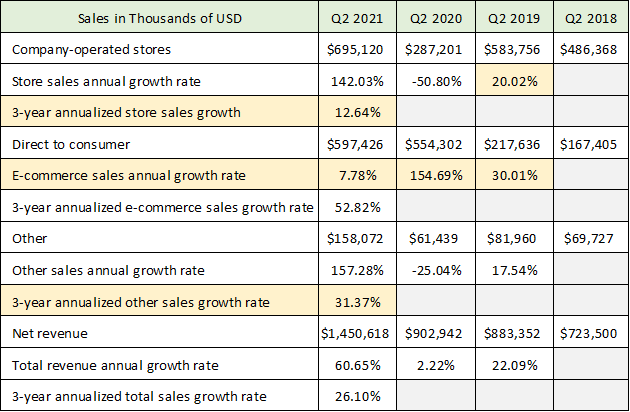
Lululemon breaks down its sales performance into three primary business segments: company-operated stores (physical stores), direct-to-consumer (E-commerce), and other (primarily wholesale sales and the recent Mirror acquisition). Each of the three segments has vastly different economic characteristics and resulting impacts on Lululemon’s financial performance. The following two tables are compiled from the 2021 10-Q second quarter and the 2019 10-Q second quarter reports filed with the SEC.
Source: Created by Brian Kapp, stoxdox
Given the massive distortions in the distribution of sales among Lululemon’s segments caused by COVID, it is important to try to understand the underlying trend in each segment as business normalizes. The key data that will be referenced is highlighted in yellow. Beginning with company-operated stores, pre-COVID sales grew at 20% in 2019 prior to the collapse in 2020 due to the stores being closed for much of the quarter. With normal operations in Q2 2021 (95% of the stores were open), sales in the stores have roared back. In order to discern the underlying trend, I have annualized the three-year growth rate of store sales from Q2 2018 through Q2 2021 (I do the same for each segment). Store sales have been growing at 12.64% annualized.
Over the past two years the E-commerce segment sales mirror that of store sales. They were clicking away at 30% growth in 2019. Then they exploded to 154% growth in Q2 2020 during the period of maximum store closures due to COVID. In Q2 2021, E-commerce sales growth has collapsed to under 8%. A deceleration was to be expected with the stores reopening, however, the rapidly decelerating growth creates challenges in forecasting Lululemon’s financial performance going forward.
Finally, the other category has registered 31% annualized growth over the past three years. Like store sales, wholesale sales were hurt by COVID. It should be noted that Lululemon purchased Mirror in 2020 which aided in the 157% growth rate in Q2 2021. Mirror offers fitness hardware and subscription services (a screen shaped like a mirror to view and interact with content during workouts). This segment remains small for Lululemon and is the least impactful to the financial results in the near term.
The following table breaks down the percentage of Q2 sales over the past four years represented by each operating segment (compiled from the Q2 2021 10-Q and the Q2 2019 10-Q filed with the SEC). Please view the yellow highlighted row to grasp the degree to which COVID has turned Lululemon’s segment sales data on its head in 2020 compared to prior results and the partial renormalization in Q2 2021.
Source: Created by Brian Kapp, stoxdox
Q2 Segment Sales Trends
As we will see below, E-commerce sales trends are critically important for Lululemon’s profit growth trajectory as the economics are much better than they are for physical stores. Prior to COVID, this segment accounted for roughly 25% of total sales, while physical stores brought in the majority of sales at over 66%. These segments were reversed in 2020 due to COVID but are beginning to equalize in 2021.
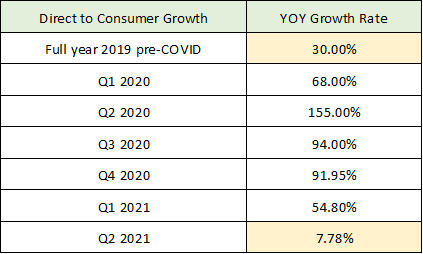
Of critical importance for Lululemon’s shareholders is what this segment contribution looks like in the future as E-commerce generates 64% higher operating margins than physical stores. To bring more clarity to this, the following table looks at the current trends in E-commerce sales growth. It was compiled with data from the five most recent 10-Q quarterly reports and the most recent 10-K annual report filed with the SEC. For each period, I am looking at the year-over-year growth rate in E-commerce sales each quarter ─ except for the first row which is the full year 2019 sales growth rate compared to 2018.
Source: Created by Brian Kapp, stoxdox
The E-commerce spike during the COVID period is as one would expect, peaking at 155% growth in Q2 2020 during the worst of the physical store shutdowns. This was then followed by robust growth for the remainder of 2020 and into Q1 2021 as social distancing remained in effect. Q2 2021 was the first quasi-normal quarter as vaccinations were in full swing and an extensive reopening took place. 95% of the stores were open in Q2 with Australia and New Zealand accounting for most of the closed stores. Lululemon’s E-commerce growth plunged to under 8% growth in Q2 2021. While this is a solid showing compared to the incredible 155% growth in Q2 2020, the E-commerce growth trajectory is rapidly slowing.
Lululemon’s E-commerce sales were trending at 30% prior to COVID (first row in the above table). The 30% annual growth rate is incredibly strong and is likely more indicative of the underlying growth trajectory in the marketplace. As a result, the five consecutive quarters of exceptional growth due to COVID have taken E-commerce sales well above the natural trend. The 7.78% E-commerce growth posted in Q2 2021 points toward the likelihood of sales reverting back to the underlying growth trajectory. This reversion was reinforced by the August retail sales report which showed total US E-commerce sales growth of 7.5% for the most recent month. If this is the case, we must understand how extended E-commerce sales are above the sustainable growth trend.
E-commerce Sales Trends
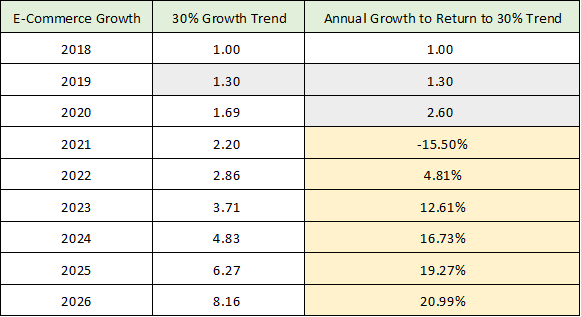
In the following table I have set 2018 as the base year for E-commerce sales from which to project the pre-COVID annual 30% growth trajectory (setting sales in the base year at 1 for simplicity). The grey shaded cells reflect actual growth achieved by Lululemon in 2019 and 2020 (E-commerce sales grew 30% in 2019 and 100% in 2020 for the full year).
Source: Created by Brian Kapp, stoxdox
The 30% Growth Trend column is what $1 of sales in 2018 would grow to through 2026 (1.3 for 2019 reflects the actual 30% growth rate achieved in 2019). The Annual Growth to Return to 30% Trend column reflects the actual growth achieved in 2019 (30%) and 2020 (100%). Then it projects the annualized growth rate required by the end of each year after 2020 to return to the underlying growth trend of 30% using 2018 as the base year.
To clarify, if E-commerce growth were to revert to the pre-COVID trend line, sales in 2021 would fall by 15.5% for the full year. Likewise, if E-commerce sales returned to the base 30% growth trajectory by 2022, sales would grow at 4.81% per year for 2021 and 2022, and so on. The best-case scenario for Lululemon under this reversion to a 30% growth trajectory scenario, is for E-commerce sales to return to trend slowly between 2021 and 2026. Under this slow normalization scenario, sales would grow at 20.99% per year through 2026 (final row).
The reality of economic life is that things do not follow straight lines or smooth pathways as evidenced by Lululemon’s 155% growth in Q2 2020 followed by 7.78% growth in Q2 2021. Given the 7.78% growth rate in Q2 2021, the near-term reversion to a sustainable growth trajectory for E-commerce is likely to resemble the 2022 row (4.81% growth rate) rather than the 2026 row (20.99% annual growth). Furthermore, year-over-year E-commerce contraction near term cannot be ruled out (2021 row).
Segment Operating Margins
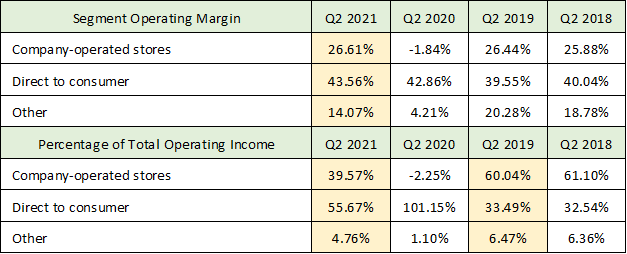
The effort to understand the forward-looking segment performance for Lululemon is critical as E-commerce generates 64% higher operating margins than physical stores as shown in the table below. This data was compiled from Lululemon’s Q2 2021 10-Q and Q2 2019 10-Q filed with the SEC, with the critical data highlighted in yellow.
Source: Created by Brian Kapp, stoxdox
The direct-to-consumer segment produced operating profit margins of 43.56% in Q2 2021 compared to only 26.61% for the physical stores and 14.07% for the other category. Operating profit margins do not include general corporate expenses which are shared by all segments. In terms of total operating income, E-commerce and physical stores have reversed roles in Q2 2021 compared to Q2 2019 (both shaded in yellow).
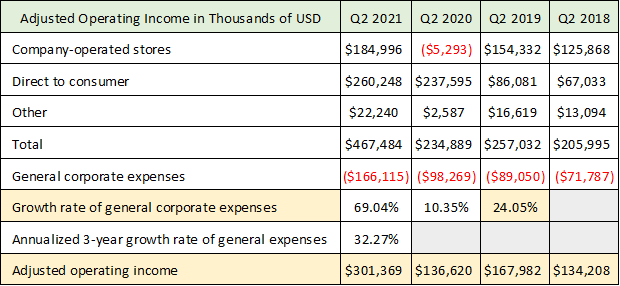
It stands to reason that a material deceleration of E-commerce growth will be difficult to offset with an acceleration of physical store and other sales growth from a profitability growth perspective. E-commerce margins are 64% higher than store margins and 210% higher than margins in the other segment. The following table shows these margin figures in dollars for the past four years. This will help us begin to make some forward estimates (data compiled from the Q2 2021 10-Q and Q2 2019 10-Q filed with the SEC).
Source: Created by Brian Kapp, stoxdox
Adjusted operating income (final shaded row) is operating income before taxes and excludes immaterial acquisition-related expenses and amortization of intangibles. The performance in Q2 2021 was extraordinary compared to the prior three years which featured lower growth rates and stagnation. The Q2 2021 performance was driven by the full stores reopening in addition to the still growing E-commerce segment.
General corporate expenses have also exploded higher in Q2 2021, growing 69%. I assume these expenses will revert to the pre-COVID growth rate of 24% (highlighted) posted in 2019 when projecting earnings for Q2 2022 below. Before making 2022 projections, we need to understand the underlying store sales growth trend to compliment the E-commerce trend analysis above.
Store Sales Trends
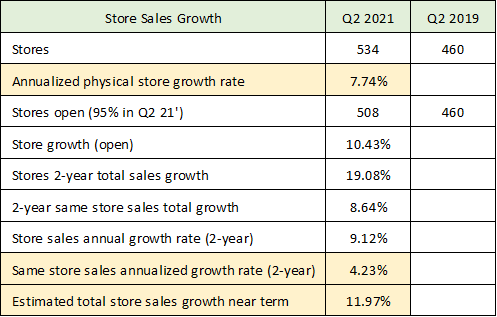
Store sales are likely to reassert a more significant role for Lululemon’s segment mix going forward which is more in line with pre-COVID trends. As a reminder, store sales comprised 66% of full year sales in 2019, compared to 32% in the 2020 full year, and 48% in Q2 2021. The following table is compiled from the Q2 2021 10-Q and Q2 2019 10-Q filed with the SEC.
Source: Created by Brian Kapp, stoxdox
The important data is highlighted in yellow while the remaining rows are for informational purposes. The company is growing its store count by 7.74% per year (first highlighted row). Sales at pre-existing stores are growing at an estimated 4.23% per year (second highlighted row). Combining these two figures would suggest physical store sales growth of 11.97% (final row highlighted) going forward in the near term. This is in line with the annualized 12.64% sales growth over the past three years shown in the first table.
Keep in mind that same store sales trend lower over time for retailers as their store base matures. This natural slowing of same store sales is likely to be offset by an increase in store square footage. Management indicated low teens growth in store square footage growth going forward. The 11.97% store sales growth estimate from the above table is in this ballpark, especially when considering higher square footage growth going forward is likely to include larger store formats to accommodate placing Mirror stores within Lululemon stores.
Q2 2022 Scenario and Estimates
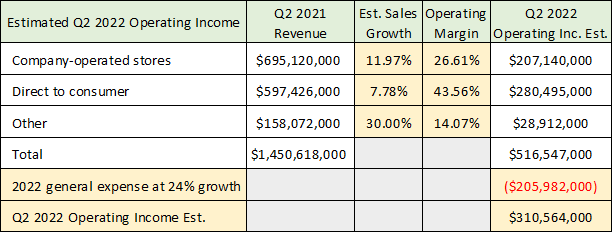
Using the above analysis, I run a scenario for earnings growth in Q2 2022 to get a sense for whether current consensus estimates for 2022 are too high or too low. The intent is to illuminate the likelihood of Lululemon beating or missing earnings estimates in the coming year. This will help us understand and quantify the risk built into Lululemon’s stock at the current price. In the following table I make several assumptions about segment growth and margins that were arrived at in the preceding analysis.
Source: Created by Brian Kapp, stoxdox
The basic assumptions are that the trends in effect in respect to segment sales growth and operating margins in Q2 2021 will continue in the coming twelve months. I assume that general corporate expenses return to the 2019 growth rate of 24% rather than the current 3-year annualized growth rate of 32%. There is much room for error in this expense estimate. Given rapid increases in supply chain inflation, wage inflation, and the company’s intent to continue investing in growth (store count plus the Mirror integration and expansion) and innovation projects (fabric/clothing innovation), I believe the 2019 general expense growth of 24% is the best estimate.
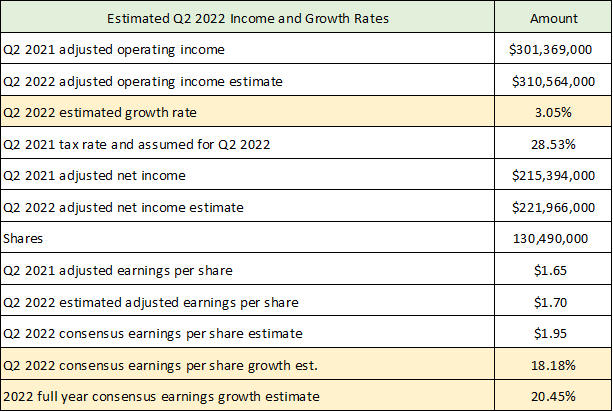
A reasonable estimate for Q2 2022 adjusted operating income before tax is $310 million (last highlighted row in the above table). The following table summarizes this data and translates it into earnings estimate for Q2 2022. I then compare it to the current consensus earnings estimate for 2022.
Source: Created by Brian Kapp, stoxdox
Based on the assumptions discussed in this analysis, it is probable that Lululemon could generate 3% earnings growth in Q2 2022 (first highlighted row in the table above) compared to current consensus estimates of 18.18% for Q2 2022 and 20.45% for the 2022 full year (last two highlighted rows). The trends in place that I assume carry through to Q2 2022 would also impact the entire year of 2022 setting Lululemon up for potentially large earnings misses throughout next year. The market valuation of a company posting 3% annual earnings growth is night and day compared to one posting 20% annual earnings growth, which I will now review.
Valuation
Lululemon is currently valued at 56x the 2021 consensus earnings estimate and 47x the 2022 consensus earnings estimate. On a sales basis, the company is valued at 8.76x the high end of management’s guidance for 2021 full year sales. Each of these valuation measures is extreme in a historical market context. Additionally, the valuation on expected 2021 earnings is a large premium to the current market indices which range from 22x to 32x the 2021 earnings estimate (S&P 500: 22x, Nasdaq 100: 29x, and Russell 2000: 32x).
As a reference point for potential valuation compression, The Gap (NYSE: GPS) is valued at only 0.67x 2020 sales and 12x expected 2021 earnings compared to Lululemon’s 8.76x expected 2021 sales and 56x expected 2021 earnings. Keep in mind that The Gap is mature and is not the best comparable company. However, it does illuminate what happens to valuation multiples as a retailer matures. The Gap comparison also highlights the increasingly competitive landscape.
Competition
Adding to the above profit growth and valuation risks is the plethora of competition entering the fitness apparel market. To highlight a few notable competitors, Peloton (NASDAQ: PTON) is an impressive brand competitor in connected fitness and recently announced its entry into the fitness apparel ring. The Gap’s Athleta division competes directly with Lululemon and will be formidable as The Gap has the resources, talent, and global reach to offer stiff competition in apparel and connected fitness. Finally, Levi Strauss & Co. (NYSE: LEVI) recently announced it too would like some of the incredible growth experienced by Lululemon. The competitive landscape is likely to intensify and place pressure on Lululemon’s sales growth and margins in the years to come. This will add to the segment shift risks discussed in detail here.
Technicals
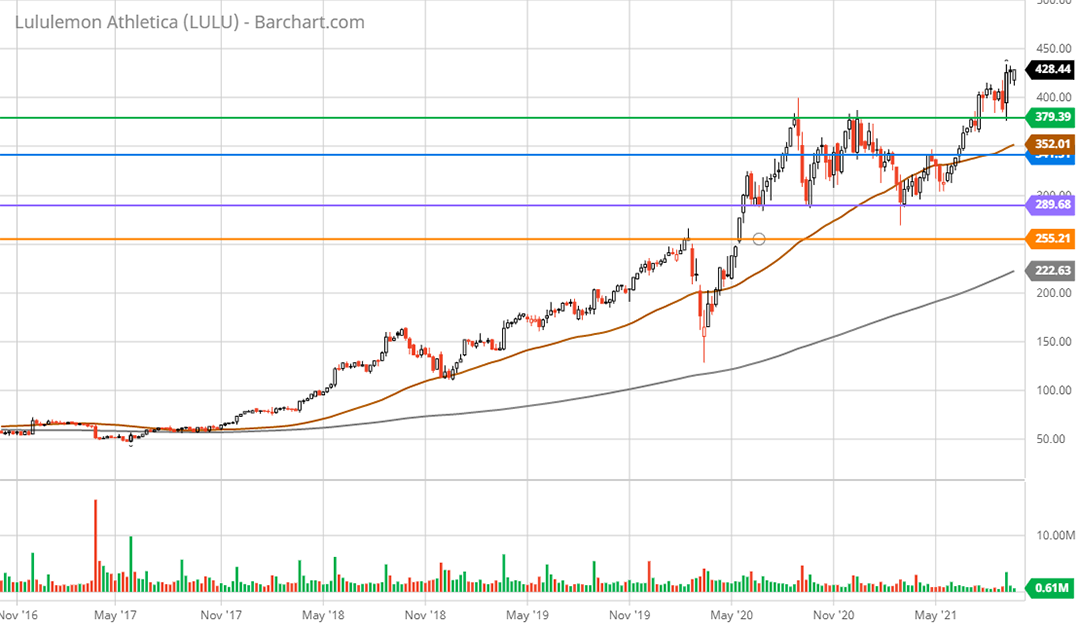
Turning to the charts will help us place the elevated valuation, heightened risk of disappointment, and secular growth opportunity into the context of price behavior. Lululemon has been in a strong uptrend since 2017 outside of the brief COVID crash in March of 2020. The stock has four well-defined support levels that were carved out during this uptrend. These are highlighted by the colored horizontal lines on the following 5-year weekly chart.
Lululemon Athletica 5-year weekly chart. Source: Created by Brian Kapp using a chart from Barchart.com
The nearest major support is $379 (green line) which was the all-time high resistance in August 2020 and January of 2021 before being broken to the upside in July of 2021. This is also the level prior to the gap higher in response to the Q2 2021 earnings report. Given the valuation concerns mentioned above ($379 equates to 51x 2021 consensus earnings), this level is likely to be tenuous support if retested.
The next lower support is $341 (blue line) which was resistance from February of 2021 through June of 2021. This level is likely to offer firmer support from a valuation and technical standpoint (45x 2021 consensus earnings). The next support is near $300 which is just above the purple line at $289. This has been lower support ever since June 2020. The shares are likely to find very firm support here and it is the first potential high reward accumulation zone ($300 equates to 40x 2021 consensus earnings). Finally, the orange line is resistance from February of 2020 and stands at $252 (34x 2021 consensus earnings).
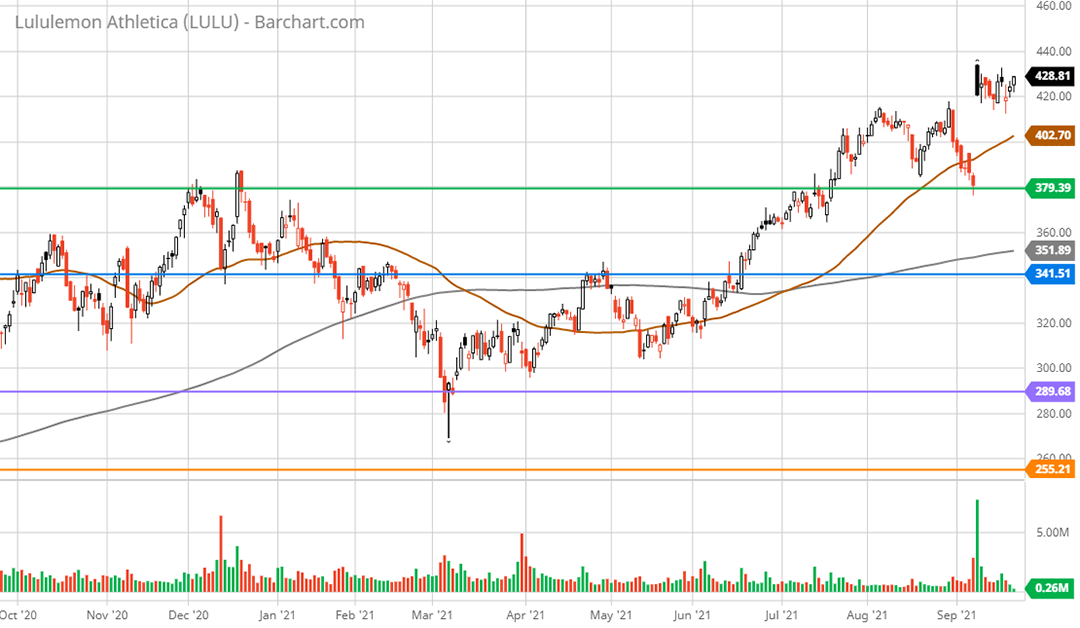
Please keep in mind that if 2022 earnings trend closer to 3% growth as in my scenario, rather than the consensus 20% growth, the lowest support level (orange) is highly likely to be tested. The below chart is a 1-year daily chart with the weekly support lines drawn for reference.
Lululemon Athletica 1-year daily chart. Created by Brian Kapp using a chart from Barchart.com
It should be noted that the technical setup alone (excluding the fundamental analysis here) is bullish. This could suggest further upside price action near term with the primary risk being the filling of the gap higher after the Q2 2021 earnings report ($379).
Summary
All told, the future looks bright. Lululemon is still early in its growth trajectory leaving plenty of runway for the future in the fitness and lifestyle apparel category. Additionally, with the acquisition of Mirror, the company is planting the seeds for potential growth in the fitness hardware and monthly fitness subscription market.
It should be noted that the Mirror product is untested in regard to mass market appeal. The company recently suspended its Mirror subscription service test in order to recalibrate based on what it has learned from this initial rollout. Additionally, Mirror founder Brynn Putnam just announced she is stepping down from her role as chief executive of the Mirror division.
As outlined in the segment sales analysis, the reversion to trend risk for E-commerce sales is substantial. If E-commerce sales stay on the Q2 2021 trajectory, there is substantial risk to 2022 earnings estimates. Additionally, if the reversion is more severe than the scenario provided, Lululemon could face even more intense earnings growth disappointment over the coming years. The intensifying competitive landscape amplifies the risk of disappointing growth.
Adding to the risk of growth disappointment is the high valuation premium in Lululemon’s current share price. The potential for valuation compression (lower price-to-earnings and price-to-sales ratios) is acute even if current consensus estimates are met, let alone if Lululemon begins to disappoint on those growth assumptions.
The risks currently outweigh the rewards at the current share price for prospective Lululemon shareholders. Given the excellent performance to date and incredible brand equity that the company has built, the stock should be on the potential buy list for all growth investors. If a substantial price correction occurs, the shares could offer an attractive long-term investment opportunity. The technical picture combined with the fundamental analysis offers more attractive entry points with the nearest in the $300 area.
Price as of this report 9-23-21: $428.81
Lululemon Investor Relations Website: Lululemon Investor Relations


