I am assigning Intel (NASDAQ:INTC) a positive risk/reward rating based on its competitive advantage in research and development, the company’s aggressive capital investment strategy, and the vastly expanded opportunity set created as a result. Intel is mixing the essential ingredients for a once in a decade phase change to a higher growth profile. With traditional PC unit growth projected to be on par with smartphones through 2025, Intel’s largest business segment should continue to generate substantial free cash flow optionality. The low valuation provides the opportunity for a highly-skewed return profile to the upside offering an asymmetric risk/reward tradeoff.
Risk/Reward Rating: Positive
Intel reported Q3 2021 earnings on October 21, 2021, sending the shares down over 11% the following day. The gap lower brought Intel to a major technical support level in the $50 area where the shares remain today. Investors were primarily disappointed by Intel’s lower gross profit margin forecast for the coming two to three years of 51% to 53%, down from prior projections of 56%. The gross margin reduction is a result of Intel’s aggressive capital investment strategy, including its accelerated investment in new foundry capacity.
In fact, Intel raised its capital investment plans to between $25 and $28 billion for 2022, with the possibility of higher investment levels in subsequent years. This compares to an estimated $18.5 billion in 2021 and an average capital investment budget of $15.2 billion over the prior three years. Adding to the downside pressure is the concern that Intel will not be able to achieve its projected return on these investments. On the Q3 earnings conference call analysts questioned the company’s view that it could achieve double digit revenue growth rates once the new investments come online between 2024 and 2025.
While reduced near-term profitability is indeed likely, the growth investments are a prerequisite for reversing Intel’s underperformance over the past decade. The largest cause of the relative underperformance in the past cycle was that Intel missed out on the dominant secular growth opportunity in smartphones, while falling behind in chip fabrication.
On the smartphone front, Intel’s loss of prominence is now water under the bridge as the market is mature and resembles the traditional PC industry in terms of unit growth. According to IDC (International Data Corporation), the smartphone market is projected to grow at an annual rate of 3.7% through 2025 on a unit basis. For comparison, IDC projects the traditional PC market (such as desktops, notebooks, and workstations) will grow on par with smartphones at 3.2% per year through 2025. The computer segment remains the largest source of Intel’s revenue and operating profits. This positions the company for healthy relative growth within the overall semiconductor industry.
The aggressive foundry investments christened by a $20 billion investment in two new state-of-the-art semiconductor fabs in Arizona, are designed to propel Intel back to a leadership position in chip manufacturing. These investments in semiconductor capacity are occurring at a time of global chip shortages, supply chain disruptions, and geopolitical tensions surrounding the control of critical technology supply chains. Governments throughout the West are moving forward with legislation to encourage and subsidize domestic semiconductor manufacturing capacity to remedy national security vulnerabilities. In the US for example, Congress is working on the $52 billion CHIPs for America Act featuring a possible 40% refundable investment tax credit. Such measures could materially improve the economics of Intel’s growth strategy.
Research and Development Superiority
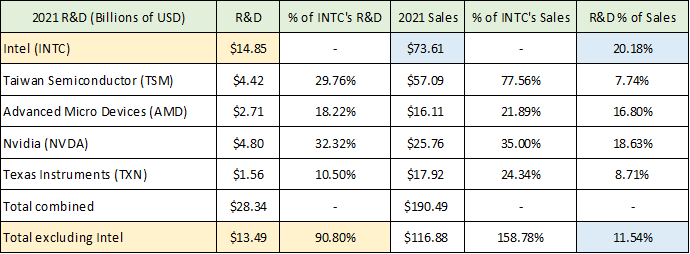
The aggressive foundry investments will provide operational leverage for Intel’s core competitive advantage and dominant position in global semiconductor research and development. The state-of-the-art foundries will enable Intel to fully flex its R&D leadership while maintaining maximum competitive optionality. The following table provides a view of Intel’s competitive positioning in R&D. I compare Intel to four of its largest peers in the semiconductor industry: Taiwan Semiconductor (NYSE:TSM), Advanced Micro Devices (NASDAQ:AMD), Nvidia (NASDAQ:NVDA), and Texas Instruments (NASDAQ:TXN). The table was compiled from Intel’s Q3 2021 10-Q, Taiwan Semiconductor’s 2021 6-K mid-year report, Advanced Micro Device’s Q3 2021 10-Q, Nvidia’s Q2 2022 10-Q, and Texas Instruments Q3 2021 10-Q filed with the SEC.
Source: Created by Brian Kapp, stoxdox
I have highlighted in yellow Intel’s run rate for total 2021 research and development investment and the comparison to its four leading competitors. Intel is investing $1.36 billion more in R&D per year than its top four peers combined. The blue highlighted cells display R&D investment as a percentage of sales. Intel is investing nearly twice as much of its revenue into R&D at 20%, compared to 11.5% for the four competitors combined. While investing substantially more capital than one’s peers does not guarantee a competitive advantage, it materially increases the probability of success.
On the foundry front, Intel is investing 3.4x as much as the industry leader, Taiwan Semiconductor. This bodes well for Intel’s competitive positioning of its new foundry services that will come online in 2024 and 2025. Initial agreements with Amazon Web Services (NASDAQ:AMZN) and Qualcomm (NASDAQ:QCOM) for Intel’s future foundry capacity provide early indications of future success.
In recent years, Advanced Micro Devices and Nvidia have taken market share from Intel in its core markets due to Intel’s product roadmap missteps. Intel is likely to remedy this short-term market shift by investing 5.5x and 3.1x more than AMD and Nvidia, respectively. These two competitors may also become Intel foundry clients in the future. Intel’s superior research and development and capital investment capacity enable the company to take control of its own destiny at an opportune inflection point for the global semiconductor industry.
Operating Summary
Intel’s commitment over the years to research and development investment has a cumulative effect. Expenditures on R&D are expensed as they are incurred each year, unlike investments in property, plant, and equipment which are depreciated over their useful lives. This creates an intangible intellectual property asset for Intel which is not reflected on its balance sheet.
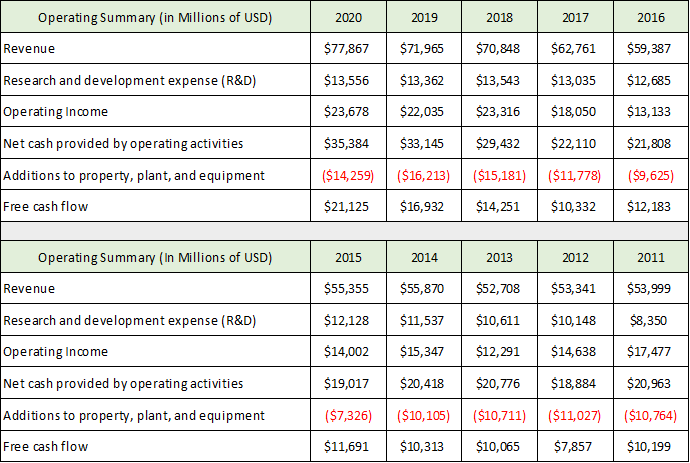
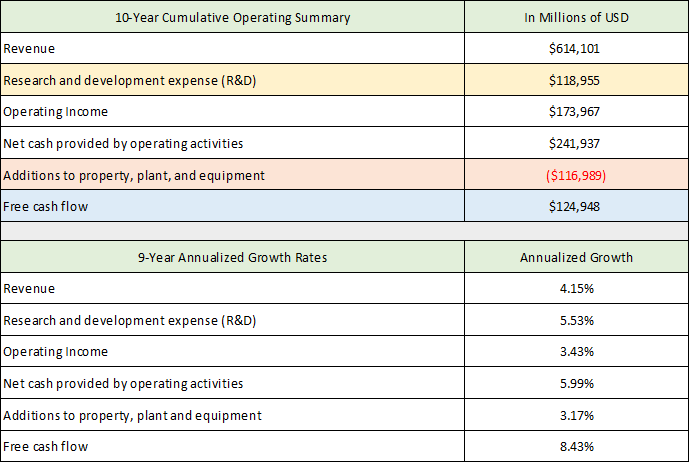
It is exceedingly difficult to quantify the value of R&D investments in any given period. The returns materialize in ways that resemble phase transitions rather than the linear payoff structure associated with capital equipment. The following tables quantify Intel’s operational performance over the past decade. The cumulative performance provides the key information while the yearly data is for reference. The data was compiled from Intel’s 2020 10-K and 2015 10-K filed with the SEC.
Source: Created by Brian Kapp, stoxdox
I have highlighted the key data in the summary table. Intel has invested $119 billion in research and development in the decade through 2020, which will push toward $140 billion cumulatively by the end of 2021. This level of investment should create significant opportunities over the long term. Intel’s decision to embark on an aggressive foundry growth strategy is a strong signal to the market that it believes in the potential for a phase transition to higher future growth rates. The upside potential is leveraged to Intel’s accumulated intellectual property.
While investing heavily in the future, Intel has managed to generate $125 billion of free cash flow after investments in property, plant, and equipment over the past decade. The excess cash flow has been used to support shareholder returns via regular dividend increases and share buybacks. With the renewed focus on growth, it is likely that shareholder capital returns will be a low priority through 2025 as Intel executes its expansion strategy.
Segment Performance
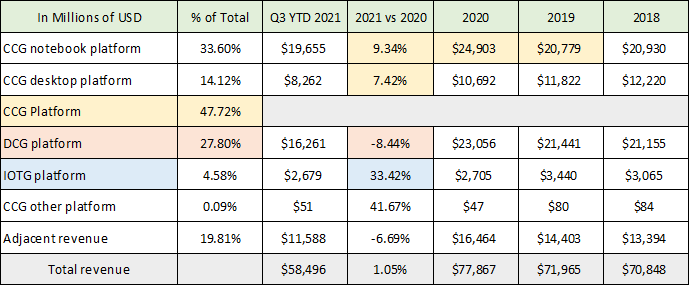
Intel’s aggressive growth strategy should be supported by healthy financial performance from the company’s core business segments. Intel reports its performance across seven categories within four broad segments. The segment results are displayed in the following table which was compiled from Intel’s 2020 10-K and Q2 2021 10-Q filed with the SEC. The Client Computing Group platform or CCG is the largest business segment at 48% of total sales (the yellow highlighted cells) and is performing very well in recent years.
Source: Created by Brian Kapp, stoxdox
The COVID pandemic accelerated the work from home trend creating a strong demand environment. Notebooks are the largest single reporting category and are growing at over 9% through the first three quarters of 2021, following a blowout year of 20% growth in 2020. The total addressable market opportunity for the CCG segment is estimated at $71 billion per year, which leaves room for market share gains. The work from home trend is a secular shift which should continue to support healthy demand with the possibility of accelerated upgrade cycles in comparison to the past decade.
The Data Center Group or DCG offers the largest addressable market opportunity and is expected to reach $119 billion per year by 2025. This is the second largest segment at 28% of sales (highlighted in orange). Performance has been weak in 2021 coming in 8% lower through Q3 compared to 2020. The year-to-date contraction in the DCG is attributable to supply chain constraints and weakness in China.
Intel has an unusually large market share in China’s cloud computing market, which has slowed materially in response to regulatory crackdowns on companies such as Alibaba and Tencent. This softness will continue near term and is a risk that should be monitored. On the other hand, the Chinese market continues to offer the single largest global opportunity which bodes well for Intel’s future (assuming the geopolitical and regulatory tensions subside).
The DCG segment offers tremendous upside potential once Intel’s foundry investments come online. There is tremendous demand for custom silicon solutions to address the various data center use cases. The Amazon Web Services agreement for Intel’s coming foundry capacity speaks to this opportunity. Artificial intelligence will become increasingly important for this segment as well for which Intel’s research and development investments should offer a competitive advantage.
IOTG stands for Internet of Things Group (highlighted in blue) and houses some of Intel’s most exciting growth opportunities. This includes its Mobileye division which is a leader in autonomous driving. The secular trend toward connecting everything via intelligent edge computing creates a strong demand backdrop for this segment. It is Intel’s fastest growing group at 33% through Q3 of 2021 and represents only 5% of total sales. This segment looks to be a robust growth driver for Intel for the coming decade.
Finally, the adjacent segment is a mixture of the non-platform products from the above groups as well as programmable solutions, communications infrastructure, and data storage. Programmable solutions and communications products have underperformed while at the same time offering solid growth potential. Intel is divesting its NAND storage business in China which is contributing to noisy results in this segment.
Segment Profitability
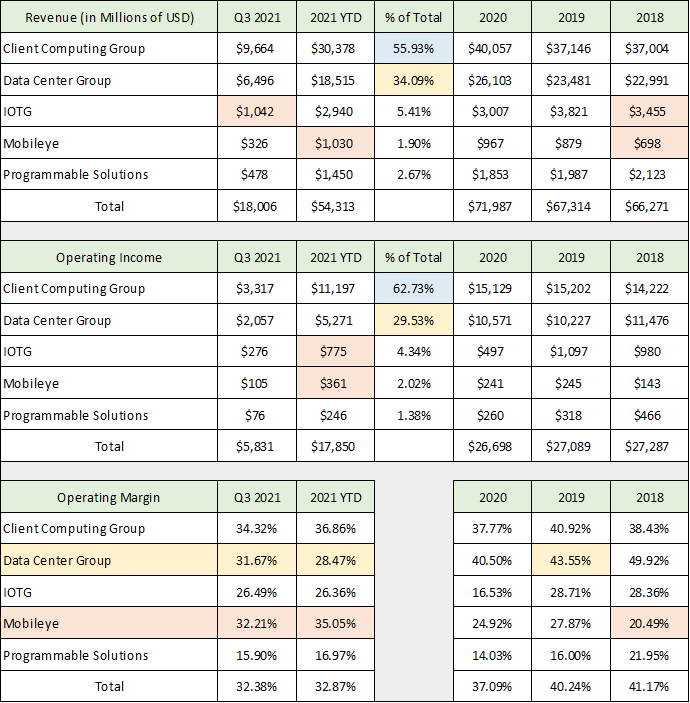
On the profitability front, Intel breaks out its performance in a slightly different manner than the above categories. The adjacent segment is partitioned amongst the CCG, DCG, and IOTG while the programmable solutions group (primarily network infrastructure) is broken out separately. The data in the following table was compiled from the same SEC filings used above (I excluded product lines that are being divested).
Source: Created by Brian Kapp, stoxdox
The Client Computing Group accounts for 56% of total sales and 63% of operating income (highlighted in blue). While this group is largely responsible for Intel’s underperformance since the introduction of smartphones, it is likely to provide a strong ballast going forward due to the secular shift toward remote work.
The Data Center Group contributes 34% of total sales and 30% of operating income (yellow highlighted cells). There is concern near term given the slowdown in China discussed above and the reduced profitability trends visible in the last yellow highlighted row. Supply chain constraints are likely a contributing factor. However, increased competitive pressures are likely the dominant force as margins have been trending lower since 2018.
I have broken out Mobileye separately from the IOTG for emphasis. The strong profitability level of the Mobileye business at 35% operating margins to date in 2021 (the orange highlighted cells) bodes well for the future. Mobileye is rapidly becoming a meaningful contributor to Intel, surpassing $1 billion of sales through the first three quarters of 2021. The remainder of the IOTG group is growing nicely as well and is on pace to hit $4 billion of sales in the current year.
Geographic Trends
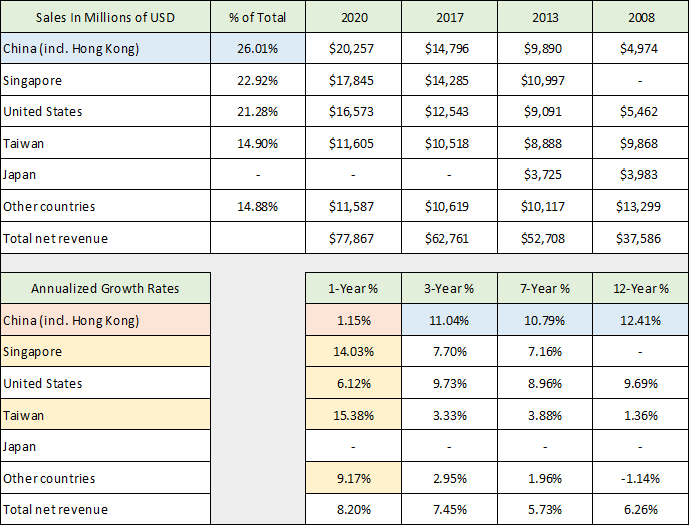
As mentioned above, China is an important market for Intel which creates risks and opportunities for the future. It is worthwhile to review Intel’s geographic sales breakdown to provide further color on global trends. The following table was compiled from Intel’s 2020 10-K, 2017 10-K, and 2010 10-K filed with the SEC. The table displays total sales by geographic region over the past twelve years and annualized growth rates over various time frames in order to get a sense of the underlying trends.
Source: Created by Brian Kapp, stoxdox
China is the largest single market for Intel at 26% of sales in 2020. Keep in mind that sales into China represent the location of manufacturing demand and not necessarily end-market demand. This is not a surprise as China has become the heart of global manufacturing growth over the past decade. As can be seen by comparing the orange and the blue highlighted cells, Intel’s annualized growth rate in China decelerated rapidly in 2020. This remains a primary area of concern and will be a key trend to monitor going forward.
The China growth slowdown was matched by growth reacceleration in Singapore and Taiwan in 2020 (the yellow highlighted cells). This is likely due to a combination of COVID effects and production shifts away from mainland China in response to the regulatory crackdown. These trends point toward global resiliency for Intel which should lessen the China specific risks. With the US-centric foundry investments, the United States will become increasingly important going forward. This will provide Intel with enhanced operational optionality and substantially lessen the company’s geopolitical risk level.
Valuation: Sales Comparative Analysis
Positive forces are developing for Intel’s valuation multiple, including Intel’s core computing group operating with tail winds from the work from home trend and its implementation of a bold growth strategy. This contrasts with the past decade of underperformance which has exerted a powerful downward force on the valuation multiple of Intel.
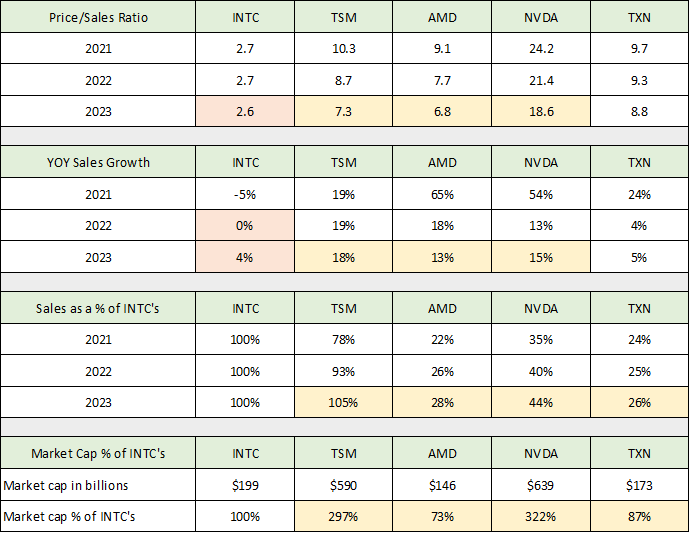
The most informative approach to an Intel valuation analysis is via comparison to its semiconductor peer group that was used for the research and development section. The following table was compiled from Seeking Alpha and displays the key data from the consensus revenue estimates for the five semiconductor companies: INTC, TSM, AMD, NVDA and TXN (I corrected the Taiwan Semiconductor data to reflect the proper share count). The key cells are highlighted below.
Source: Created by Brian Kapp, stoxdox
Using 2023 estimates, Intel trades at a massive discount to the group at 2.6x estimated sales versus 7x to 19x 2023 sales estimates for its peers. A lower valuation multiple is justified by Intel’s slower sales growth compared to the group (see the second section). The larger question revolves around the appropriate discount for Intel as it is a much larger company than its peers.
The size difference is evident in the third section of the table in which I compare the sales estimates for the peer group to that of Intel. Advanced Micro Devices and Texas Instruments are projected to generate only 28% and 26% of Intel’s total sales in 2023. Nvidia’s sales are projected to reach 44% of Intel’s by 2023. Taiwan Semiconductor is the only company projected to generate the same level of sales as Intel by 2023 coming in at 105%.
For a valuation comparison, please contrast the final highlighted row to the highlighted row in the third section of the table just discussed. Advanced Micro Devices and Texas Instruments are nearing Intel’s valuation at 73% and 87% of Intel respectively, while being expected to generate a quarter of Intel’s sales in 2023. Nvidia and Taiwan Semiconductor are valued at an extraordinary 3x that of Intel, while they are expected to produce substantially lower or equal sales in 2023.
The incredible valuation of Taiwan Semiconductor lends strong credence to Intel’s aggressive foundry growth strategy. The marketplace is signaling that the foundry business model is moving up the value chain as customized silicon capabilities are increasingly in high demand. With supply chains progressively becoming more vulnerable, a diversified foundry supply chain is likely to be a high priority for product manufacturers. The increasing value proposition of the foundry business combined with market demand for more diversified and resilient supply chains fully supports the investment case for Intel’s growth strategy.
Valuation: Earnings Comparative Analysis
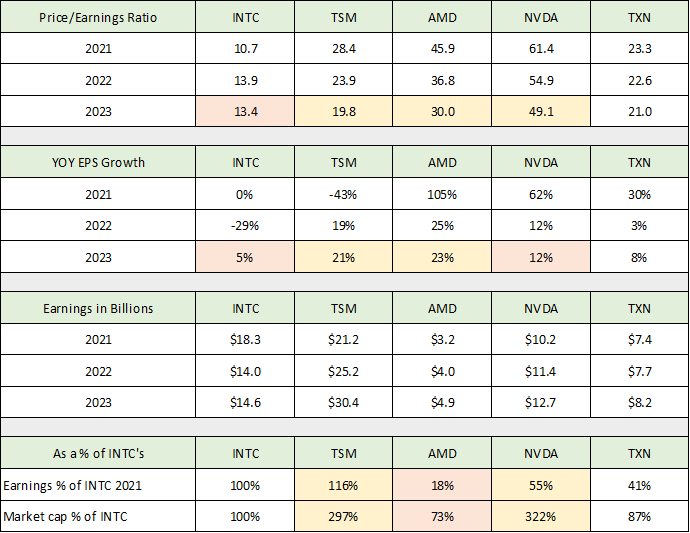
Intel’s foundry growth strategy receives further support from the earnings front. Taiwan Semiconductor is on pace to be the highest earner amongst the five companies in 2021 at $21 billion (see the third section of the table below), while producing only 78% of Intel’s revenue. The following table was compiled from Seeking Alpha and displays the consensus earnings estimates for each of the five companies through 2023. I have highlighted the most important cells. Intel remains at a large valuation discount to the entire group at 13x the 2023 consensus earnings estimate versus the group valuation range of 20x to 49x 2023 earnings estimates (see the first section of the table).
Source: Created by Brian Kapp, stoxdox
With Intel’s foundry investments coming online in 2024 and 2025 along with significant new product launches, the relative growth outlook in 2023 for Intel should be comparatively strong to the group. There is significant upside return potential from the upward valuation adjustment potential of Intel from 13x the 2023 consensus earnings estimate to the group average.
The last section of the table compares the earnings estimates for each company in 2021 to that of Intel as a percentage of Intel’s earnings. I then compare the market capitalization of each company as a percentage of Intel’s market value. The valuation differentials are at similar extremes based on earnings as was the case in the revenue valuation section above.
On the low end of the group, the 20x earnings valuation for Taiwan Semiconductor in 2023 is a reasonable upside target for the shares of Intel. The higher 20x 2023 earnings estimates for Intel should receive strong support from the enhanced growth outlook into 2024 and 2025. This potential valuation adjustment offers 50% return potential excluding the possibility of upside surprises to the subdued outlook for Intel through 2023.
In fact, Intel offers the potential for material positive surprises between 2021 and 2024. The Mobileye segment provides one example of this potential, offering a tremendous opportunity to participate in the growth of autonomous driving and the intelligent edge broadly speaking.
Mobileye
Mobileye has passed $1 billion of revenue for the first time through the first nine months of 2021 and is generating a strong 35% operating income margin. The strong profitability bodes well for future earnings growth. This is especially true when looking out from 2023 alongside the foundry and product launches into 2024 and 2025.
In this period the auto industry will be in full stride with pathways to autonomy built into the production plans of all major automotive OEMs (original equipment manufacturers). Tesla’s (NASDAQ:TSLA) public push for autonomy and industry trends look to benefit Mobileye substantially. Competitive pressure will force the transportation industry toward more advanced driver assistance systems or ADAS, and eventually full autonomy. Intel will be in a position with Mobileye to offer a full solution that sets the industry standard while remaining OEM agnostic.
Intel’s ability to offer a full intelligent driving solution was evidenced by its recent win with Chinese automaker Geely for the new Mobileye Supervision ADAS solution. The Geely win marks a milestone for Intel. It is the first relationship in which Mobileye will be responsible for the full solution stack, which includes hardware, software, driving policy, and control. Geely sold over 2.4 million cars in 2020. Intel’s traction with top tier auto manufacturers was further evidenced by its expanded relationship with Ford (NYSE:F) to provide Mobileye’s suite of EyeQ sensing technology in support of Ford’s Co-Pilot 360™ Technology driver-assist features.
All told, Mobileye is an early leader in the assisted and autonomous driving space with 25 global auto manufacturers adopting its technology across 49 product lines. For those interested, the following demonstration provides a sense of Intel’s Mobileye technology: Mobileye self-driving in NYC.
Technicals
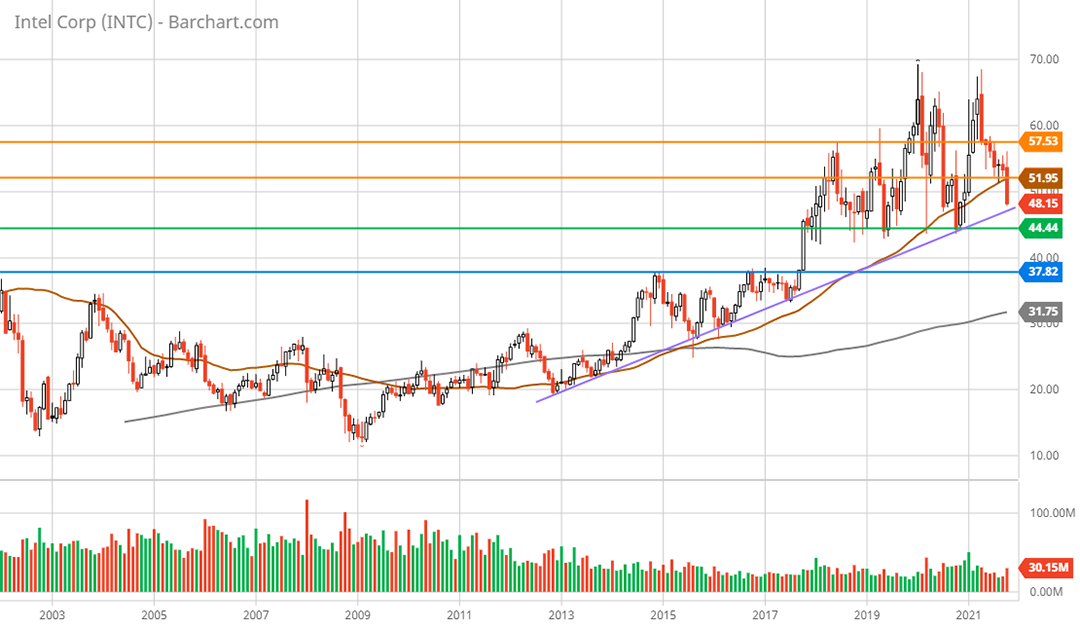
Intel’s incredibly low valuation multiple combined with solid performance from its core CCG segment and its above average 2.8% dividend yield should provide downside protection for the shares. The fundamental downside support receives further confirmation from Intel’s technical backdrop as can be seen in the following 20-year monthly chart. The horizontal lines represent key support and resistance levels.
Intel 20-year monthly chart. Created by Brian Kapp using a chart from Barchart.com
With the 11% selloff following the Q3 2021 earnings report, Intel is closing in on a strong support level near $44 (the green line). This level represents 10% downside risk from current levels and has served as a floor for the shares since 2017. This area should offer strong support going forward from both a fundamental and technical perspective.
The next lower support level is in the $38 area represented by the blue line. This served as key resistance between 2014 and 2017. If the green line fails to hold, this lower support area at the blue line looks likely to be a floor for the shares looking through both a fundamental and technical lens. This level represents 22% downside potential.
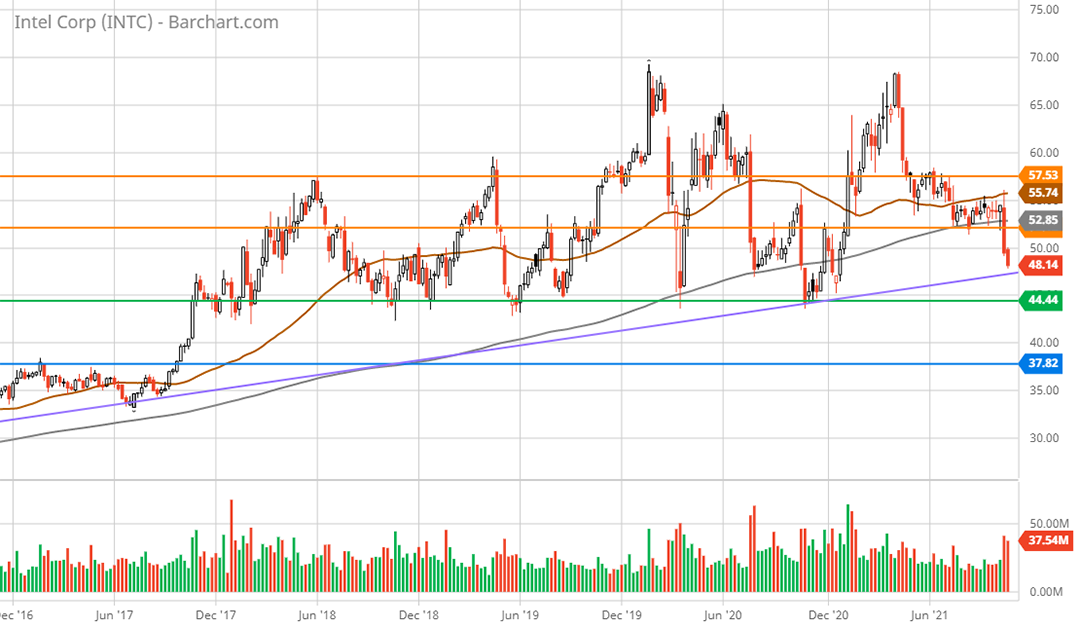
On the upside, major resistance is just above the current price between $52 and $58 and is represented by the orange lines. The 5-year weekly chart below provides a closer look.
Intel 5-year weekly chart. Created by Brian Kapp using a chart from Barchart.com
Above the upper orange line is all-time high resistance up to $70. The majority of the resistance is likely to exist below $60. A convincing move above $60 is likely to signal a breakout to all-time highs is unfolding for which there is no technical resistance. The $70 all-time high represents 43% upside potential. This is in the ballpark of the 50% upward valuation adjustment mentioned in the valuation section based on the depressed 2023 earnings estimate.
Further Upside Potential
The consensus 2023 earnings estimate is 20% below the 2021 earnings estimate of $4.51 per share. If Intel were to achieve its 2021 earnings level in the 2023 to 2024 time frame, alongside a phase shift to higher sustainable growth rates, the upside potential could become substantial. This is especially true when compared to the apparent downside risk of 10% to 22%. A 20x earnings multiple on the $4.51 earnings per share expected for 2021 offers 84% upside potential. Positive surprises on the innovation front or earnings front between 2021 and 2024 would amplify the risk/reward asymmetry.
Summary
Intel’s long stint of underperformance looks to be ending with its renewed focus on growth. The industry trends of the past decade which worked against Intel are now receding while the winds are shifting towards Intel’s core strength in research and development. The company’s aggressive growth strategy will leverage its core R&D strength. At the same time Intel is receiving broad commercial and governmental support in the drive toward a more resilient global technology supply chain. Intel offers an attractive low-risk, high-reward investment option for a broad spectrum of growth and income-oriented investors.
Price as of report date 10-31-21: $49
Intel Investor Relations Website: Intel Investor Relations

