I am assigning Robinhood Markets Inc. (NASDAQ: HOOD) a negative risk/reward rating based on its speculative revenue streams, the extreme volatility of its product revenue mix, and elevated risks to its business model. While the risks outweigh the rewards at the moment, Robinhood’s customer acquisition success has been eye-opening of late, making it worthy of investment consideration by all growth stock investors. In this article I breakdown the company’s performance across its various business lines and key performance indicators, thereby illuminating the primary areas of concern as well as the future opportunities.
Risk/Reward Rating: Negative
Robinhood became a household name in the investment world during the COVID era. Economic shutdowns combined with social distancing and record fiscal and monetary stimulus created a period of speculative frenzy in the financial markets. These were ideal conditions for a digitally savvy, engaging trading app to take market share and penetrate the new investor market segment. The company gained its fame by offering a simplified, user-friendly mobile app for stock and options trading. This slimmed down mobile interface attracted many new investors to the financial markets. In fact, the company estimates in its S-1 filed with the SEC that 50% of all new accounts are people with no prior investment experience.
Robinhood came public on July 29, 2021 and reported its first financial results as a public company after the market closed on August 18, 2021. Investors reacted negatively to the Q2 2021 earnings report sending the shares down over 6% the following day, which is where they remain today. Revenue growth was exceptional at 131% YOY (year-over-year). However, the manner in which this growth was achieved raises a red flag, which is where I’ll begin.
Revenue Mix: Speculative and Volatile
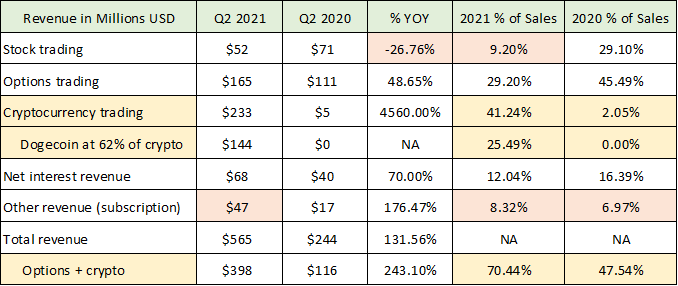
The following table breaks down Robinhood’s revenue by product category for Q2 2021 and Q2 2020. It was compiled from the Q2 2021 10-Q filed with the SEC. The table provides the growth rate YOY as well as the percentage of total sales derived from each of Robinhood’s product lines in Q2 2021 and Q2 2020.
The most speculative asset class in today’s market, cryptocurrencies, accounted for 41% of Robinhood’s total revenue in Q2 2021 compared to only 2% last year (first yellow highlighted row). In addition, Dogecoin, one of the most speculative cryptocurrencies, accounted for over 25% of total sales in Q2 2021 up from 0% last year.
The material revenue mix shift towards increased speculative activity on Robinhood’s platform is a negative development from a business model perspective. It points toward a lower valuation multiple being applied to Robinhood’s shares. I say this because business models that rely on transaction-based revenue, rather than fee- or subscription-based revenue, are much more volatile and risky businesses which garners them a lower valuation multiple on earnings and sales. Furthermore, when one adds Robinhood’s options trading revenue to the crypto mix, a full 70% of revenue (final shaded row) is being derived from the most speculative corners of the financial markets. This is up from 48% in Q2 2020.
Stock trading revenue actually posted a 27% decline compared to Q2 2020. This is surprising given the bull market over the past year. In a period of record retail participation, one would have expected revenue from the stock trading business to have continued to grow alongside the stock market. As a result, the 27% decline in stock-based revenue raises an eyebrow toward the engagement level of Robinhood users who have already completed their initial trading activity as new customers.
Customer Engagement and New Account Quality
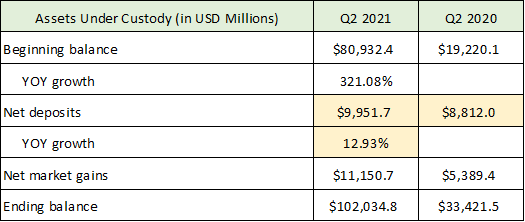
The possible engagement slowdown thesis is further evidenced by the meager new deposit growth in Q2 2021. Robinhood’s existing customers do not appear to be materially adding funds to their accounts. The following table was compiled from data in the most recent S-1 filed with the SEC.
Net deposits grew only 13% in Q2 2021 compared to Q2 2020 (yellow shaded rows). Over the same time the number of funded accounts on the platform grew by 130%. One would expect these two growth rates to track one another more closely. It could be that the quality of the new funded accounts in Q2 2021 and the quality of the 131% revenue growth are much lower than in the past (much smaller account balances and thus new deposits). This theory is supported by an estimation of the average new account size.
The following table was compiled from data in Robinhood’s S-1 and Q2 10-Q filed with the SEC. It is an oversimplification as it assumes all net deposits are from new accounts in each period. Nonetheless, the relative values are likely to be a good estimation of the new account size trends.
The rapidly declining new account size thesis is also supported by the revenue mix trend toward cryptocurrencies (Dogecoin in particular) and heightened options trading activity. Each of these investments is likely to involve a smaller account size on average than a stock trading account. The discrepancy between the growth rate of new clients (130%) and revenue (131%) compared to the growth rate of net deposits (13%) appears to be well explained by the combination of lower quality customer acquisition and declining engagement by pre-existing customers.
It is critical for investors to track the engagement on Robinhood’s platform. One of the most important revenue categories looking forward is the subscription business (Robinhood Gold is the primary source of revenue in the other category). This is important because the subscription-based business model would be awarded a higher valuation multiple on earnings and sales than the current transaction-based model.
In this light, subscription revenue was up an impressive 176% YOY to $47 million (final orange shaded row in the first table). However, it remains only 8% of the total Robinhood business, which is not much changed from 7% last year. Subscription revenue will be the most important performance indicator to monitor for Robinhood in future earnings reports. A material acceleration in subscription revenue would indicate increasing customer engagement while making for a more attractive business model and investment case.
The massive business mix shift toward highly speculative and volatile products is a red flag for the sustainability of Robinhood’s current business model. This is especially true in regard to its customer acquisition strategy. The red flag receives confirmation from the trend toward materially smaller new account balances, lower customer engagement and stagnating deposit growth, and customer acquisition being highly correlated with the most speculative of investor flows.
Account Growth and Customer Churn
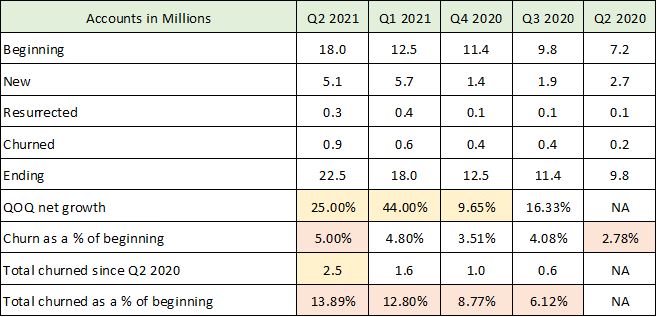
The questions raised about the sustainability of Robinhood’s business model by the revenue volatility over the past year are beginning to be echoed by its user statistics. The following table breaks down Robinhood’s total number of accounts for each of the past five quarters. The table was compiled from Robinhood’s S-1 and Q2 10-Q filed with the SEC. The stats include the beginning number of funded accounts for each quarter, the new accounts added, $0 or negative balance accounts that were resurrected, accounts that fell to $0 or a negative value (churned), and ending accounts for the quarter.
It is clear that Robinhood has been remarkably successful at growing its user base as can be seen in the QOQ (quarter-over-quarter) growth rate of funded accounts (first yellow shaded row). The company ended Q2 2021 up 130% with 22.5 million funded accounts compared to 9.8 million in Q2 2020. What is not obvious is that Robinhood is beginning to churn its customer base at increasing rates (final row shaded in orange).
For example, over the past year Robinhood has churned a total of 2.5 million accounts (second yellow shaded row) or nearly 14% of the company’s total customers at the beginning of Q2 2021 (final row). The churn rate is trending upward materially. Additionally, the company churned 5% of its customers in Q2 2021 versus the 2.78% churned in Q2 2020 (first orange highlighted row). The churn rate doubled year-over-year.
The accelerating customer churn ties back to the volatility in the mix of Robinhood’s product category revenue. This rapid turnover of products being traded on the platform is the very definition of churning in the financial industry. The growing churn rate also raises questions about how Robinhood has been so successful in acquiring new customers.
For example, in Q2 2021 the majority of Robinhood’s new accounts were opened to trade cryptocurrencies. In addition, over 60% of all funded accounts traded cryptocurrencies (from the Q2 8-K earnings release and conference call). Remember, 62% of Robinhood’s cryptocurrency business was in Dogecoin during the quarter. Most cryptocurrencies suffered price collapses as the quarter unfolded. This suggests the churn rate may continue to spike if customers take heavy losses.
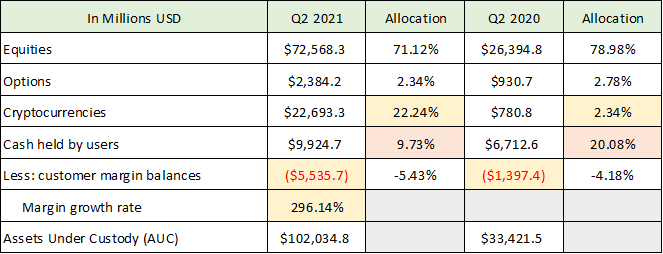
The strategy of acquiring new customers to invest in the latest hot trends carries incredible risk and liability for a financial services firm. A measure of Robinhood’s growing appetite for speculation can be seen in the asset allocation of its client base. The following table was compiled from the company’s most recent S-1 filed with the SEC.
I have highlighted the most important shifts over the past year. There are three primary changes in Robinhood’s business. 22% of client assets are now in cryptocurrencies up from 2% last year. Client cash levels are now under 10% compared to 20% last year. Finally, Robinhood has grown its margin lending business by nearly 300% with client margin balances swelling to $5.5 billion.
It should be noted that Robinhood gained nearly half of its total customers in just the first six months of 2021. 5.7 million were acquired in Q1 2021 during the meme stock and cryptocurrency craze. 5.1 million were acquired in Q2 during the cryptocurrency blowoff top. Both episodes were followed by a general price collapse in each asset group. The most popular stocks peaked in February 2021 followed by cryptocurrencies peaking in April 2021.
The 27% decline in stock trading revenue in Q2 2021 followed the February speculative stock peak. There is considerable risk that cryptocurrency trading revenue will follow a similar trajectory following the April 2021 cryptocurrency peak. If the trend toward declining revenue after speculative peaks continues, it will place added pressure on Robinhood’s already slowing revenue growth and profitability.
Declining Profitability
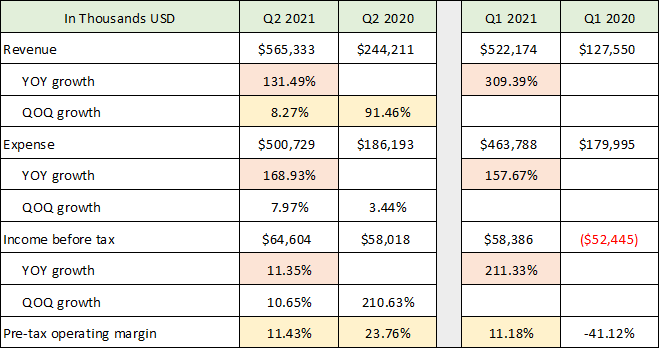
Returning to the financial performance in Q2 2021, Robinhood’s profit margins declined materially compared to Q2 2020. The following two tables were compiled from the company’s S-1 and Q2 10-Q filed with the SEC. The intent is to highlight Robinhood’s key business and profitability trends.
Robinhood’s revenue growth rate is slowing considerably from 309% in Q1 2021 to 131% in Q2 2021. Looking at sequential revenue growth, Q2 2021 revenue grew just 8% compared to Q1 2021 while Q2 2020 revenue grew 91%. Revenue growth, while impressive, is declining rapidly and is showing signs of being much lower quality growth as discussed above.
Turning to profitability, Robinhood’s operating income margin collapsed from 24% in Q2 2020 to 11% in Q2 2021 (final row). This 11% pre-tax margin has been the norm during the first half of 2021. While the first half of 2020 showed a dismal margin overall, Q1 2020 was heavily impacted by the COVID crash and freeze up in the financial markets. The markets normalized in Q2 2020 which makes Q2 2020 a better comparison for profitability trends (24% down to 11%).
The contracting profit margin trend is also evidenced in the company-provided adjusted EBITDA (earnings before interest taxes depreciation and amortization) numbers in the table below.
On this basis, the margin contraction is from 26% in Q2 2020 to 16% in Q2 2021 (final highlighted row). Given the rapid growth in new customer accounts, one would expect Robinhood to achieve operating leverage from the increased users on its platform. In fact, with a scalable cloud-based platform and revenue growth of 131% in Q2 2021, one would expect profit margins to grow materially rather than to shrink by half.
The sources of the profit margin contraction have been highlighted in the following table which was compiled from the company’s most recent S-1 filed with the SEC (1H stands for first half).
Each of the highlighted expense categories is growing much more rapidly than the 131% revenue growth. I expect these cost trends to continue based on the strategy management outlined on the Q2 earnings conference call. On the call, the company described its mission as follows: “Our intention is to be the single money app for our customers, the single place for all things money.” This financial supermarket approach will require substantial investments across all of the above-highlighted categories, as well as the likelihood for materially higher marketing expenditures.
This vision also contrasts with Robinhood’s business success to date. The company gained traction with users by offering a simplified, user-friendly trading app rather than a financial supermarket app for all things money. This discrepancy between the current vision and the success that Robinhood has achieved to date is evident in the above analysis and is beginning to show in many of the firm’s key financial statistics. The business model risk is evidenced by the rapidly rising cost trends, declining profitability, increasing customer churn, and wildly volatile revenue mix.
Other Concerns
Additionally, the company will face extraordinary competition for the broad “all-things money” approach. Robinhood will have to compete with the likes of Square, PayPal, and Coinbase to name a few technology-focused competitors. The company will also face intense competition from the plethora of broad-based, blue-chip financial competitors such as Morgan Stanley, Merrill Lynch, Goldman Sachs, and Charles Schwab.
Finally, Robinhood has recently been investigated and fined by regulators and is a party to many active legal and regulatory inquiries. As a result, the company is facing heightened costs to implement proper compliance controls and customer service capability to meet industry standards.
With all signs pointing toward a continuation of the upward cost trends and revenue looking likely to remain volatile and possibly enter a sequential decline, the valuation of Robinhood takes on heightened importance.
Valuation and Outlook
Robinhood is currently valued at $38.8 billion. Using the company-provided adjusted EBITDA number of $343 million over the past twelve months, the valuation stands at 113x this adjusted operating income figure. Using the reported operating earnings before tax through the first half of 2021 and annualizing it, the valuation stands at 158x pre-tax operating earnings. Finally, annualizing the first half 2021 revenue leads to a valuation of 18x sales. Each of these valuation multiples are extreme from a historical market perspective. From a current relative valuation perspective, Robinhood is priced well outside of the current averages which range from 22x to 32x expected 2021 earnings (S&P 500: 22x, Nasdaq 100: 29x, and Russell 2000: 32x).
The company was unable to provide financial guidance for Q3 2021 and the remainder of the year due to the underlying volatility in the business. Management did project that trading activity and sales would decline in Q3 2021 compared to Q2 2021. This sequential revenue contraction guidance lends credibility to annualizing the first half 2021 figures to arrive at annualized figures for valuation purposes.
Special Risk Factors
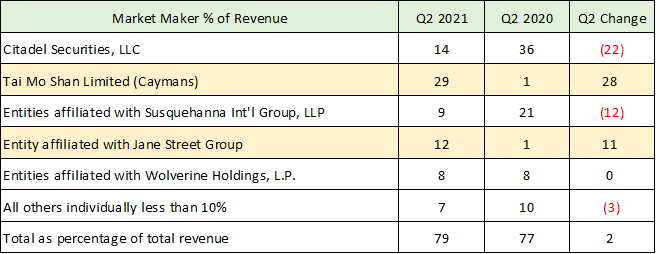
There are several risk factors that add to the elevated valuation and business model risk. The revenue mix shift toward cryptocurrencies has led to changing counterparty (market maker) exposure for Robinhood. Robinhood receives money from market makers for its customer order flows rather than charging its customers commissions. Given the unregulated nature of the cryptocurrency markets to date, it is safe to say that the company’s counterparty risk has increased. The following table is compiled from the recent S-1 filed with the SEC and details Robinhood’s exposure to key counterparties as a percentage of the company’s total revenue.
While the counterparties are more diversified in Q2 2021 compared to Q2 2020, the risk level has risen given the systemic backing provided to the stock and options market, and thus by extension the market makers in these traditional investment assets. The cryptocurrency market makers (yellow shaded rows) lack systemic backing of the cryptocurrency markets in the event of a cascading market failure. This counterparty shift raises Robinhood’s business risk which should place pressure on its valuation premium potential.
Supply and Demand Imbalance
Another acute risk factor near term relates to the lockup period for Robinhood shareholders. As part of the IPO process, Robinhood stockholders became subject to various lockup periods which prevented them from selling shares. Just over 6% of the total shares were sold as part of the IPO leaving a massive supply overhang. The lockups are largely set to expire by year end 2021. This is opening the door to a massive increase in the supply of shares that could hit the market compared to the current public share float, a potential 10x plus increase according to the recent S-1. Given the business trends and challenges discussed here, this could create a supply-demand imbalance for the shares if demand is weak.
Technicals
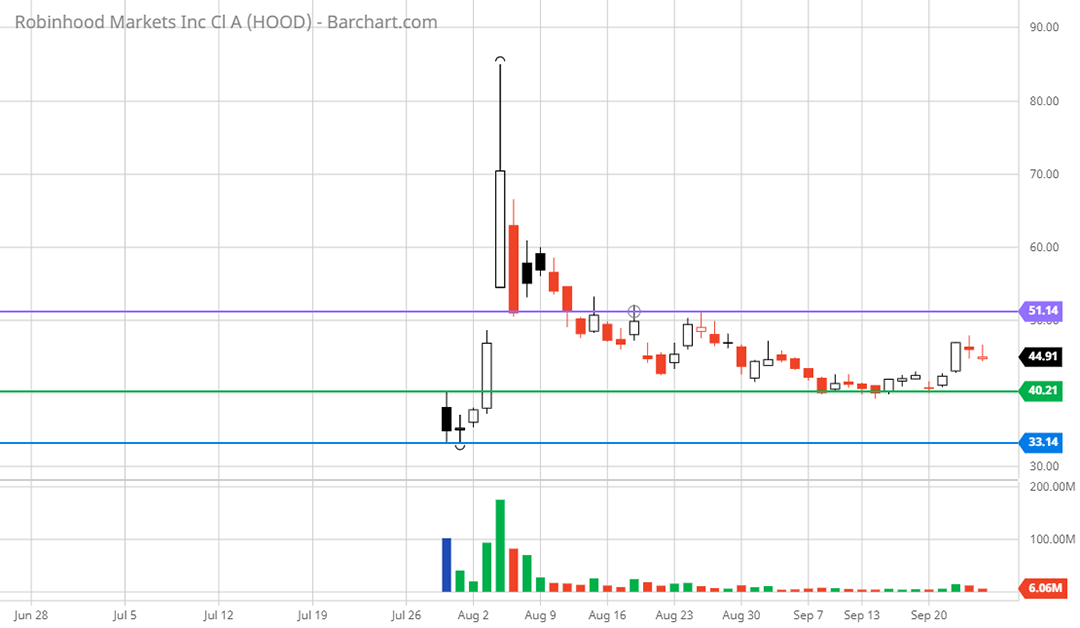
The potential supply-demand imbalance naturally leads to a discussion of the technical setup for the shares. Robinhood came public on July 29, 2021 and has been trading for less than one quarter. As a result, technical analysis provides little color here. That being said, there are three well-defined trading levels highlighted by the horizontal lines on the following chart.
The stock closed the first day of trading near $34 and proceeded to make a speculative meme-induced run to $85 before collapsing. The meme-induced gap higher and collapse formed an important resistance zone near $51 (purple line) which has been the ceiling on all rallies since. The stock has also formed support at $40 (green line) then at $33 (blue line) which is the all-time low.
Given the negative business trends, the elevated valuation, and the potential supply-demand imbalance, it is highly likely that the first attractive entry point for Robinhood shares lies materially below the all-time low of $33 (blue line).
Summary
Robinhood has demonstrated that its core competency is the ability to attract large numbers of new users in a condensed period of time. This competitive advantage speaks to the possibility that the company could offer explosive growth potential. As a result, Robinhood should be on the watchlist of all growth stock investors. That being said, the company’s core strength could turn into a liability if the speculative fervor comes out of the cryptocurrency and stock options market.
Robinhood acquired the vast majority of its customers over the past year, and nearly half of its customers were acquired in 2021 alone. The risk to Robinhood is that this time period was the most speculative market environment since the late 1990’s stock market bubble. If market psychology shifts leading to a substantial correction in stock and cryptocurrency prices, Robinhood’s customers could experience large and prolonged losses. This would likely lead to a material reduction in customer trading activity and Robinhood’s revenue at a time of exploding costs and an intensifying regulatory crackdown.
The risks outweigh the rewards for Robinhood at the current elevated valuation. The increasingly speculative and volatile nature of the company’s revenue streams combined with the growing trend towards churning its client base are major red flags. As a result, the first attractive entry point for the shares looks to be materially lower than the all-time low of $33.
Price as of this report 9-27-21: $45.76
Robinhood Investor Relations Website: Robinhood Investor Relations


