
Risk/Reward Rating: Negative
Robinhood has become somewhat of a household name over the past year, which has been a period of speculative frenzy in the financial markets. The company gained its fame by offering a simplified, user-friendly mobile app for stock and options trading. This slimmed down mobile interface attracted many new investors to the financial markets. In fact, the company estimates that 50% of all new accounts are people with no prior investment experience.
Robinhood reported its first financial results as a public company last evening. The stock was down 8% in midafternoon trading in reaction to the Q2 2021 earnings report. In fact, the Q2 report created more questions than answers for prospective and existing Robinhood investors. The questions revolve around the company’s business model. On the conference call discussing the Q2 results, the company described its mission as follows: Our intention is to be the single money app for our customers, the single place for all things money.
This vision contrasts with Robinhood’s business success to date as discussed in the opening paragraph. The company gained traction with users by offering a simplified user-friendly trading app rather than a financial supermarket app for all things money. This discrepancy between the current vision and the success Robinhood has achieved to date is beginning to show in many of the firm’s key financial statistics. It is worthwhile to consider each in turn.
Revenue Mix Volatility
The following table breaks down Robinhood’s revenue by source or product category for Q2 2021 and Q2 2020. It provides the growth rate year over year (YOY) as well as the percentage of sales derived from each category in each period.
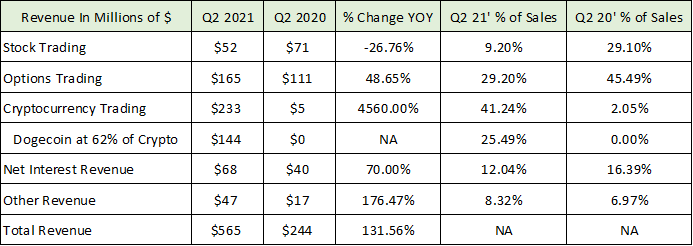
What immediately jumps out is the sheer volatility of each category from Q2 2020 to Q2 2021. For example, revenue derived from stock trading plunged from 29% of sales in Q2 2020 to only 9% in Q2 2021. Similarly, options trading revenue plunged from 45% of sales in 2020 to 29% in 2021. The two combined have gone from dominating Robinhood’s business at 75% of revenue to being only 38% in Q2 2021.
Even more extreme, cryptocurrency has gone from being only 2% of sales in Q2 2020 to being by far the largest source of sales for Robinhood at 41% in the just completed quarter. Most concerning, the majority of the crypto trading business (62%) was in Dogecoin which was created as a joke and turned into a speculative craze when Elon Musk began to tweet about it this year.
These massive business mix shifts as well as the shift toward highly speculative, low quality, gambling-like vehicles is a clear red flag for the sustainability of Robinhood’s business model. It should be noted that three of the most speculative financial vehicles in existence, cryptocurrencies, margin lending, and options (derivatives), comprised over 75% of Robinhood’s revenue in Q2 2021
Account Growth and Customer Churn
The questions raised about the sustainability of Robinhood’s business model by the revenue volatility over the past year are beginning to be echoed by its user statistics. The following table breaks down Robinhood’s total number of accounts for each of the past five quarters. The stats include the beginning number of accounts for the quarter, the new accounts added in the quarter, dormant accounts that were resurrected, lost accounts (churned), and ending accounts.
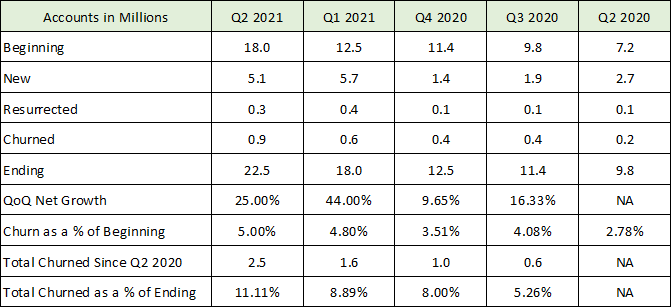
What first jumps out is that Robinhood has been remarkably successful at growing its user base, ending Q2 2021 with 22.5 million accounts compared to 9.8 million in Q2 2020. What is not obvious is that Robinhood is beginning to churn its customer base at increasing rates. For example, over just the past year the company has churned (lost) a total of 2.5 million accounts or over 11% of the company’s total current customers. Additionally, the company churned 5% of its customers in Q1 2021 (Churn as a % of Beginning) versus 2.78% churn in Q2 2020. The churn rate doubled year over year.
While many industries experience rapid churn within just one year, the financial services industry is not one of them. People leave when they are unhappy with the service. When you are dealing with people’s money, this unhappiness carries incredible risk and is usually tied to losing money.
The accelerating customer churn ties back to the volatility in the mix of Robinhood’s revenue by product category. This rapid turnover of products being traded is the very definition of churning in the financial industry. It also raises questions about how Robinhood has been so successful in acquiring new customers.
For example, in Q2 2021 most of Robinhood’s new accounts were opened to trade cryptocurrencies (their first trade). Remember, 62% of these cryptocurrency trades were in Dogecoin. During Q2 2021, most cryptocurrencies suffered price collapses as the quarter unfolded. This suggests the churn rate may continue to spike if customers continue to take heavy losses.
The trend toward acquiring new customers to invest in the latest fad carries incredible legal liability for a financial services firm. Robinhood has acquired half of its total customers in just the first six months of 2021. 5.7 million were acquired in Q1 2021 during the meme stock and cryptocurrency craze. 5.1 million were acquired in Q2 during the cryptocurrency blowoff top, which was followed by a price collapse (along with the prices of the most speculative stocks in the market).
Declining Profitability
Returning to the financial performance in Q2 2021, Robinhood’s profit margins declined considerably compared to Q2 2020. The following table shows the company’s operating income before tax and its percentage of revenue (margin) for Q2 and the first half (1H) of both 2021 and 2020.
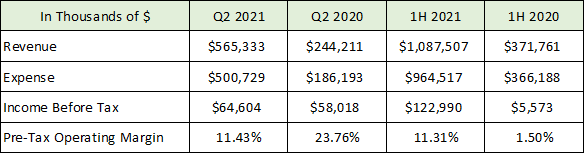
Robinhood’s margins collapsed from almost 24% in Q2 2020 to just over 11% in Q2 2021. This 11% pre-tax margin has been the norm during the first half of 2021. While the first half of 2020 showed a dismal margin overall, Q1 2020 was heavily impacted by the COVID crash and freeze up in the financial markets. The markets normalized in Q2 2020 which makes Q2 2020 a better comparison of profitability.
The rapidly declining margin trends are evidenced in the company-provided adjusted EBITDA (earnings before interest taxes depreciation and amortization) numbers as well.
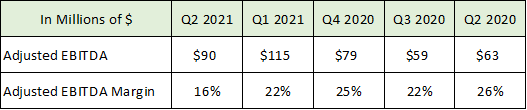
Here, the margin contraction is from 26% in Q2 2020 to 16% in Q2 2021. Given the rapid growth in customer accounts, one would expect Robinhood to achieve operating leverage from the increased users on its platform. In fact, with a scalable platform and revenue growth of 132% in Q2 2021 compared to Q2 2020, one would expect profit margins to grow materially rather than to shrink by half.
The declining profitability likely ties back to the volatile revenue mix as the profit margins on cryptocurrency appear to be much less than other products for Robinhood. Additionally, Robinhood has been recently investigated and fined by regulators for certain business practices. The company is facing heightened costs to implement proper compliance controls to meet industry standards.
Valuation and Outlook
Robinhood is currently valued at $38.4 billion. Using the company provided adjusted EBITDA number of $343 million over the past twelve months, the valuation stands at 112x this adjusted figure. Using the reported operating earnings before tax through the first half of 2021, and annualizing it, the valuation stands at 156x pre-tax operating earnings. Finally, annualizing the first half 2021 revenue leads to a valuation of 18x sales. Each of these valuation multiples are extreme from a historical market perspective.
The company was unable to give a financial projection for Q3 2021 and the remainder of the year due to the underlying volatility in the business. Management did project that trading activity and sales would decline in Q3 2021 compared to Q2 2021, lending credibility to the valuation metrics above using annualized figures from the first half of 2021.
The inability to forecast the business, the extreme volatility of the revenue mix, the accelerating customer churn, the declining profit margins, and the reliance on extraordinarily risky products such as crypto (Dogecoin) and derivatives, leaves more risk than potential reward on the table for Robinhood stock at this time. The additional regulatory risk bearing down on the company and the cryptocurrency industry completes the mosaic.
Technicals
Technical backdrop: Robinhood came public on July 29, 2021, leaving less than one month of trading history. As a result, technical analysis provides little color here. The stock closed the first day of trading near $34 and proceeded to make a speculative meme induced run to $85 before collapsing. The IPO price was $38 which stands as an important psychological level. It should be noted that Robinhood’s stock has a small number of shares traded publicly at this time, making it susceptible to meme induced volatility and manipulation.

Robinhood daily chart
Technical resistance: The $47 to $50 area should offer resistance as this was the gap up area in the speculative blowoff to $85.
Technical support: The $38 IPO price is a psychological support level. After this, new all-time lows are likely to be tested with no visible support given the short trading history.
Price as of this report 8-19-21: $46
Robinhood Investor Relations Website: Robinhood Investor Relations
All data in this report is compiled from the Robinhood investor relations website and SEC filings, and where applicable publicly available information regarding consensus earnings estimates.