I am assigning Barrick Gold (NYSE:GOLD) a positive risk/reward rating based on the bullish fundamental and technical backdrop for copper and gold, and Barrick’s leadership position within the mining sector. Additionally, the portfolio diversification benefits of adding copper and especially gold to one’s investment portfolio are well documented and point toward investors having a sizeable weighting to lower portfolio volatility and increase expected returns. Barrick’s position as an industry consolidator with many attractive investment opportunities combined with the company’s strong balance sheet, free cash flow generation, and attractive valuation complete the picture.
Risk/Reward Rating: Positive
Shares of Barrick Gold and most of the gold mining industry have been in a bear market or overall sideways trend for the better part of two decades. The first decade of this trend featured an explosive bull market in gold and copper prices, rising over 500% and 400% respectively. This bull market phase caused excitement in the mining industry and created an upward trend for these stocks. Caught up in the excitement, the mining companies lost their financial discipline and became overleveraged in their pursuit of growth opportunities.
When commodity prices peaked in 2011, the mining stocks entered a brutal bear market which finally bottomed in 2015. Since 2015 the stocks have been basing sideways unable to sustain a renewed uptrend due to the overleveraged balance sheet hangover from the prior bull market.
Over the past five years Barrick has created one of the strongest financial positions in the industry, with cash in excess of $5 billion and zero net debt after cash. The company is now the second largest gold producer in the world after Newmont (NYSE:NEM). In addition to its regular dividend yielding 1.89%, the company is returning an additional $750 million to shareholders in 2021 for a total yield of over 4% at the current share price.
Financial Strength
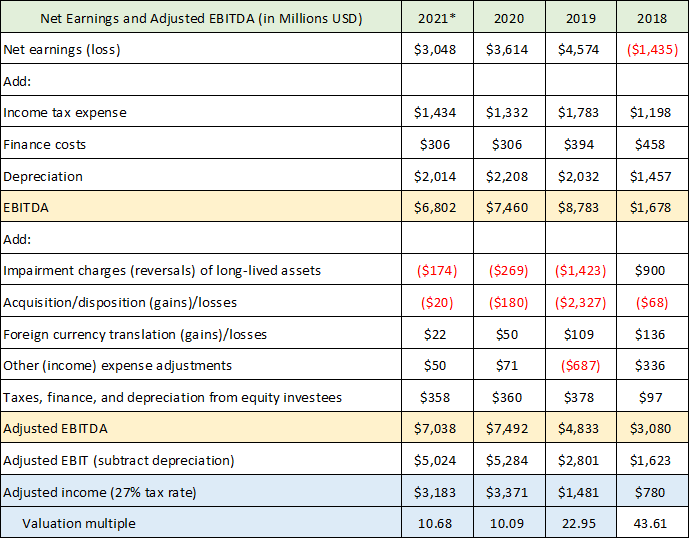
In the current commodity price environment, this additional yield appears to be sustainable as evidenced by the following table. The table was compiled from Barrick’s Q2 2021 earnings release and Q4 2020 earnings release filed with the SEC (2021* represents 2021 first half results annualized).
Source: Created by Brian Kapp, stoxdox
I have highlighted the pertinent cells which outline Barrick’s cash flow and my estimate of the company’s underlying earnings trend. The second yellow highlighted row is Barrick’s reported adjusted EBITDA (earnings before interest taxes depreciation and amortization). Due to Barrick’s large non-cash asset impairments and reversals in response to commodity prices, the adjusted EBITDA figure is a more accurate measure of operating cash flow than is reported EBITDA. On this count Barrick is producing in the neighborhood of $7 billion of operating cash flow in 2020 and into 2021. With a market value of $33.8 billion, Barrick is trading at 4.8x the $7 billion adjusted EBITDA figure.
The mining industry requires heavy investment in property, plant, and equipment which renders depreciation a real expense as the assets must be maintained. To arrive at an estimate of underlying earnings power or free cash flow potential, I subtract depreciation from the company’s adjusted EBITDA figure. Barrick is guiding capital expenditures to a high estimate of $2.1 billion for 2021. This is in line with the depreciation level over the past three years and supports treating it as an expense in its entirety. I then subtract the company’s interest expense, $306 million annualized, and apply a 27% tax rate (the 2020 tax rate). The resulting adjusted income figure and the current valuation are highlighted in blue.
The adjusted income estimate looks to be in the area of $3.2 billion. When one subtracts the regular annual dividend payment of $640 million, the company has a potential $2.56 billion of discretionary cash flow for growth investments or additional shareholder distributions. The $750 million special dividend in 2021 certainly looks to be sustainable in the current environment. It is interesting that Barrick chose this route for its excess cash flow in 2021 rather than pursue growth opportunities for which there are many options. The choice to distribute excess cash rather than invest for growth is likely a remnant of the prior bull market cycle hangover and bear market mentioned above.
Barrick’s choice not to engage in risky growth investments is reflective of an industry-wide conservatism in the current cycle. The lack of new mine investment will continue to restrict supply as the lead time to bring new mines online is substantial. This dynamic is bullish for underlying commodity prices. It points toward sustained and materially higher prices being necessary to compensate miners for the time and price risks they must take to bring on material new supply over the course of decades.
Commodity Price Backdrop
Before proceeding further with the Barrick investment case, it is important to establish where we are in the commodity price cycle. The company’s two products are gold and copper. By my estimates, Barrick is trending toward 75% of its income coming from gold and 25% from copper. In each case the fundamental and technical backdrops look to be bullish.
Gold Backdrop
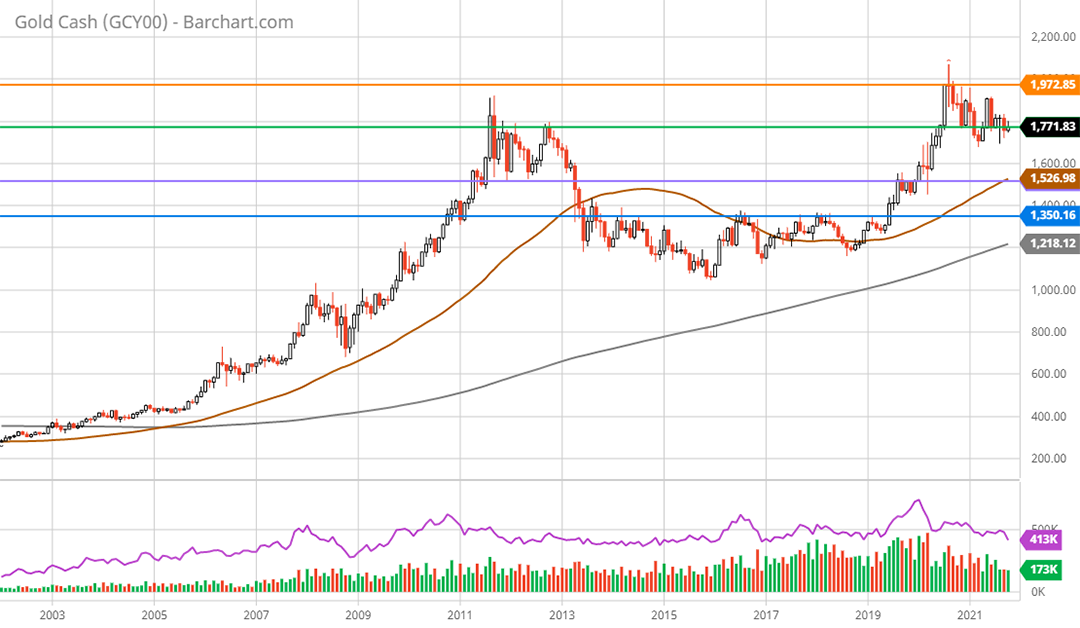
As mentioned above, gold supply fundamentals are bullish for the price of gold given industry conservatism in response to the prior cycle. Investment in new supply is subdued at the moment. Looking at the 20-year monthly gold price chart below confirms the bullish setup.
Gold 20-year monthly chart. Created by Brian Kapp using a chart from Barchart.com
The price of gold has established a near perfect 10-year cup and handle pattern as can be seen above. In fact, the price surged to a new all-time high near $2,075 per ounce in August 2020. This suggests the price of gold is building upside energy for a breakout from the 10-year sideways cup and handle pattern.
There are four well-defined support and resistance levels that have been carved out over the past decade represented by the horizontal lines. All-time high monthly resistance is represented by the orange line. A breakout above this level near $2,000 would signal a resumption of the uptrend that began in September 2018.
The price is currently sitting on support near $1,770 (the green line) which represents monthly all-time high resistance from 2011 and 2012. If gold finds strong support here and breaks out to the upside, the read though would be extraordinarily bullish.
The next lower support level is at $1,526 (the purple line) which was resistance throughout 2019. It would not be surprising if a retest of this level occurs. A retest of the $1,500 area would likely serve as a wash-out event and create a potential high-energy slingshot move to the upside. This level should offer very strong support.
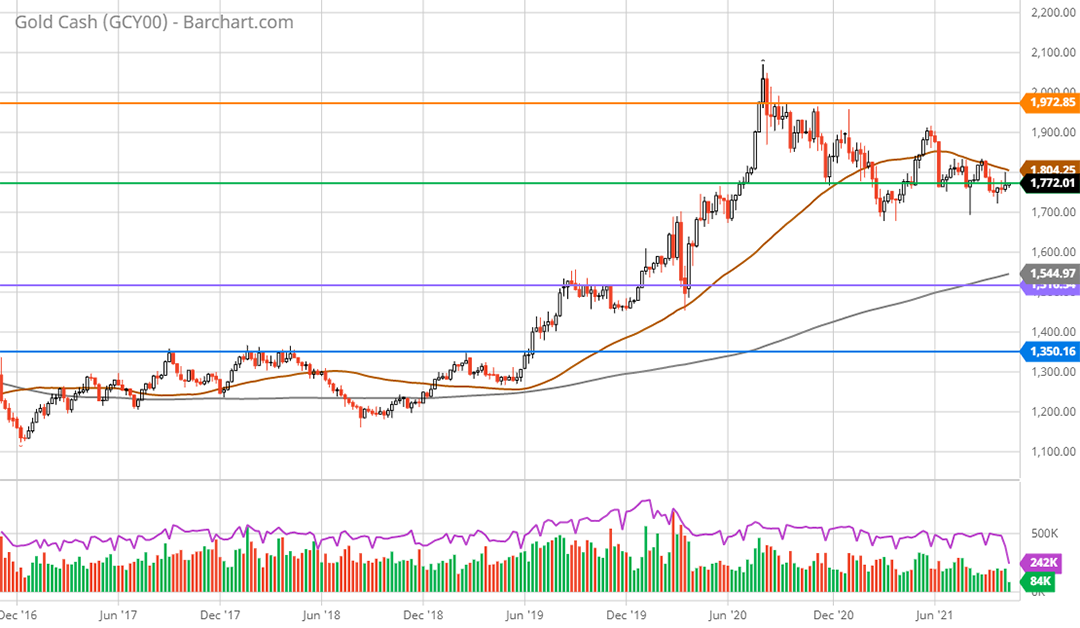
The worst-case scenario appears to be down to support at $1,350 (the blue line). This should provide a floor because gold supply would likely shrink quickly as marginal mines would begin to become unprofitable. This was the level from which the current gold uptrend was established. A better view of the current primary trend is visible on the 5-year weekly chart below.
Gold 5-year weekly chart. Created by Brian Kapp using a chart from Barchart.com
As can be seen on the weekly chart the primary trend for gold is up. The current bull market became official with the break above the key level of $1,350 in June 2019. The first leg of the current bull market peaked in August 2020 at $2,075 for a 54% advance. $1,700 per ounce represents a 50% retracement of this initial bull market leg higher while $1,575 represents a two-thirds retracement. These are common retracement amounts and lend credibility to the key support levels of $1,770 and $1,526.
Copper Backdrop
Similar to the gold industry, the copper mining industry has also been in a bear market or overall sideways trend for the better part of two decades. This has led to similar industry conservatism toward taking the risk of building new mines with incredibly long lead times. The lack of supply growth creates a bullish fundamental case for the price of copper. Copper has the added benefit of facing a supply shortfall in later years as the electrification of industry and transportation takes its toll on existing supply.
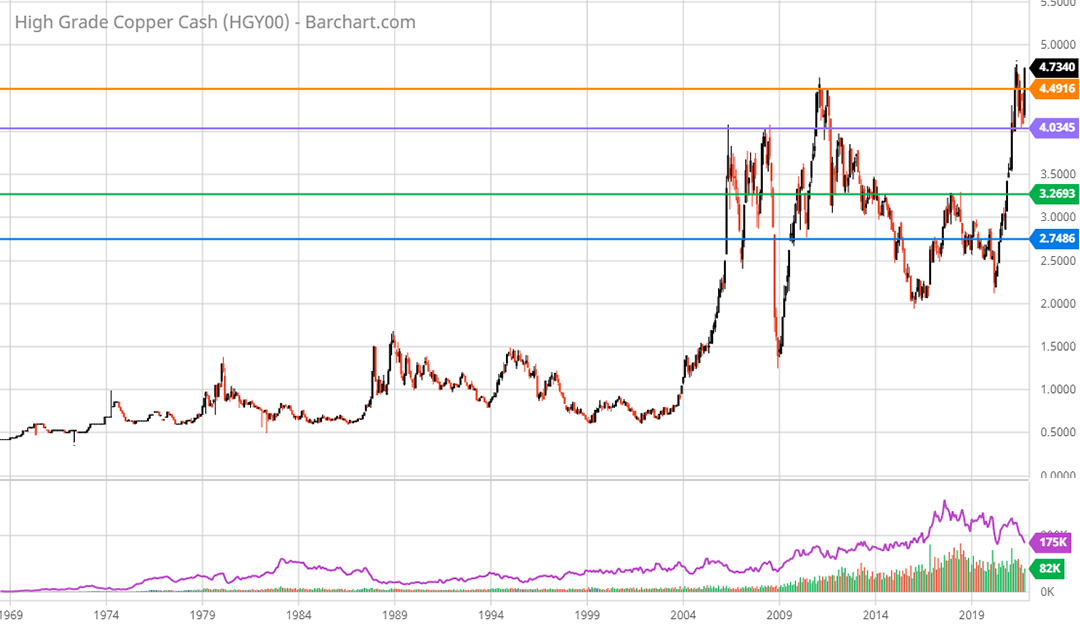
While gold has formed a perfect, well-controlled bullish cup and handle, copper has formed a bullish pattern in a much more volatile fashion as can be seen in the following long-term monthly copper chart.
Copper maximum monthly chart. Created by Brian Kapp using a chart from Barchart.com
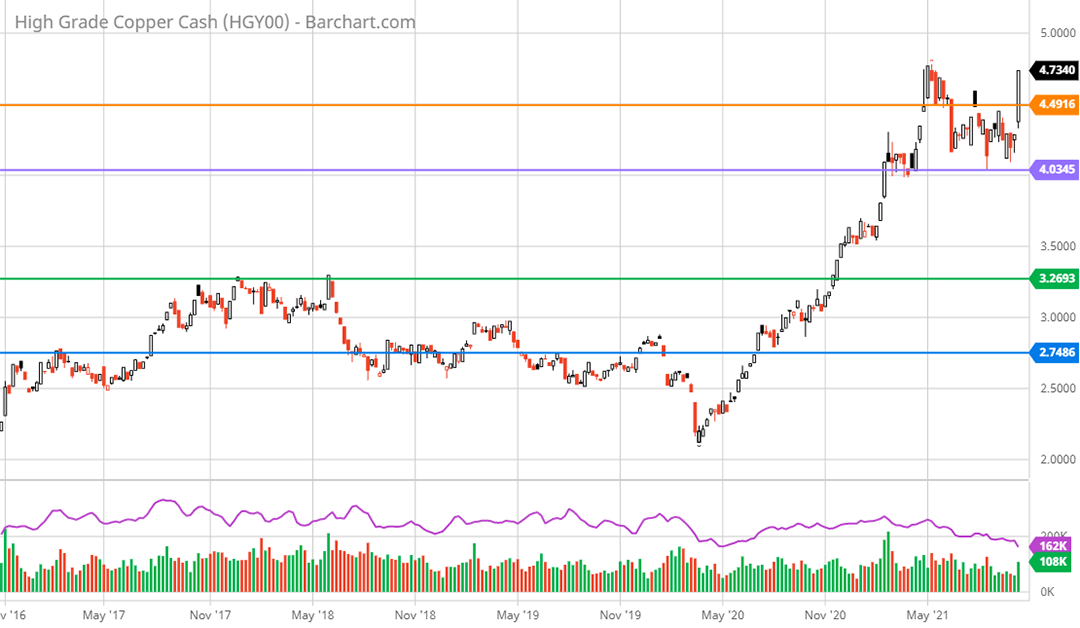
Copper has staged an incredible 100% rally off the bottom in 2020, carrying the price to all-time highs. The explosive uptrend is reminiscent of the one that began in 2003, which culminated in a peak during 2008 (a marginal new high was set in 2011). The horizontal lines represent key support and resistance levels. The 5-year weekly chart below provides a closer look at this move higher.
Copper 5-year weekly chart. Created by Brian Kapp using a chart from Barchart.com
The orange line represents all-time high resistance. Copper is currently breaching this line after finding support near $4 at the purple line. While the $4 level is extended to the upside compared to the next two lower support levels, it should offer fairly firm support given the bullish fundamentals. Next lower support near $3.27 (the green line) should offer strong support if it is retested. It looks to be the floor for the foreseeable future.
In summary, the fundamental and technical backdrop for gold and copper look to be very bullish thereby providing a solid foundation to the bullish investment case for Barrick Gold.
Barrick Asset Detail
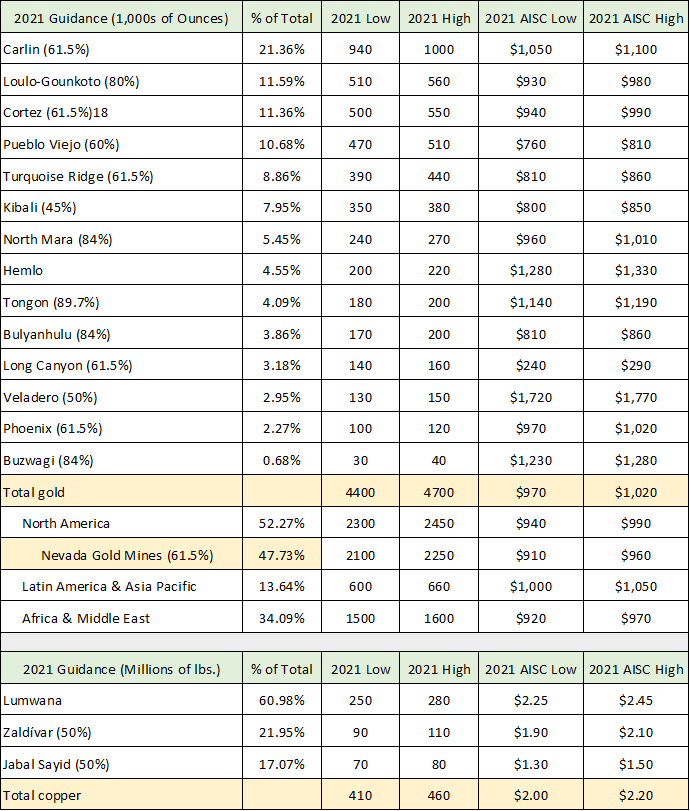
Barrick’s strong financial position is supported by an unusual portfolio of assets for the mining industry. Nearly half of its gold production is produced in Nevada in the United States. The United States is a very stable mining jurisdiction compared to much of the industry globally. This added operational safety is supportive of a premium valuation for Barrick. The following table was compiled from the company’s Q2 2021 earnings release. It displays each mine including its percentage of total commodity production, the company’s high and low guidance for 2021 production, and all-in sustaining costs (AISC) per ounce of gold and per pound for copper.
Source: Created by Brian Kapp, stoxdox
As mentioned above, Nevada Gold Mines accounts for 48% of total gold production (second highlighted row). These assets are controlled 61.5% by Barrick and 38.5% by Newmont. Total gold production attributable to Barrick across the portfolio (first highlighted row) is estimated to be between 4.4 and 4.7 million ounces in 2021, with a cost per ounce between $970 and $1,020. With gold trading at $1770, the company is achieving healthy margins in the range of 42% to 45%.
While the large concentration of gold production in Nevada could be a risk from a reserve and production standpoint, the geography remains prolific. Barrick’s exploration program is uncovering further resources near its Nevada mines which reduces this risk. The Nevada assets are diversified by sizeable African and Latin American mines.
It should be noted that there are incredible growth opportunities being unearthed in Canada for which Barrick is underinvested. These opportunities could enable further safe jurisdictional expansion while leveraging the company’s North America infrastructure. There are also sizeable opportunities to grow in Africa to further leverage the company’s Africa infrastructure and further diversify production. On the copper front, there are many opportunities to expand in South and Latin America.
With copper trading at $4.73 per pound and costs in the $2 to $2.20 range, margins are exceptional at 58%. Barrick’s material copper operations further differentiate it from most gold miners and provide a compelling case for a premium valuation for Barrick compared to most of its gold peers. The copper assets provide diversification when gold becomes weak and vice versa. With only three copper mines, Barrick has room for further copper expansion in diversifying its commodity portfolio.
Barrick’s Underlying Earnings Power
Given the bullish commodity price setup and the overview of Barrick’s portfolio, I will now circle back to Barrick’s sustainable earnings power looking forward. The intent is to build a framework from which to view the Barrick investment case under several commodity price scenarios in order to get a sense for the upside potential in shares as well as the downside risk.
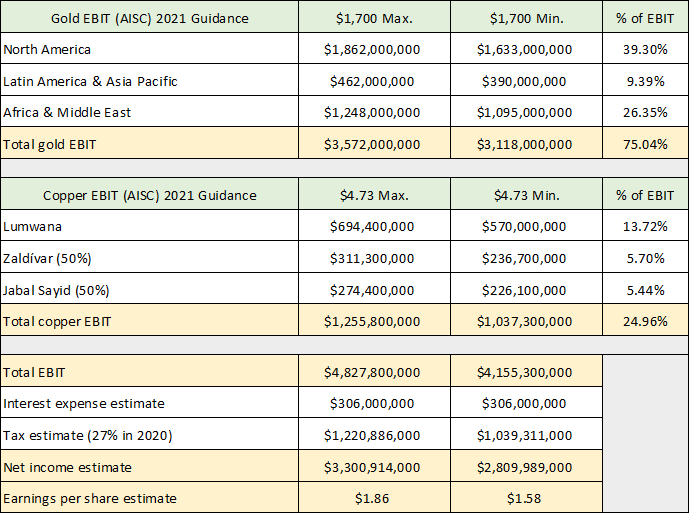
The following table was compiled from Barrick’s Q2 2021 earnings release using data from the previous portfolio details table. Specifically, I am using the per mine and per region guidance provided by the company for the minimum and maximum production and all-in sustaining costs (AISC) for each. The maximum column ($1,700 Max.) is my estimate of annual earnings potential assuming maximum production guidance is achieved while the minimum cost guidance is incurred across the portfolio. Likewise, the minimum column ($1,700 Min.) is my estimate of annual earnings potential assuming the minimum production guidance is attained while incurring the maximum cost guidance. (EBIT = earnings before interest and taxes). In each scenario I am assuming a current copper price of $4.73 and a gold price of $1,700.
Source: Created by Brian Kapp, stoxdox
Using these assumptions, Barrick should be able to achieve earnings of between $1.58 and $1.86 per share. The net income estimate range between $2.8 and $3.3 billion is in line with my initial estimate of Barrick’s adjusted income potential of $3.2 billion (above in the Financial Strength section when working with Barrick’s reported adjusted EBITDA). Please keep in mind that I am estimating Barrick’s underlying earnings potential rather than its reported income or cash flow in a particular period (which is subject to all manner of accounting and timing shifts).
Upside Scenarios
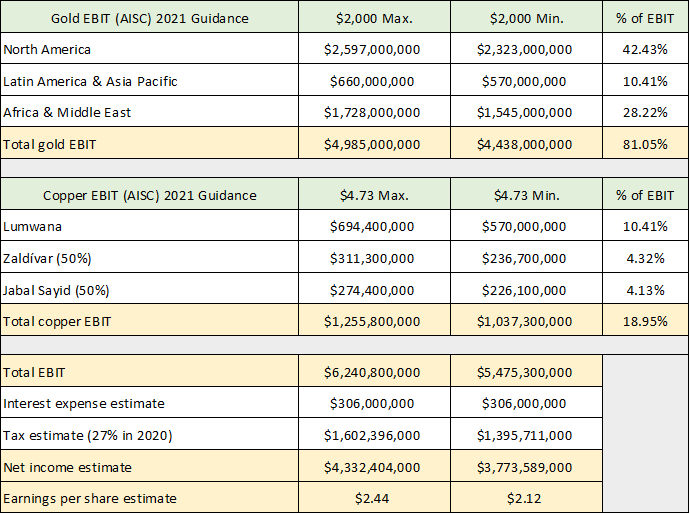
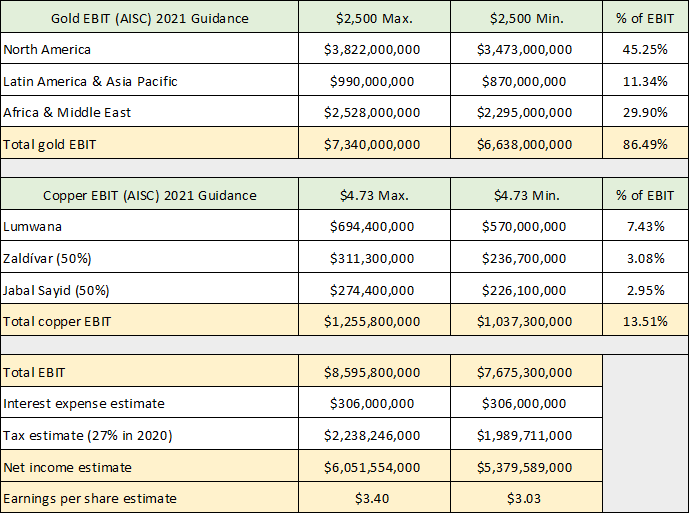
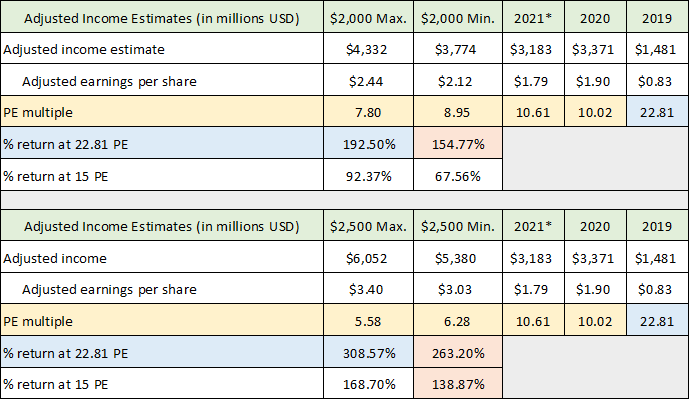
I believe the above to be a fair estimate of Barrick’s underlying earnings power if current conditions are projected forward. The outlook is bullish as discussed in the commodity review, and it is reasonable to project higher prices in the future to estimate Barrick’s return potential. I use the same minimum and maximum assumptions in the following scenarios as I used above, while tweaking the price per ounce and/or pound. For the upside scenarios, I run a scenario with gold at $2,000 and then at $2,500 while holding copper steady at the current price. The first two tables are for reference while the third summarizes the results of this scenario.
Source: Created by Brian Kapp, stoxdox
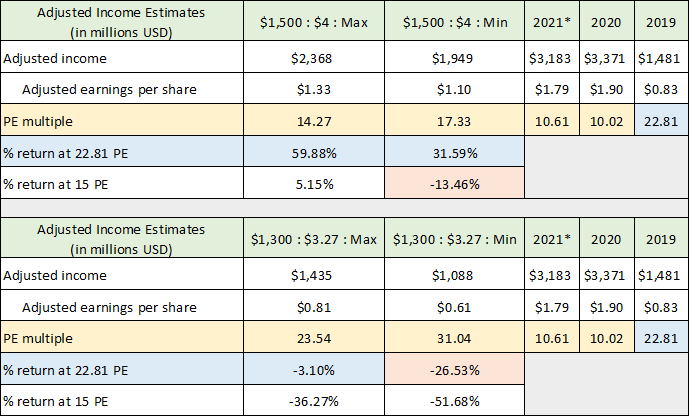
I have highlighted the important summary data from the two upside scenarios in the final table. The yellow row is Barrick’s PE multiple based on 2020 actual results, 2021 first half annualized results, and under the minimum and maximum scenarios. I have highlighted the blue cells which apply the actual PE ratio from 2019 to the maximum earnings estimate in each scenario. I then highlight in orange what I believe to be the most likely upside potential for each upside scenario.
In the $2,000 gold price scenario I believe the 22.81 PE from 2019 applied to the minimum earnings estimate is the best estimate of return potential. At $2,000 gold the market is likely to price in higher future gold prices leading to a high PE estimate (22.81 rather than 15). For the $2,500 gold price scenario both the 22.81 PE and 15 PE are reasonable expectations. The 15 PE at $2,500 gold may come into play if the market begins to discount less upside potential in the price of gold at $2,500. The 22.81 PE would reflect a continuation of bullish sentiment for gold prices to rise further.
The upside return estimates range from 68% to 309%, with 138% to 263% being the more likely upside targets in my opinion. Please note that if copper prices extend materially higher, there is further upside potential. I hold them steady here for simplicity and conservatism. The upside return potential is substantial in both scenarios, which I believe to be realistic.
Downside Scenarios
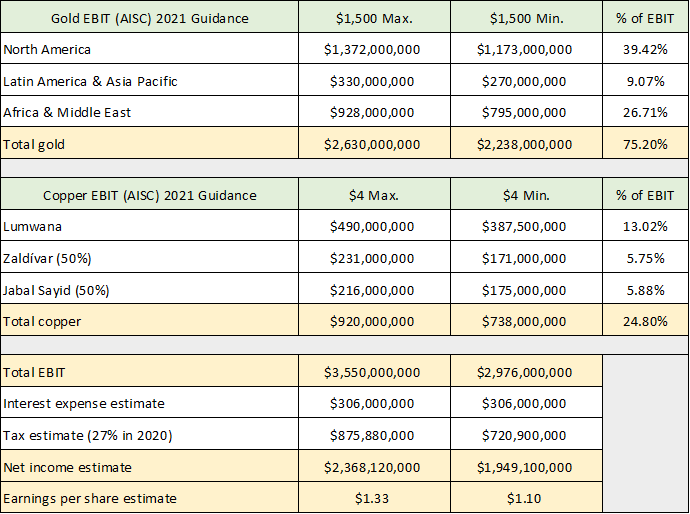
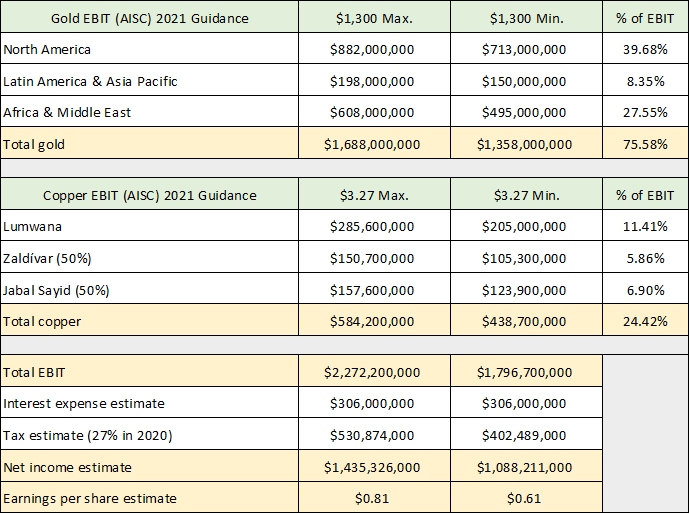
In the commodity review section several downside support levels were visible which I use in the following downside scenarios to quantify the risk/reward tradeoff. I use the same minimum and maximum methodology as above but modulate both gold and copper prices lower together. The first downside scenario is gold retesting nearest support at $1,500 while copper tests nearest support at $4. The second scenario assumes gold breaks lower to what I believe will be a floor of $1,300 while copper tests its likely floor at $3.27. The first two tables are the details for reference, while the third summarizes the results.
Source: Created by Brian Kapp, stoxdox
I have used the same highlighting scheme as in the upside scenarios summary table. The orange highlighted cells are my estimate of the most likely downside scenarios. A 15 PE is likely to be tested in the first downside scenario of $1,500 gold and $4 copper, producing a negative 13.46% return. In the more severe scenarios of $1,300 gold and $3.27 copper, the PE ratio is likely to hold much higher at 22.81 as market participants price in trough earnings leading to 26.53% downside potential. The total range from the downside scenarios is negative 52% to positive 60%, with negative 13% to negative 27% the most likely in my opinion.
The downside potential is well within the norm for any individual stock. It appears that Barrick’s current share price may have already priced in much of the first downside scenario ($1,500 gold and $4 copper) as three of the four return potential estimates are actually positive. I view the second downside scenario to be a worst-case as things stand. Any lower test of these levels should be short-lived given the strong fundamental and technical backdrop.
Estimate Sensitivity
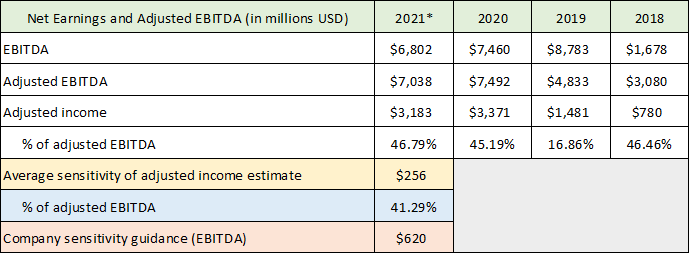
The above scenarios and the sensitivity of Barrick’s underlying earnings power are my estimates rather than the company’s guidance. The company did provide guidance for the sensitivity of its estimated EBITDA to changes in commodity prices. The following table provides Barrick’s guidance from its Q2 2021 earnings release. The company’s guidance for its EBITDA change in response to a $100 change in the price of gold is highlighted in orange.
Source: Created by Brian Kapp, stoxdox
The average sensitivity of my adjusted income estimate to a $100 change in the price of gold is highlighted in yellow. To provide a bridge between the company’s sensitivity guidance and my estimated sensitivity, I have divided my adjusted income estimates by the company’s adjusted EBITDA over the past three and a half years as an anchor. My estimated $256 million adjusted income change in response to a $100 change in the price of gold looks to be in the ballpark at 41% of the company’s EBITDA sensitivity guidance (47% on 2021* and 45% on 2020 adjusted EBITDA).
In summary, Barrick offers an enticing risk/reward tradeoff with 13% to 27% downside potential paired with 139% to 263% upside potential. Please note that this return spectrum is under what I believe to be the most likely scenarios. These scenarios assume Barrick continues on its current, more conservative growth investment course.
Growth Investment Optionality
If it so chooses, Barrick also has tremendous optionality on the growth investment front. There are many large greenfield projects being advanced by junior mining companies for which Barrick would be an excellent partner, with the resources to bring new world-class mines to the market. In addition, there are more obvious and less risky merger and acquisition options in the market today. I will highlight one example of a transformative growth acquisition.
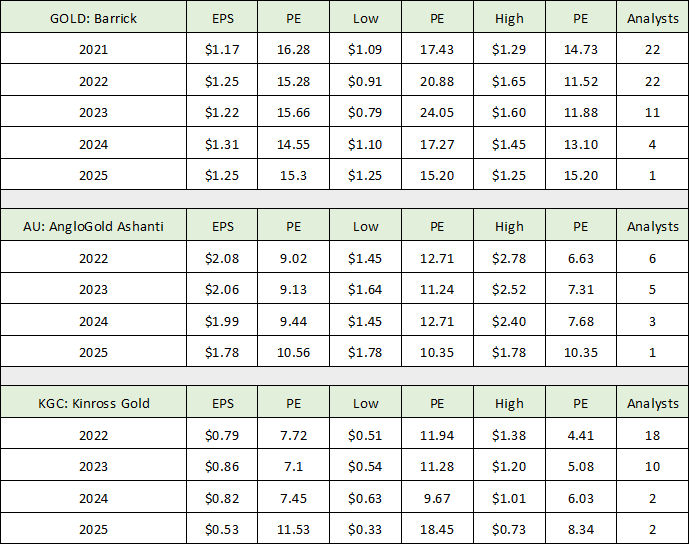
The following table was compiled from Seeking Alpha and provides consensus analyst estimates for Barrick Gold, AngloGold Ashanti (NYSE:AU), and Kinross Gold Corporation (NYSE:KGC) (the number 2, 3, and 4 gold producers). In the final table I summarize the most important data. This is for illustrative purposes and is but one example of the many attractive options available to Barrick on the acquisition front given the current bearish investor sentiment toward gold companies (low valuations).
Source: Created by Brian Kapp, stoxdox
Barrick is trading at an 81% premium to AngloGold Ashanti and a 111% premium to Kinross Gold (see the first PE column) based on 2022 consensus earnings estimates. Please note that the other PE columns are the PEs on the low analyst estimate and high analyst estimate to provide a valuation range for each company. Essentially, Barrick could acquire either company today and materially boost its gold production by nearly 40% in 2023. Barrick’s large valuation premium to the next two gold competitors translates into a very accretive acquisition at a scale that could transform Barrick for decades to come.
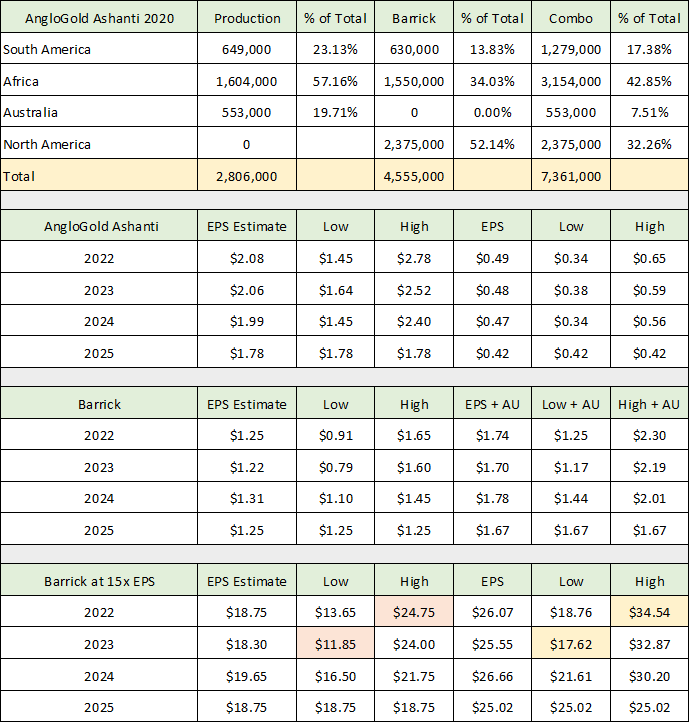
In the following table I show what an acquisition of AngloGold Ashanti with cash might look like for Barrick’s earnings power. I chose AngloGold for the example because its portfolio has the most synergies with Barrick’s portfolio. This includes their shared ownership of the world-class Kibali mine and close infrastructure proximity in Africa.
In the upper section of the table, I show the production of each company by region, and then the combined entity. In the second section I show AngloGold’s consensus estimates in the first three columns and what they translate into on a per share basis for Barrick’s shareholders in the final three columns. This is then followed by Barrick’s current estimates (first three columns) and Barrick’s earnings estimates including AngloGold Ashanti (final three columns). In the last section I highlight how the combination would benefit Barrick shareholders showing Barrick’s share price at 15x consensus estimates through 2025 on its own (first three columns) and with AngloGold Ashanti (final three columns).
Source: Created by Brian Kapp, stoxdox
I have highlighted in yellow the net impact that AngloGold would have on the high and low share price of Barrick. This is assuming that Barrick continues to trade at 15x earnings after acquiring AngloGold and consensus earnings estimates are hit. I have also highlighted in orange Barrick’s high and low share price if it meets current consensus estimates and trades at 15x earnings through 2025. The benefit to Barrick shareholders is a 49% higher low share price estimate ($17.62 vs $11.85) and a 40% higher high share price estimate ($34.54 vs $24.75).
These benefits to Barrick are immediate and would be amplified under the upside scenario provided above. The AngloGold combination highlights the growth opportunities available to Barrick in the current market.
Technicals
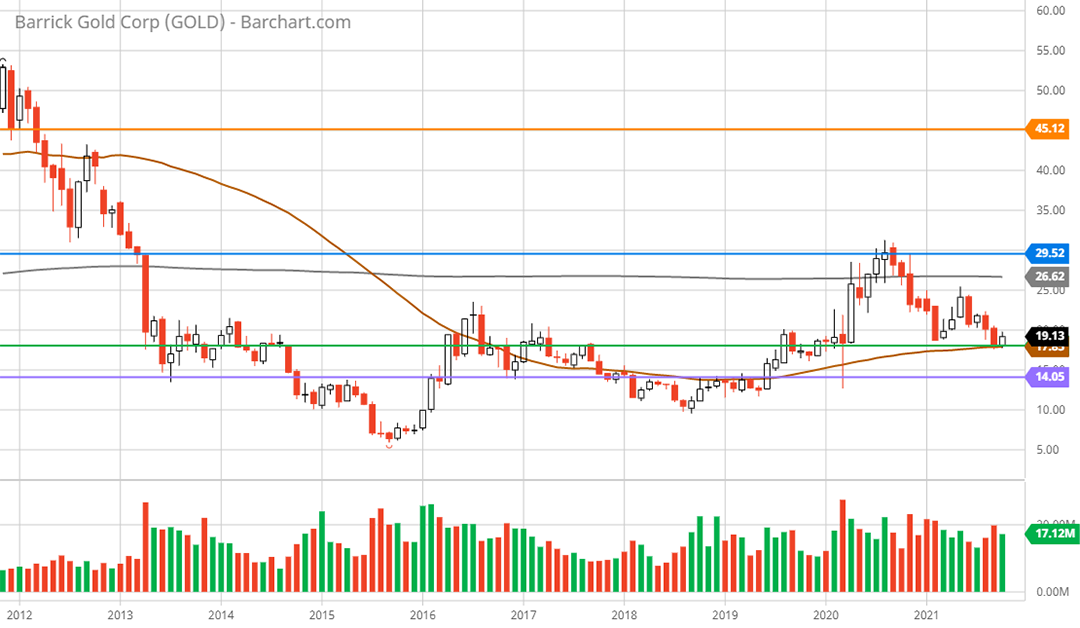
The upside opportunity available in Barrick stock is enhanced by its healthy technical backdrop. The shares have recently pulled back to a strong support level near $19 denoted by the green line on the 10-year monthly chart below. This area was the first major resistance on the rally off the bear market bottom in 2015 into 2016, and it was resistance in 2019 into 2020. This should be a low-risk accumulation area for the shares. The next lower support level is near $14 (the purple line). This is likely to be a worst-case scenario as things stand.
Barrick Gold 10-year monthly chart. Created by Brian Kapp using a chart from Barchart.com
The blue and orange lines highlight the primary overhead resistance zones for Barrick. The blue line near $30 is 58% above the current price, offering substantial upside before heavy resistance. The next major resistance area is near $45 (the orange line). The $45 key resistance line was drawn from a longer-term chart not shown here. This would represent a 137% increase from current levels. Each of the resistance zones aligns well with the upside return scenario calculated above.
Summary
The current share price offers an excellent entry point from a technical perspective. When combined with the bullish long-term technical setup for gold and copper, the investment case for Barrick is timely. The company’s powerful financial position provides excellent optionality given the current investment opportunity set in the mining industry. If the company chooses to implement a timely growth strategy, the upside opportunity could become amplified in a bullish commodity price environment.
Price as of report date 10-19-21: $19.07
Barrick Gold Investor Relations Website: Barrick Gold Investor Relations


