Generac’s (NYSE:GNRC) corporate purpose, as stated in its February 2023 investor presentation, is to lead the evolution to more resilient, efficient, and sustainable energy solutions. As the energy transition is the largest secular growth opportunity of our time, pure plays like Generac stand out as uniquely asymmetric risk/reward opportunities.
Residential Opportunity
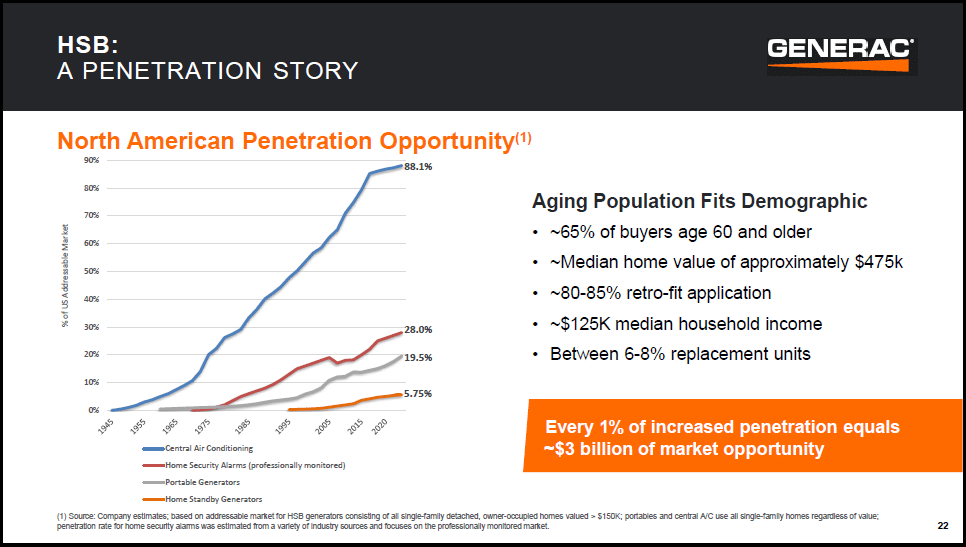
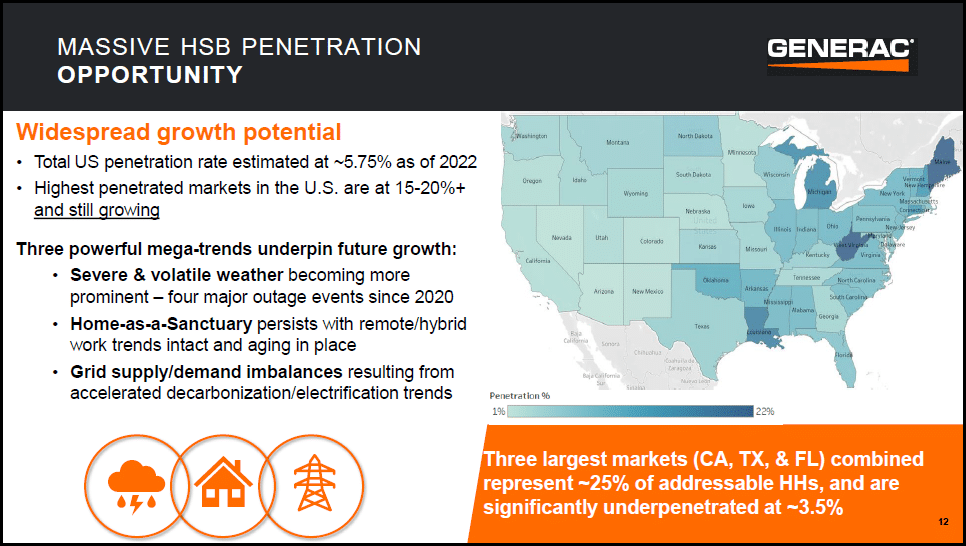
Generac’s business can be divided into two distinct end-market segments, residential and commercial/industrial. Beginning with residential, the following slides from the February 2023 investor presentation capture the essence of the opportunity. Please note that the blue and the orange lines represent central air conditioning and HSB (home standby power) penetration in North America, respectively.
As someone with experience in single and multi-family residential real estate, it is easy to envision home standby power systems (the orange line in the first image) following the path of central air conditioning (the blue line in the same image). In order to sell a mid- to high-end residential property today, central air conditioning is nearly a universal requirement. This of course was not always the case, as market expectations have evolved over time.
Notice that Generac estimates that a 1% increase in penetration in the HSB market translates into $3 billion of sales potential. For reference, Generac generated $4.6 billion of total sales in 2022, with $2.9 billion coming from the residential segment. If the HSB market tracks central air conditioning, going from 6% to 88% penetration equates to a $245 billion residential revenue opportunity in North America alone.
Home standby power, or distributed energy, is a secular growth opportunity. If 88% market penetration occurs, it is likely to take many decades as was the case with central air conditioning. Looking out over the coming decade, the portable generator penetration rate is likely to be a realistic target (the grey line in the first image). If 20% penetration is achieved, the revenue opportunity for Generac is around $42 billion.
Growth Estimates
I view 20% penetration as a realistic possibility over the coming decade. Reviewing market expectations in the context of the North American residential HSB opportunity provides a foundation on which to move forward. The following table displays consensus sales growth estimates through 2027.
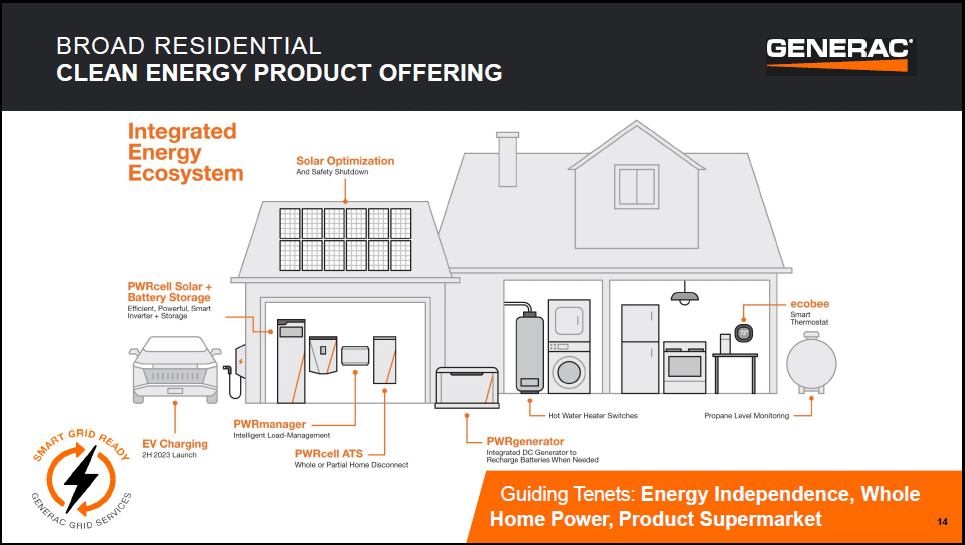
In light of the home standby power market, which is just one sliver of Generac’s opportunity set, annual sales in the range of $4 to $5 billion per year into mid-decade should be achievable. Keep in mind that the end market is inherently cyclical, and thus prone to volatility. This can be seen in the 2023 decline estimate of -10% following sales growth of 22% in 2022. The following image summarizes Generac’s larger residential product footprint.
Generac’s full residential product suite opens the door to competitive differentiation. It is positioned as a one-stop shop for home electrification. The breadth and depth of its products create packaging and pricing optionality, which in turn enables greater market segmentation, and thus penetration.
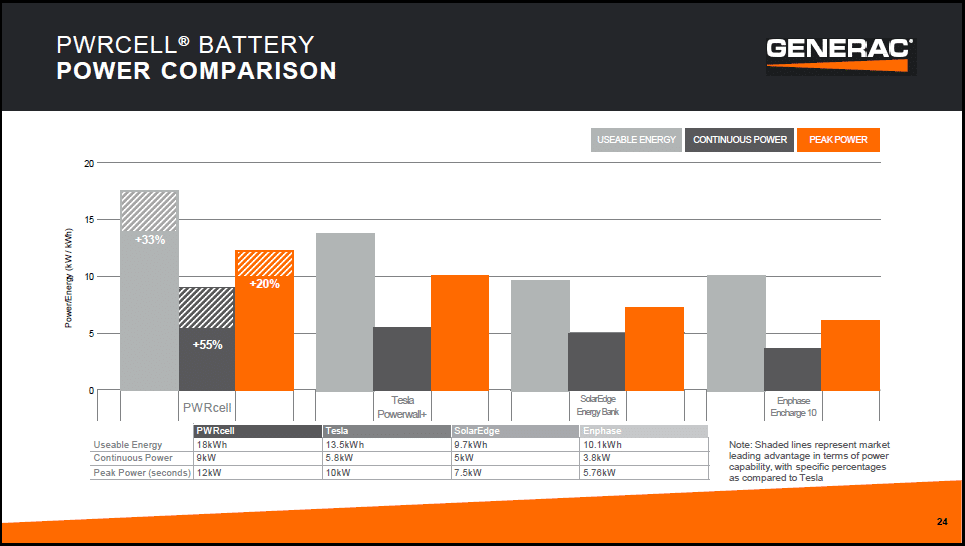
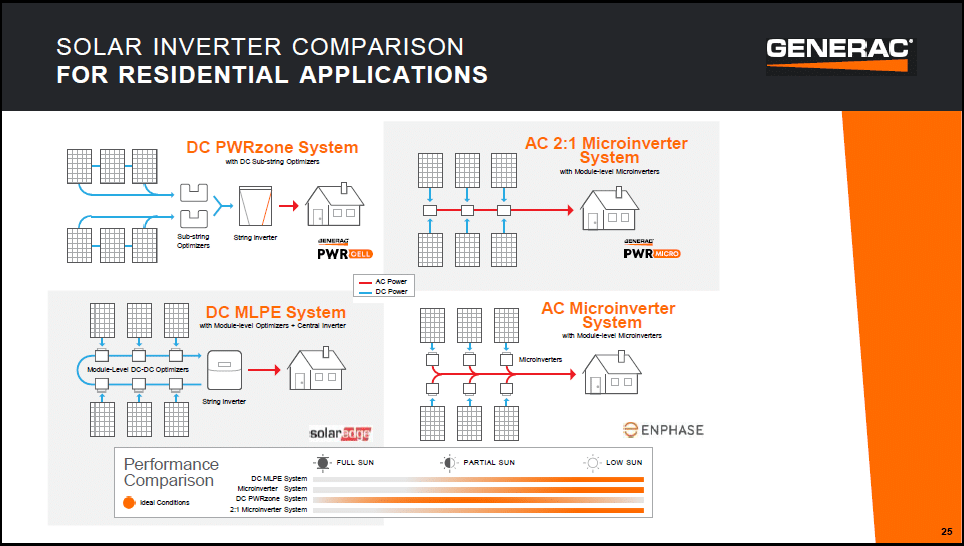
In the following slides, Generac compares itself to several residential competitors in the home battery and solar inverter product categories. The importance of the comparison is in the comparable companies themselves, which are three energy transition highflyers in today’s stock market: Tesla (NASDAQ:TSLA), Enphase Energy (NASDAQ:ENPH), and SolarEdge Technologies (NASDAQ:SEDG).
It is clear that the integration of batteries, solar systems, standby power, and whole house electricity is a growth market. While Generac may or may not offer performance superiority, as shown in the battery comparison, it does in fact have a full home electrification product suite. As a result, Generac has a positioning advantage over its competitors in the broad residential market.
Valuation
The importance of the above comparison becomes clear when reviewing Generac’s valuation to that of Tesla, Enphase Energy, and SolarEdge Technologies. Keep in mind that the four companies are not directly comparable in a strict sense. Rather, the companies represent equally viable options in the universe of energy transition investment alternatives. As such, from a portfolio perspective, they are directly comparable.
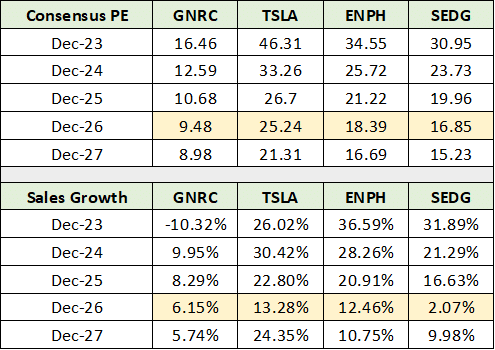
In the upper portion of the following table, I compare the valuation of the four companies based on consensus earnings estimates. In the lower section, I compare consensus sales growth estimates. Estimates for 2026 are highlighted in yellow for ease of comparison.
By 2026, the sales growth rates for all four companies begin to converge, while the valuation dispersion between Generac and the group remains quite large in comparison. If today were April 2025, Generac would be relatively attractive compared to the group.
Furthermore, the expected sales growth rates for Generac’s three energy transition comparables through 2025 are unusually high. This is especially the case for Tesla given its current size in comparison to its likely market share limitations, which are innate in the auto industry.
Given the heightened expectations, the probability of missing consensus estimates in 2024 and 2025 is elevated for the three comparable companies. As a result, trading at 13x 2024 estimates, Generac offers a relatively attractive opportunity for exposure to the residential energy transition.
The asymmetry of the opportunity is supported by Generac trading at a steep discount to its 5-year average valuation multiples, as can be seen in the following table. Note that Generac is trading in line with the median valuations across the broad industrial sector while offering above-average secular growth potential.
Commercial and Industrial
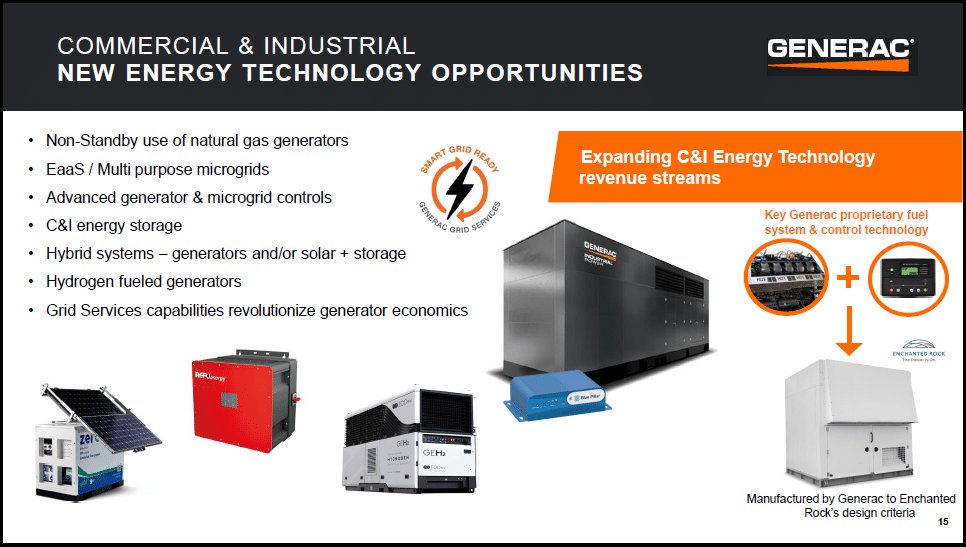
In addition to residential, Generac has material exposure to the energy transition in the commercial and industrial sector, as can be seen in the following images. The non-residential market accounted for 36% of Generac’s sales in 2022. The forecast for 2023 is for the commercial and industrial segment to grow sales at a mid-to-high single-digit rate compared to a high-teens percentage decline in the residential segment.
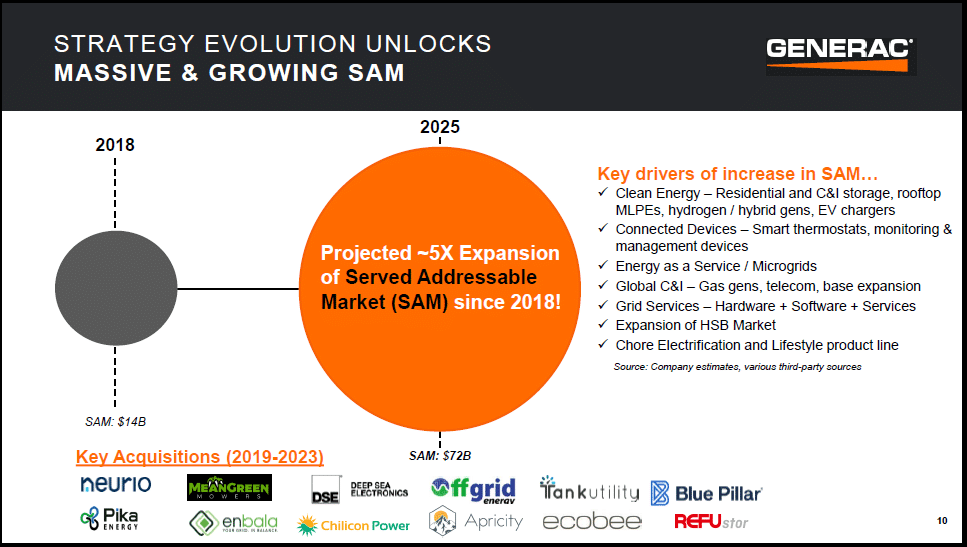
In the second image, notice that acquisitions are a core component of Generac’s growth strategy. This is especially true in the commercial and industrial segment. The acquisitions have expanded Generac’s served and addressable market from $14 billion in 2018 to $72 billion looking out to 2025. This estimate includes both the residential and commercial segments.
While acquisitions are a viable and proven growth strategy, the approach comes with heightened risks. The primary risks pertain to successful integration of the acquired companies and the potential for capital misallocation given investor pressure to meet growth targets. An added risk is that most of the acquisitions occurred during a time period of rather extreme valuations, generally speaking.
While there will be the inevitable write-offs related to past acquisitions that do not pan out, Generac has assembled a full product suite for both the residential and commercial segments. The company is well positioned for customer retention and growth in both the residential and commercial markets.
Furthermore, Generac has built a broad and deep distribution network which provides the needed market reach and service capabilities to successfully execute its growth strategy. Importantly, no single distribution partner accounted for more than 4% of total sales. From the 2022 annual report:
We believe our global distribution network is a competitive advantage… Our network is well balanced with no single customer providing more than 4% of our sales in 2022… We have the industry’s largest network of factory direct independent generator dealers in North America.
Of note, Generac works with a financial institution to finance select dealer floor plans for which it provides an inventory repurchase guarantee to the financing institution. One such dealer filed for bankruptcy recently, which required Generac to fulfill its inventory repurchase obligation. Distributors utilizing this financing method accounted for 15% of sales in 2022.
All told, Generac is operating in well-defined secular growth markets in both the residential and commercial segments, with a full suite of products and distribution partners. It has all the ingredients required for success, thus leaving execution as the primary fulcrum on which the future will be determined.
Technicals
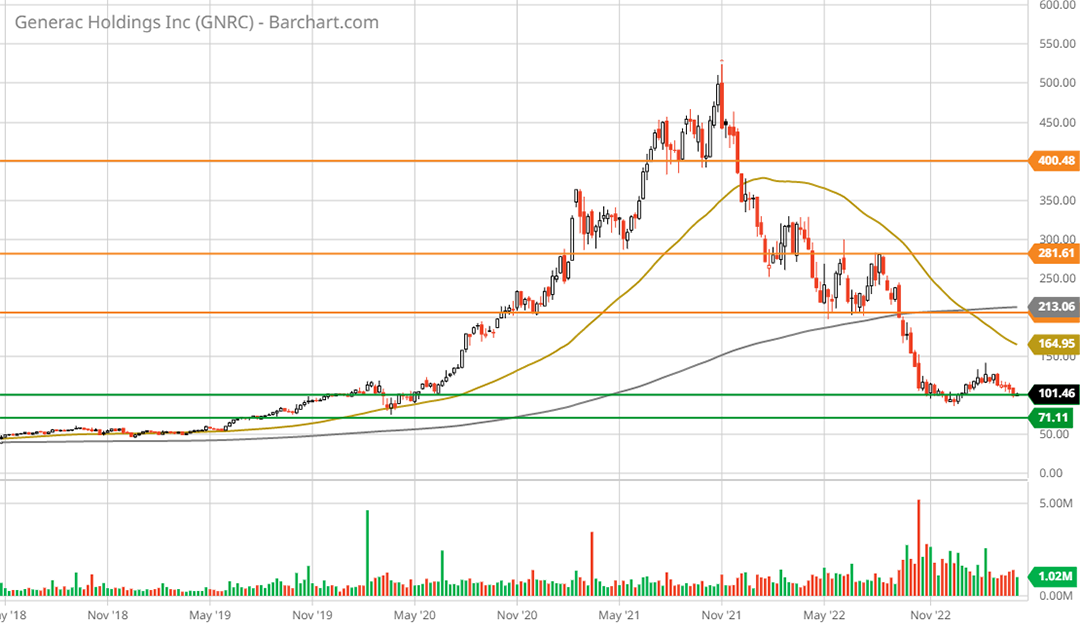
Turning to Generac’s share price action, the 5-year weekly chart below captures the essence of the technical setup. The shares experienced an explosive 400% rally during COVID, which has now been fully reversed. Note that the orange lines represent key resistance levels, and the green lines bracket the primary support zone between $70 and $100.
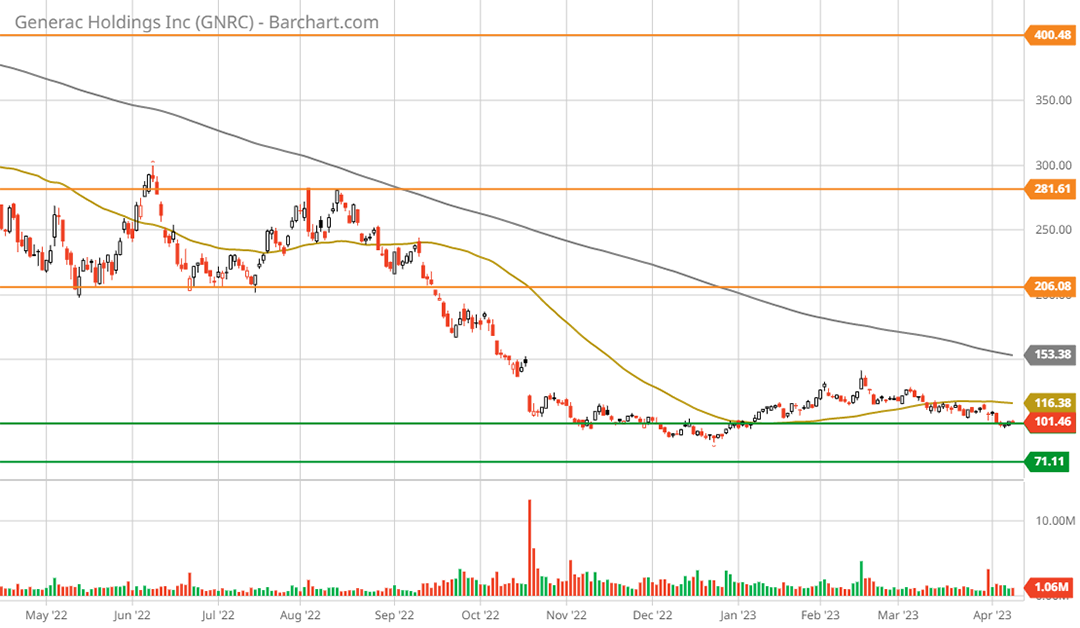
The shares are now testing the upper end of the support zone while attempting to form a double bottom. The downside to the upper and lower support levels is -1% to -29%, respectively. In contrast, the upside potential to each of the three resistance levels is 106%, 182%, and 300%, respectively. The following 1-year daily chart provides a closer look at the technical setup.
The key feature of the 1-year chart is the bottoming process over the past six months. As the market has rallied strongly since October 2022, Generac’s underperformance is notable. The underperformance highlights what I view as the most likely near-term scenario, disappointment. Said differently, the market looks to be pricing in such a disappointment in regard to consensus estimates in the coming quarters. This dynamic introduces upside surprise potential.
Summary
As Generac is inherently a cyclical growth company, and recessionary conditions are in effect, the question is primarily tactical in nature. With the shares testing the upper end of the primary support area, at minimum, Generac is on the cusp of an ideal accumulation zone.
Given the recessionary macroeconomic backdrop, it would not be surprising if the shares test the lower end of the support zone toward the $70’s in the coming months. Looking out to mid-decade and beyond, regardless of the near-term price action, the risk/reward asymmetry is decidedly skewed to the upside. Generac should be on the accumulation radar of growth-stock investors.
Price as of this report: $100.32

